Crypto (MCOBTC) Profits Potential (270% to 620% PP)Crypto (MCOBTC) is moving positive and still has lots of potentials to grow more.
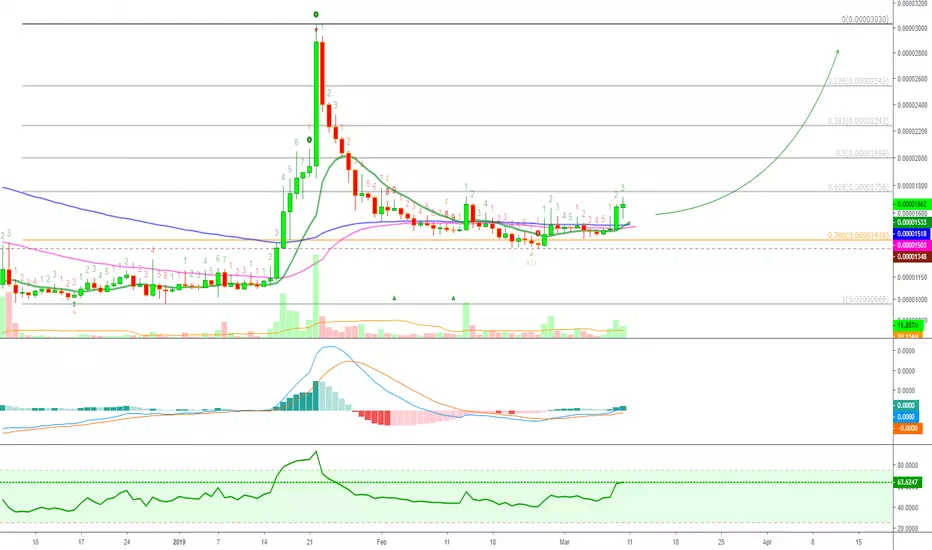
Take a look at this chart, this is the weekly time frame, here you can see the profits potential to the last peak hit and also the all-time high for MCOBTC:
We have an active trade for this altcoin which already generated over 80% profits, you can see it here:
As for the chart today, we have:
High volume breakout.
Bullish MACD and RSI.
There is room for additional profits, specially when looking at the weekly chart.
Conditions for change: The charts for Crypto are looking really solid, even with a strong drop, MCOBTC will remain bullish as long as it trades above the green trendline.
What's your take on MCOBTC?
Hit like to show your support and share in the comments section below...
Thanks a lot for reading.
Namaste.
Huobi

Monero Full Long Term Trade [XMRBTC](139% PP)Monero (XMR) Overview
Private Digital Currency
Monero is cash for a connected world. It’s fast, private, and secure. With Monero, you are your own bank. You can spend safely, knowing that others cannot see your balances or track your activity.
Monero (XMR) Chart Analysis
It is great to start by looking at the charts long term, gives you a better perspective and also helps you gauge the profits potential of an altcoin. Here is the long term chart for Monero (XMR):
I believe the upcoming cryptocurrency bull market will be less “parabolic” than last time. Meaning, it will go as high if not higher (this will take a long time of course) than in 2017 but it will do so gradually… Taking longer to reach high targets.
At least that is the feeling that I am getting from reading hundreds of charts and my general experience with these altcoins.
Now, looking at Monero (XMRBTC) closer, you can easily spot the increase in green volume, as well as the fact that XMRBTC is now trading above EMA10. Here is the chart:
Finally, easier to read is the weekly time frame chart:
Marked green is our demand zone/support. A strong close below this level makes XMRBTC bearish, so we close our trade if that happens.
Anything above this green zone we are positive and this is where we wait patiently for a breakout.
Remember, there are many different ways to trade. You can buy in with a tight stop-loss awaiting the breakout, or you can buy after the breakout. Normally we trade by buying and waiting patiently.
Note: This is a LONG TERM trade. Any trade can take days, weeks or months to fully develop.
All trades remain active unless the stop loss is activated.
We always raise stop loss above buy-in price after we hit our first target, regardless if it is mentioned, suggested or not. This is how you keep your trades profitable, cryptocurrencies are really volatile.
Let’s get started… Let’s start to trade!
Monero (XMRBTC) Trade Instructions by Alan Masters
Buy in: 0.0122 – 0.0129
Targets:
(1) 0.0139
(2) 0.0152
(3) 0.0165
(4) 0.0188
(5) 0.0209
(6) 0.0231
(7) 0.0266
(8) 0.0300
Stop loss: Close weekly candle below 0.0100.
Capital allocation: <15%.
I LIVE FOR THE DAY… AND THAT’S TODAY
Living in the moment can expand your awareness and helps with increasing the enjoyment of life.
Living in the moment might not be easy, but it is the way to win.
So start living in the moment, appreciate the moment, enjoy the moment, focus on NOW!
That’s today… The day for which I live!
Namaste.

SteemDollars Bullish Pattern And Signals (GREEN)Hey hi, how are you doing today?
How is the cryptocurrency market treating you?
Many new opportunities are developing every day, and old ones paying great profits with much more to come (check the related ideas).
It's been a while since our last SteemDollars (SBDBTC) analysis. I did a search on my profile and the latest one is from September 21st, 2018.
I am happy to share that we hit all of our targets for great profits, you can see it here:
Now, I am seeing that SBDBTC is getting ready to move again so I am sharing it with you in case you too want to profit.
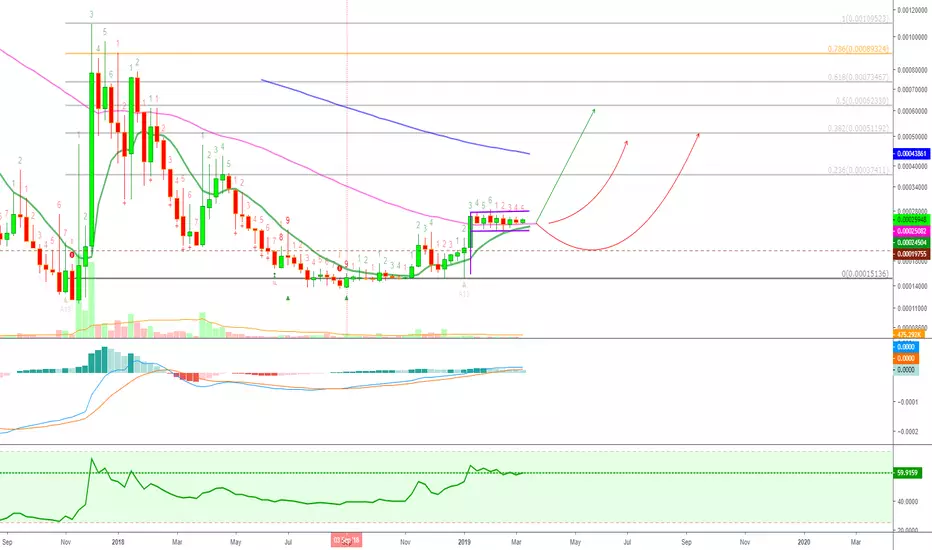
We are looking at a weekly chart here, so this is long term... feel free to hit like now, if you want to and let's get started with the chart!
Notice how SBDBTC has been moving up steadily since September '18 without much retrace.
It has gone through a long period of consolidation above EMA50 and now EMA10 is moving up as well.
The RSI is strong at 59 showing that the bulls remain in control.
We have a bullish pattern called a "bull flag" or "bullish rectangle" which can easily break up.
Conditions for change: This is an easy set up to trade but things can always change. A break and close below EMA50 and EMA10 would change this set up and a new analysis is needed. Remember to always use a stop loss.
This is not a piece of trade advice.
Thanks a lot for reading.
Remember to hit like.
Namaste.
Status Network Token Prints High Volume (Already In Profit)Status Network Token (SNTBTC) is another altcoin that is starting to move.
We already have an active trade in profits for this one, you can find it here (we are looking at 35%+ profits already):
But I wanted to do a quick analysis on this chart for you, as there is lots of room left available for growth, so here are the signals:
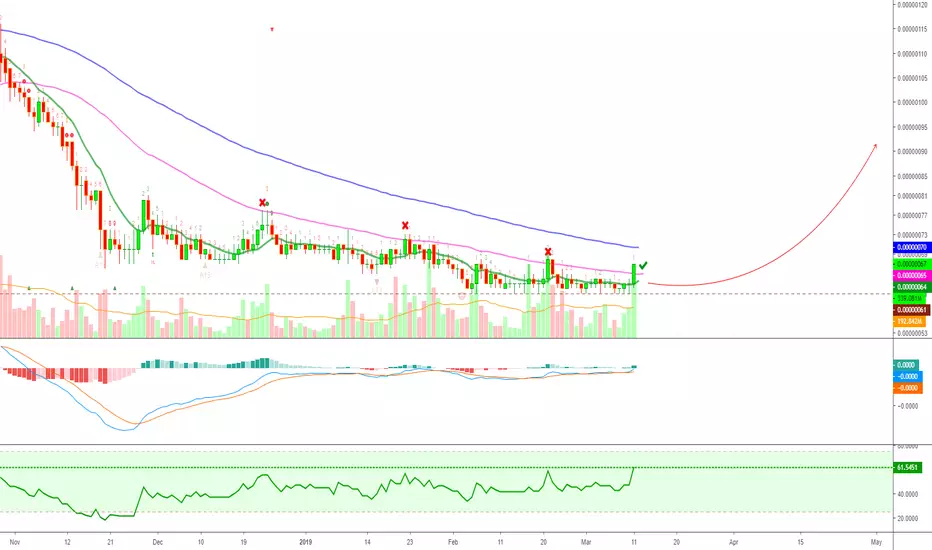
We can see a recent break above EMA10, EMA50, and EMA100, which is really bullish supported by big volume.
We can clearly see an increase in green volume, a significant increase. This is really bullish and supports the recent break above resistance.
Last time SNTBTC broke above resistance without good volume supporting it (marked blue circle), it quickly fell back down.
So we have the high volume breakout and a follow up with the next day candle which is green.
The MACD is entering the bullish zone, and the RSI is strong and trading above all resistance.
Status Network Token is set up to generate some good gains in the coming weeks, but things can change...
Conditions for change: If SNTBTC loses momentums, breaks down and closes below support (EMA10, 50 and EMA100), then the above signals are invalidated and a new analysis is needed.
SNTBTC is now bullish and additional bullish action is expected.
Feel free to hit like if you were entertained or learned something by the content of this post. Or simple hit like to show your support.
Thanks a lot for reading.
Namaste.

Siacoin (SCBTC) Breaking Resistance (Quick Short Term Update)We've been following Siacoin (SCBTC) for quite a while now anticipating its next bullish wave.
Siacoin (SCBTC) is a very stable altcoin and best it can generate really massive profits, moving up 3-5x easily in a matter of weeks when it starts to move.
Now, it hasn't been able to break above EMA50, which is the magenta line you see on the chart.
Each time this resistance was challenged SCBTC moved down.
EMA50 is being tested again and it is looking like it will completely break this time, which can send SCBTC flying up.
We have the MACD now at the neutral zone and trending up.
The RSI is sitting strong at 58.
Trading volume keeps increasing and SC is now trading above EMA50. Needs to close and remain above it in order for this signal to be confirmed.
SCBTC Tested 61 satoshis as support since the 2nd February and the level held nicely. Yesterday it touched 61 satoshis and today it is sitting at 67, a 10% increase and a high volume breakout above EMA10 and EMA50.
Siacoin is looking bullish again.
If the bulls follow up on this attempt at a breakout, you can check our FULL LONG TERM trade for Siacoin (SCBTC) here to trade it for profits (800% Profits Potential):
Conditions for change: If SCBTC moves down and closes below 61 satoshis, the above short term signals are invalidated. Still, a bounce is very likely to happen at the next support.
We remain bullish LONG TERM for Siacoin (SCBTC).
Thanks a lot for reading and remember to hit like...
DEEP WITHIN
Endless space of a substance unknown.
Hard to define from its surroundings, full of mysteries, secrets, and life.
Deeper than imagination, but with a measurable reach.
It can go deep, deep, deep… It is all relative.
We can be talking about your Soul, your Emotions, the Universe or even the Sea.
Even love is full of mysteries and secrets… and also lives DEEP WITHIN.
Namaste.
Polymath Getting Ready -Full Trade [POLYBTC](102% PP)Polymath (POLY) Overview
The Polymath network connects token investors, KYC providers, smart contract developers and legal experts who help form the basis of your securities token.
Polymath (POLYBTC) Chart Analysis
Here is a new trade for Polymath, this one generated really good profits for us in the past:
High volume starting now.
Bullish MACD and RSI.
Low risk, high reward.
Over 100% profits potential.
Trade instructions Polymath by Alan Masters
Buy in: 0.0000231 – 0.0000264
Targets for POLYBTC by Alan Masters:
(1) 0.0000291
(2) 0.0000331
(3) 0.0000371
(4) 0.0000411
(5) 0.0000451
(6) 0.0000481
(7) 0.0000535
Notes:
Not all targets are meant to be reached. You are supposed to sell as soon as we hit our first target and start collecting profits.
Stop loss should be raised after we start to hit our targets.
You can also buy and forget, hold long term, and aim for the higher targets.
Stop loss: Close below 0.0000197 on the weekly candle.
Capital allocation: <5%.
NOT YET… TIME PREPARE
Wait a minute. Sometimes it is good to wait.
We might get excited and all, but the system not being ready, means we have more time to reflect.
More time to prepare, to train, to relax.
Wait… Not yet…
At its own pace… on its own time…
All of your true desires will come to pass.
Namaste.

Civic's Long Term Potential (Quick Analysis) Up to 1000% ProfitsCivic (CVCBTC) is showing some really good long term potential and the charts are positioned, and ready, to generate us some profits.
This will be a quick analysis, for learning and entertainment, so feel free to hit like anytime you want now...
Let's get started!
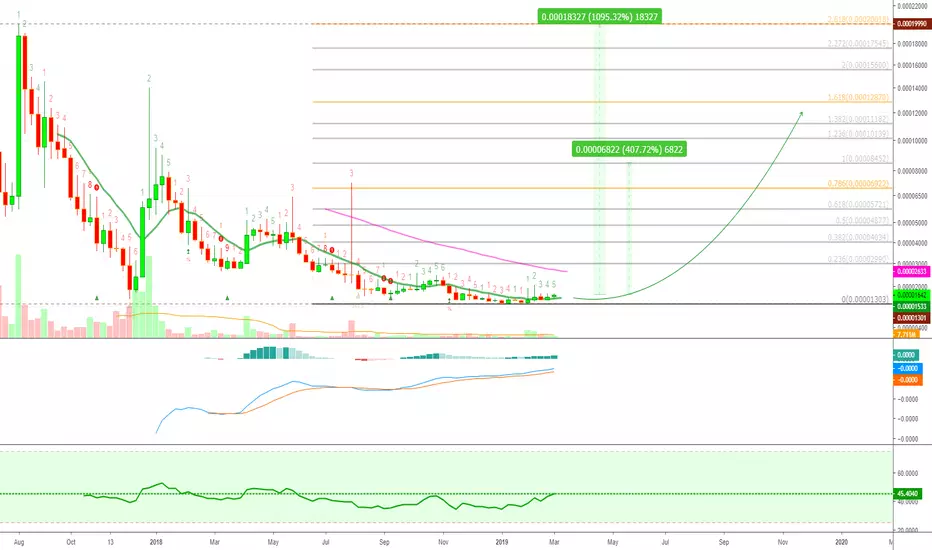
Civic (CVCBTC) Long Term Chart:
CVCBTC Hit a new all-time low and has been retracing for over a year and a half.
Now is trading above EMA10 with increasing volume.
The RSI is bullish and trading above recent resistance.
The MACD is gaining momentum while trending up.
More than 1000% profits potential to all-time high.
Conditions for change: If CVCBTC breaks down and closes below EMA10, the above signals are invalidated, yet its long term bullish potential still remains.
Keep an eye on this one... you can thank me later when you collect the profits.
Thanks a lot for reading.
Namaste.
Siacoin Breaks Resistance (Will Continue Going Up!)Siacoin (SCBTC) has broken above resistance with yesterday's candle, breaking above EMA50 with above-average volume.
If you take a look at the volume on the lower part of the chart, you can see it has been gradually increasing. The recent break above EMA50 and the RSI and MACD trending up.
Now, all that SCBTC needs to do is remain above EMA50 so it can push higher.
Conditions for change: If SCBTC falls down and closes below EMA10 (65 satoshis at the time of this writing), then the above signals are invalidated and a new analysis is needed, yet, it will most certainly bounce to try and increase its value.
Here is our long term trade for Siacoin (SCBTC):
Feel free to show your support by trading it, collecting profits, sharing it and hitting like!
Namaste.

Loopring Trade Signal [LRCBTC](70% PP)Trade: Loopring (LRCBTC)
BUY: 0.00001520 - 0.00001700
TARGETS:
(1) 0.00001950
(2) 0.00002200
(3) 0.00002500
(4) 0.00002900
STOP: Close daily candle below 0.00001300.
Quick analysis for Loopring (LRCBTC) daily chart:
Full retrace completed to 0.786 Fib. retracement support.
Bounce and break above resistance after the above-mentioned support was hit.
Increasing green volume.
Bullish MACD and RSI.
This is a trade signal, straight forward to the trade.
Enjoy the profits and feel free to support our work by hitting LIKE.
Thanks!
Namaste.
HB10/USDT 1w March-April-MayNot a call to action, my opinion.
March - accumulation
April - return to February level
May - Pamp

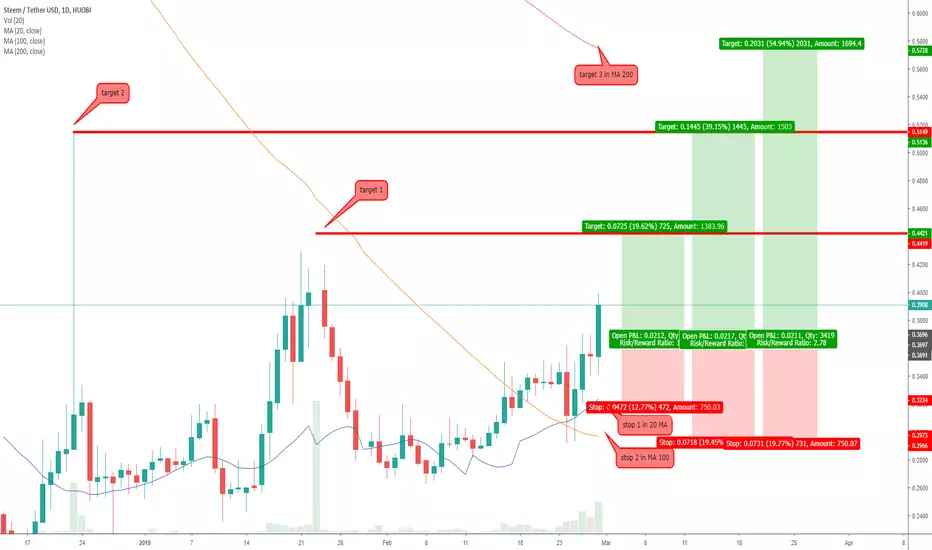
STEEM/USDT - D1 - And the victory goes to...... BULLS!With the breakout of this little accumulation given by the strength shown by the 20 and 100-day-moving averages, so we have a strong bullish movement, with 3 possibilities of exit targets, as shown in the chart above.

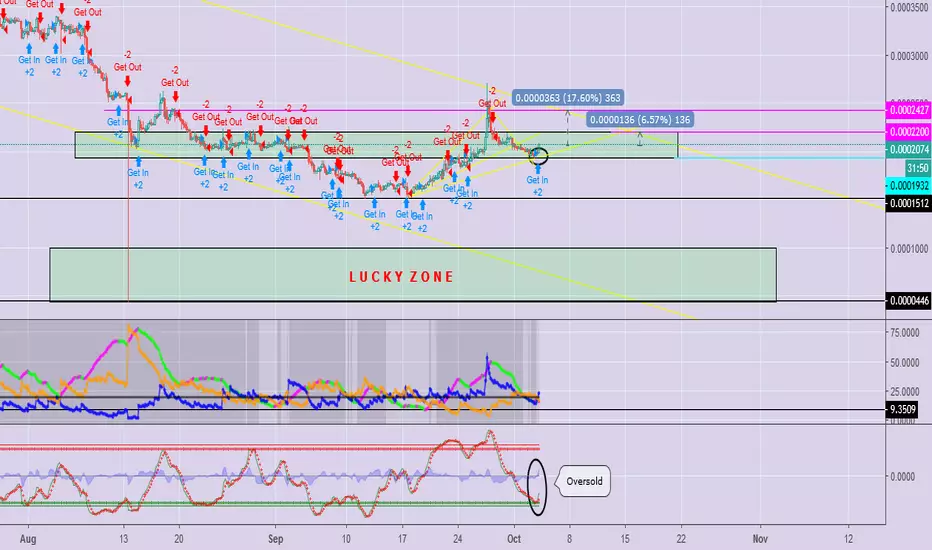
Scalping Target on $GXS is Potentially 6% - 17%. On Board?GXSChain is a coin with 100mils supply with 60% of it on circulating. One of it's biggest volume on the market is against CNY. Yes, China Yuan! Meaning chinese love this stuff or some whale of Chinese grind on this chain.
Charts looks quite bottom at the moment on the 4HR time frame the RSI so oversold, looking forward for some swinging movement upward.
My target are 2200 and 2427 as I mark it with pink line. I love pink for my targets. It's sexy. And stop-losses on blue line. I kinda dislike this kind of blue but it makes me clearer that i need to stop-loss if my favorite setup going to wrong direction.
GXS Chain you shoud on board peeps. If you like the idea you can give your likes, comments and sharing this idea and don't forget to follow me to support. Trade safe!
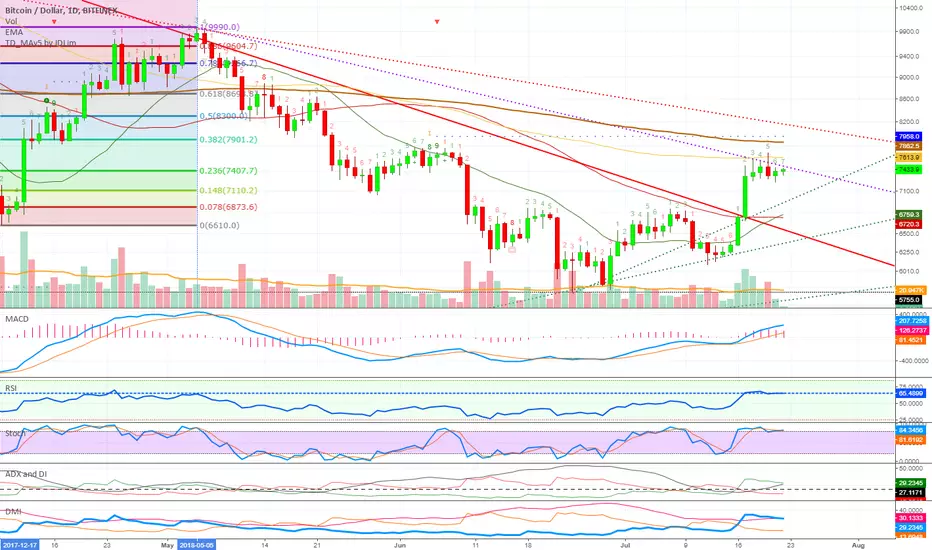
Bitcoin: 3 Ways To Spot Resistance (4 Beginners)Let me show you a quick way to find resistance levels, which are also known as targets when you are looking to sell for profits when trading a coin.
Above you have the Bitcoin chart with 1 candle per 24 hours; Daily time frame.
Bitcoin price is likely to stop at the next resistance point. Note the word "likely", because there is always the chance of the price going higher and breaking more than one resistance. This is of course an example based on an up move.
Let's get to it:
1) Indicator TD Sequential: My indicator is telling me that there is resistance at the $7958 price.
2) EMA indicator: EMA200 shows resistance at $7862.
3) Fibonacci Tool: Based on the April bull move, Fib numbers show resistance at $7901.
If you go by what these indicators are telling you, you could easily say that Bitcoin will face resistance in the $7850 - $8000 range.
There are many more ways to find resistance points and also tools that can be used for this same purpose, but these are very easy to work with and can help you become better at making the right choices when trading.
The same tools can be used to find support levels.
Once you have resistance and support levels, it becomes a lot easier to trade or try and figure out what might come next.
I hope you enjoy this post... My deepest love and gratitude to you...
Namaste.
Huobi Crypto Announcement - XRP AI/ML SignalThe Huobi Group, has announced that it is opening an office in London. Additionally, the firm will be opening Huobi OTC and Huobi Quant Trading. The two trading programs will be geared towards “master crypto-traders” who trade large amounts of cryptocurrencies. Huobi stated that trading large amounts of cryptocurrencies over-the-counter is much safe rather than on an exchange due to the difference in price stability. The OTC service will have a zero percent commission fee. The exchange’s Quant Trading service will feature a trading platform for quantitative traders to perform arbitrage, market making and trend predictions.
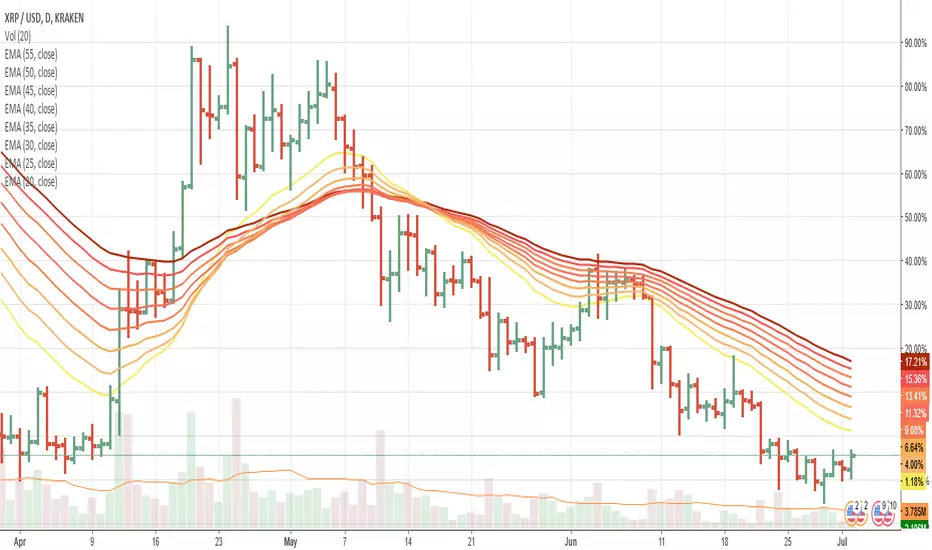
The AI Machine Learning 3-Day Crypto Signal for XRP is Don’t Own and was published this morning. Learn how to use ML 3-Day signals when trading cryptos. The average accuracy score for the Machine Learning algorithms for XRP is 61.01%
HT Token Launch Trade + Market Update (300%+ Potential)## Here is another opportunity that the market is preparing for us. These latest opportunities will take a shorter time to develop than most of our old calls. These will develop mainly between 2-4 weeks from now, some going for 8-12 weeks maximum as the goal.
I'll be mentioning on the trade details the time frame that I believe it is necessary for the trade to take off. As for the targets, use them as reference and collect your profits when we start to move up. Long term targets are available on detailed long term trade calls... As for the entire market...
**We are still in the uncertainty zone. The Altcoins are more ready than ever, the market has gone on a full retrace and the charts are building up giving out many buy signals for long term trades. But the question is this: Will the action start now or wait longer?**
**It all depends on Bitcoin -4.03% and Bitcoin -4.03% is on the "uncertainty zone", it is ready to make a move but the signals are bearish while the market is ready to move up (many mixed signals with more to the bearish side).**
**If Bitcoin -4.03% starts to move up, this can boost the whole market and a trend change can start. But if Bitcoin -4.03% drops, it can take another while.**
**Whichever scenario unfolds, we have consolidated long enough. A drop for Bitcoin -4.03% should be fast, if it happens, we are already close to the bottom and there isn't much run left for down, even if it hits again, it will be fast and we can try another run.**
**The market has been bearish for a while now... the time to buy again has come! So feel free to load up on all of your favorite altcoins, even Bitcoin -4.03% , using always a very tight stop loss in this case. For long term, just buy and hold, because the prices are pretty nice long term.**
___
> Introduction
> HT (Huobi Token(www.huobi.br.com is a blockchain-powered loyalty point system. It is the only token that Huobi officially launched. HT supports Huobi Global business and all products, such as VIP discount, HT exclusive events, trading against popular coins and "let your voice be heard".
**Issue Time** 2018-1-24
*Total Amount* 500,000,000
*Circulation* 300,000,000+
### Official Website (www.huobi.br.com)
#### Block Explorer (etherscan.io)
____
#### Getting back into the money... Here is another quick trade, (www.huobi.br.com), with very low risk and high rewards as well.
> (www.huobi.br.com) bounced twice from oversold line on the RSI daily time frame.
TRADE INSTRUCTIONS
Upcoming event:
Looking solid and building up. If the market moves positive, it will be a good great to be holding this and many other of the active and highly volatile altcoins, this can turn into nice profits shortly.
(www.huobi.br.com)
steemitimages.com
**Buy zone 2.86 - 3.1**
(1) 4.2
(2) 4.8
(3) 5.6
(4) 6
(5) 6.4
(6) 7
(7) 7.7
Stop loss: 2.83.2
Time frame: 2-5 weeks.
Note: The "time frame" reflects the time I believe this trade will take for it to start moving positive. This is for reference only and can change according to market conditions.
Enjoy the trade...
Official Website for buying (www.huobi.br.com)
Link Tradingview
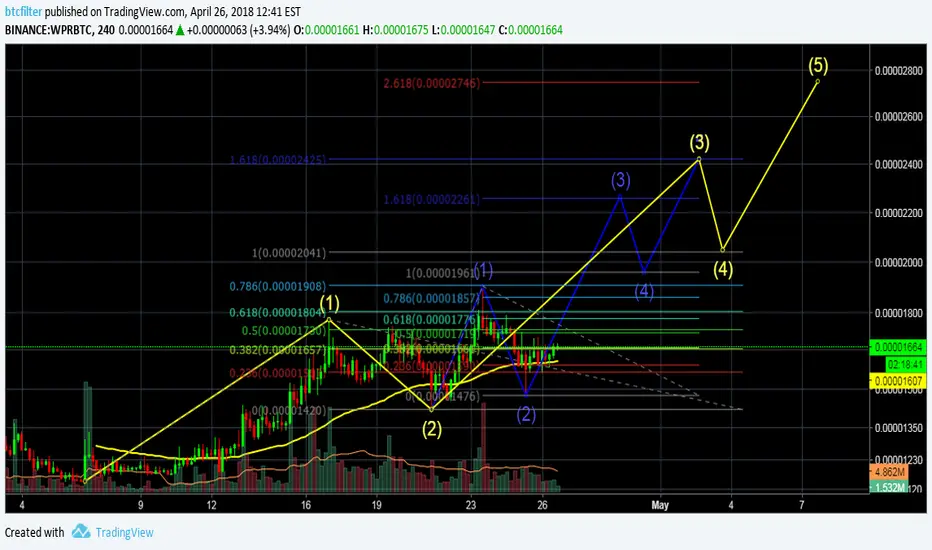
WePower (WPR) bullish on EW & EMAWPR on the 3rd EW giving bullish signs
WPR - buy range below 1700 sats
At the time of publishing,
EMA(8,13,21,34,55)
5m - Bullish
15m - Bullish
30m - Bullish
1H - Turning Bullish
4H - Neutral
1D - Bullish
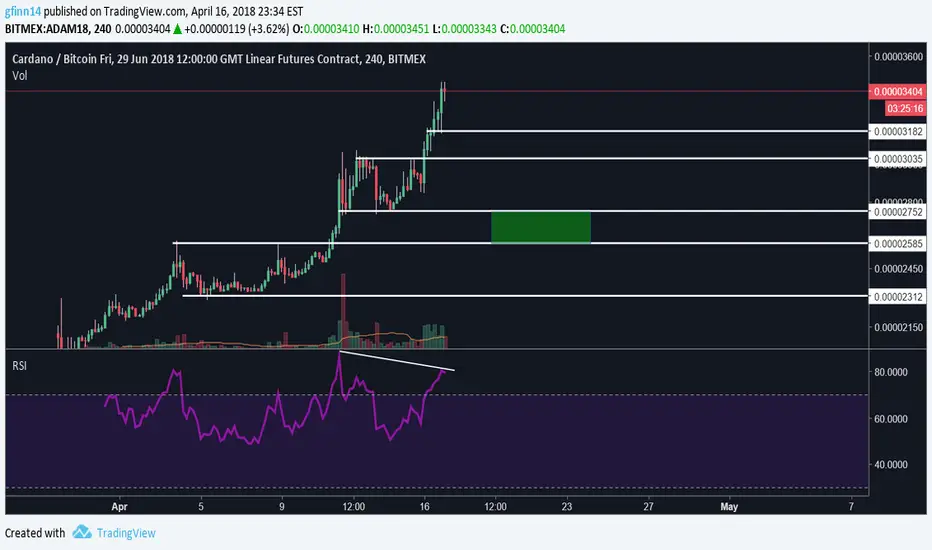
ADA Downtrend to Resume?ADA appears to be breaking out its downtrend, approaching new highs on the daily chart. However, this is likely due to the upcoming Huobi exchange listing to take place on April 17th at 14:30 UTC. In the short-term ADA may run up, but it looks prime for a retrace back down to the 2500-2700 sat area. A leveraged short could be placed on this trade with an entry at 3400-3500 sats and an exit around that 2500-2700 area.
From a indicator standpoint, there is a bearish divergence on the daily and 4 hour chart signaling a potential retrace. Additionally, the TD Sequential is painting a 13 on the 4 hour chart as well as a 9 on the daily chart.
Should we see ADA retrace, it will be crucial for ADA to hold this support level as its next support range is much, much lower (sub 1000 sat range).
$ICX breaks local resistance at 0.00032400$ICX breaks local resistance at 0.00032400 with decent volume, showing a sign of strength. Since most coins on Binance are still pumping, we may see further advance.
Optimal entry for bulls: 0.00031420
Optimal exit for bears: 0.00040910

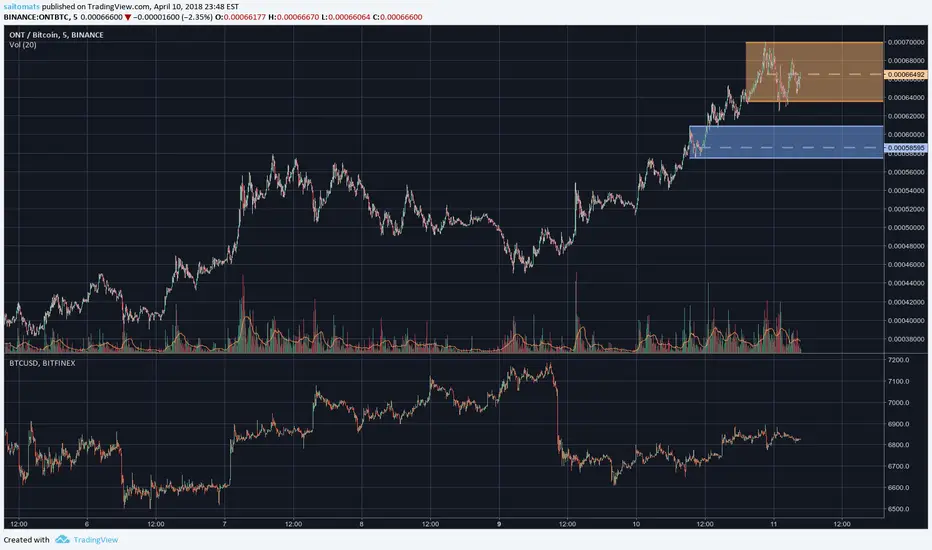
$ONT reaches psychological resistance at 0.00070000$ONT pumps to a record high of 0.00069970 on Binance, which is 20% higher than previous resistance at 0.00057900. Looking forward to continuation of upside move after some profit-taking activity here.
Optimal entry for bulls: 0.00058595
Optimal exit for bears: 0.00066492
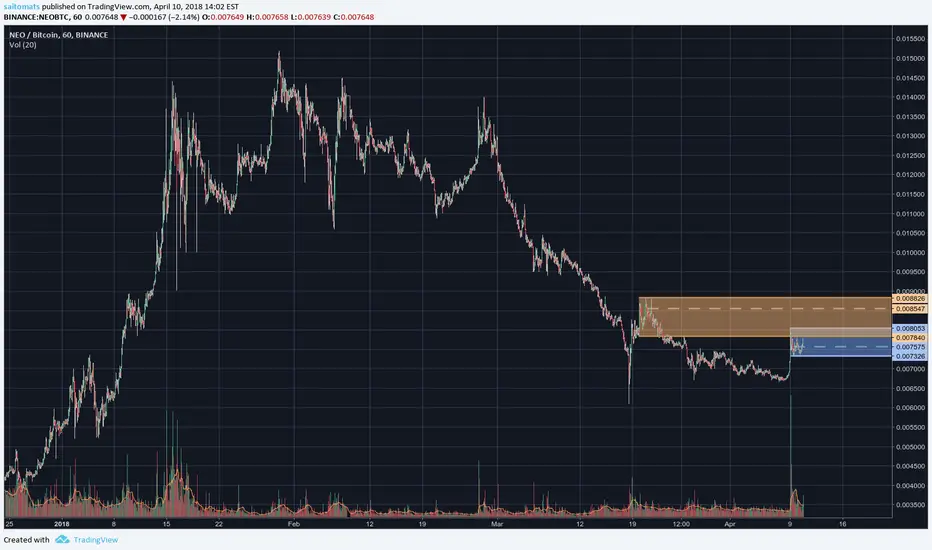
$NEO defends the bottom$NEO defends the local bottom at 0.00732600, hinting at further advance.
Optimal entry for bulls: 0.00757500
Optimal exit for bears: 0.00854700
$TRX rises in sync with $XVG $TRX correlation with $XVG shows again in micro-pump to 558.
Viewed out of context, this looks like a bullish reversal. However, I personally would be wary of entry, since the pump was the result of correlation, not self-movement.
Optimal entry for bulls: 460
Optimal exit for bears: 530

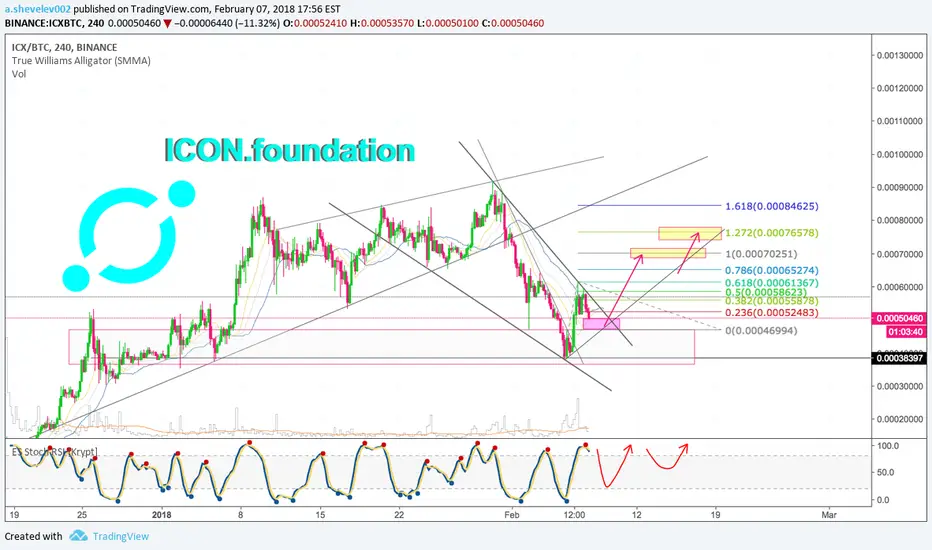
Icon [ICXBTC] Mid-term tradePrice near local demand area.
Buy in pink box: 0.00049 or lower.
Selling targets:
0.00061
0.00072
0.00076