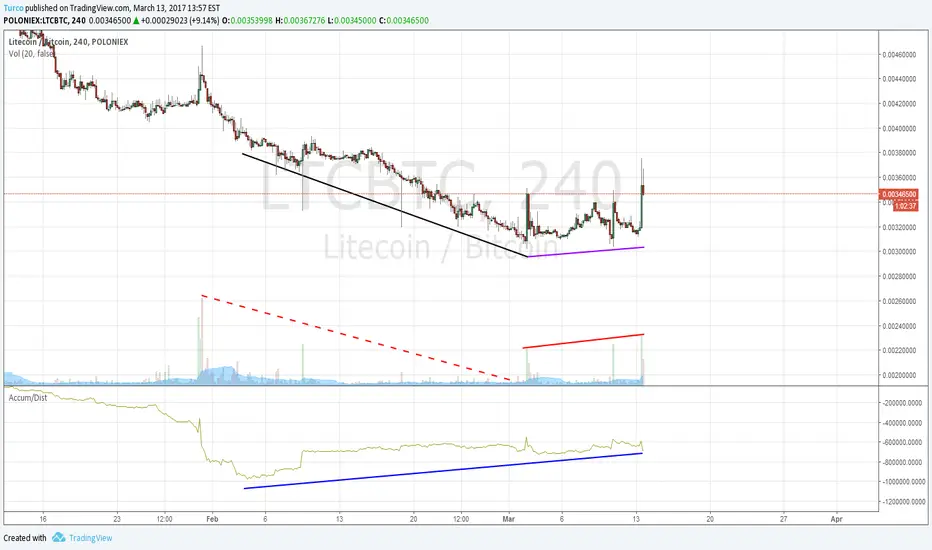
Huobi

40 days of accumulation have occurred Since the LTC/BTC ratio broke below .004, the accumulation / distribution indicator has been rising (on Poloniex). For the last 40 days, traders have been acquiring Litecoin. Today, over 1.6mm+ LTC were bought on Okcoin, which is an unusually large amount of coin. Buy volume is increasing and sell volume has decreased.
I am bullish.
Magic X-point 2 Triangles Fractal, again? OK. I think most of you know well what is my idea when you look into chart, but I must describe a little.
Rules:
1. Lines are not accurate, because we don't need precision to show general idea of this fractal
2. I use Bitfinex 1d but I'm almost sure similar patterns cn be presented on Okcoin chart
3. I'm not sure it will go down, but whole fractal is pretty interesting to focus on it
Observations:
1. Since 2015 we have clear uptrend with clear 3 sequences of strong impulse, correction, triangle, consolidation and again impulse.
2. We can draw channel - we don't need very accurate lines. Channel (white) is little broadening.
3. Tops of each 3 uptrends are very nice to see at RSI double/triple top on overbought. Time between top 1-2 and 2-3 are similar (200-230d). % of rising each new uptrend is also similar but goes down a little (around 100% to above 80% to above 60% of actual, 3rd impulse).
4. We have weaker volume each time (doesn't matter to idea of this chart but we can see it very clear).
Most important points:
5. Each time after top we saw a "triangle 1.0" (triangle in 1st version). Upper line is grey, lower BLUE. (In 2nd uptrend, I draw 2 lines because to be honest lower line is accurate but higher fits better to our chart... but it doesn't matter and not changing anything to fractal)
6. We finished 2 cycles and now we have 3rd cycle in middle and in very important point. We saw that pattern: BTC formed triangle 1.0 and went down to form longer, new triangle (triangle 2.0). New lower line of tr.2.0 is grey. We can see that in new triangle, BTC is going to lower line of channel, near EMA 100 and 200 and we have consolidation with good place to buy and start of new cycle.
7. What is point X? We can see that X is place where triangle 1.0 have 3rd touch of higher line and have bearish continuation. BTC is going down and forming new triangle 2.0.
OK. Do you see now? Now we are in point X in 3rd cycle.
Very important moment. IF we are not going to move much higher soon, BTC will probably go down from actual triangle and will form triangle 2.0 with possible low around lower line of white channel, near EMA 100 and near ending of triangle 2.0. It would be 3rd time we copied that "pattern" or "fractal" whatever you want to call it. I'm not saying we will go down for sure but if we will go down from actual triangle we probably will copy pattern from early 2015 and mid 2016. But you know fractals are fractals: can't repeat forever. So even if we will form tringle 2.0 with X-key point now, I don't know if we'll copy buy are by lower line of channel and ending of new triangle.
This is all very interesting and I'm dying to see what will happen. :)
Thanks for reading, sorry for my engrish wrr:-)

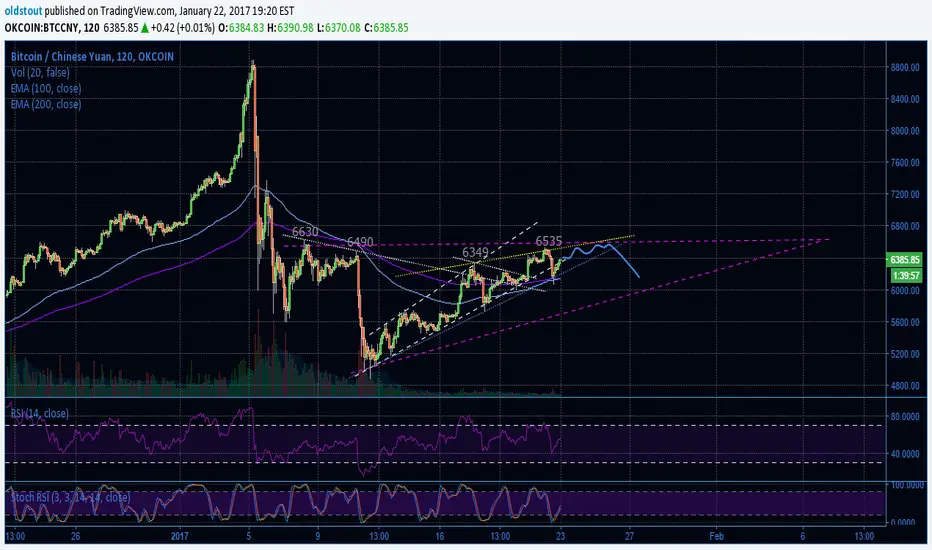
Rising wedge, then down and ascending triangle?All details at chart. I have an idea about unregular rising wedge with end at 6500-6600cny. Bearish ending ofc. After that - forming 2nd point of ascending triangle's lower line.
PL explanation: forum.bitcoin.pl
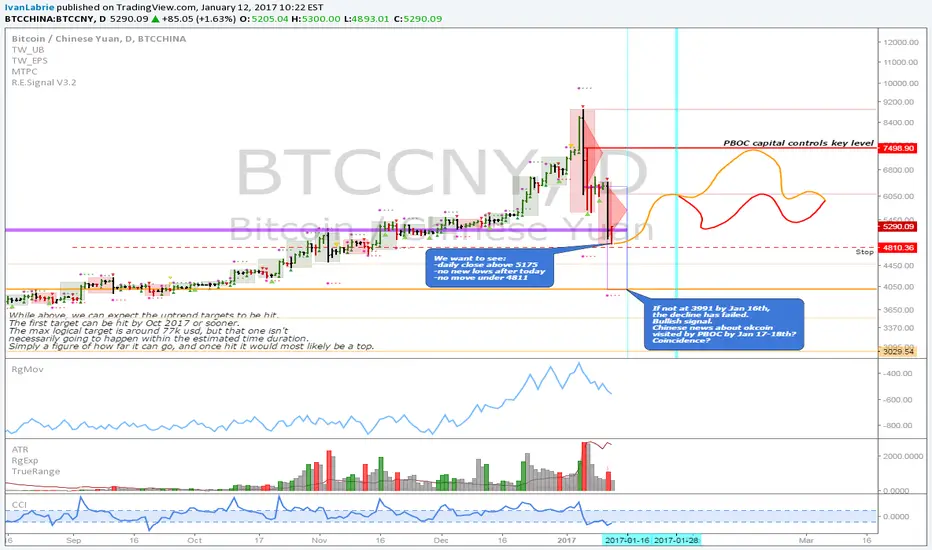
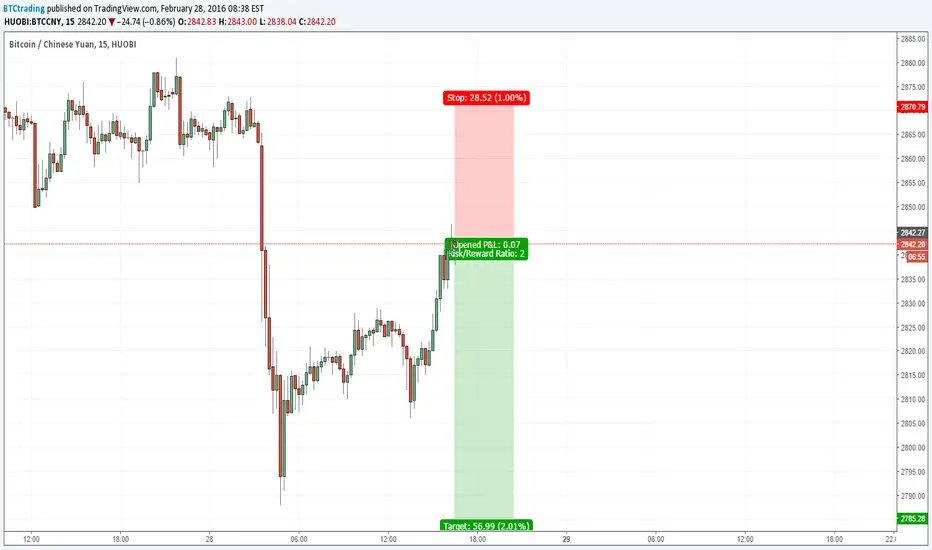
BTCCNY: Daily updateThis is what we're looking at here. We're already in a full position, so, we're limited to use leverage to add trades here. We took a long, currently in profit, and we're aiming to book profits and reduce our long term position against resistance higher.
We'd like to see the following happen next:
No new lows after today.
Daily close above 5175.
Price not hitting going under 4811, and not hitting 3991 by the 16th (if #1 and #2 happen...naturally, this won't occur)
Price return to 6300 give or take, within a few days, and then go up to test the PBOC key level.
After this happens, we'll need to see how price action evolves, in which case, I'd favor booking profits from our longs, except for the core long term position of 15-30%. In my case, I aim to hold 20/20%, in ETH and BTC, and not close these until we achieve the long term targets described in my other charts.
Good luck to us all.
Cheers,
Ivan Labrie.
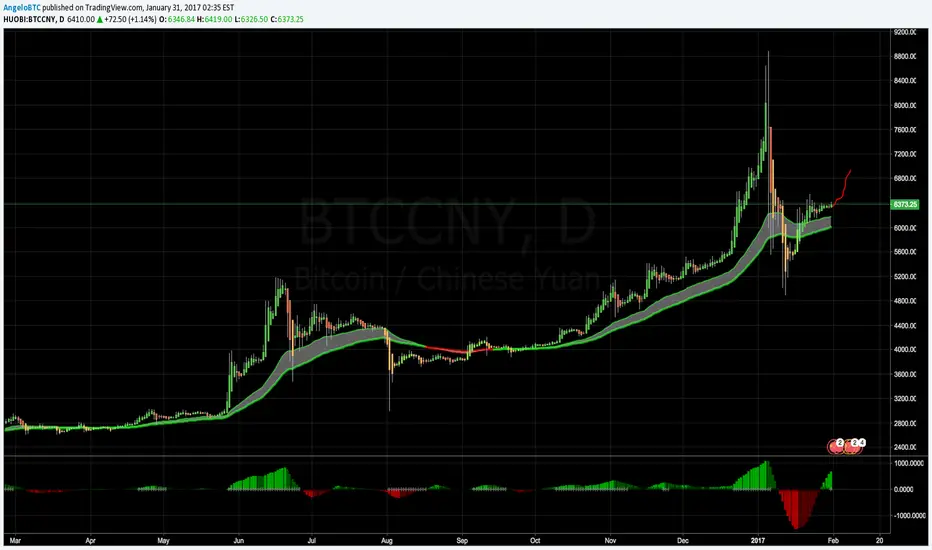
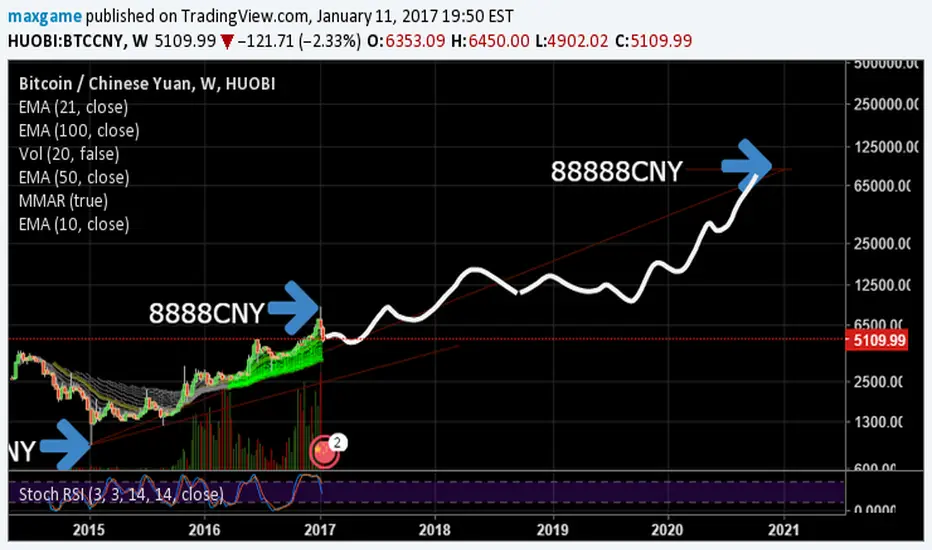
China and their love of 8'sThe number 8 has always been of great significance for China, and for that reason, I believe we may see values as large as 88888CNY, in the not so distant future.
The manipulation that continuously occurs. has allowed consecutive 8's, to become either a final flash of support or resistance. A milestone, followed by a swift return to the median. Thus far, both local lows and highs respectively.
Now, once we factor in halving, a parabolic move of this nature does not seem so far-fetched.
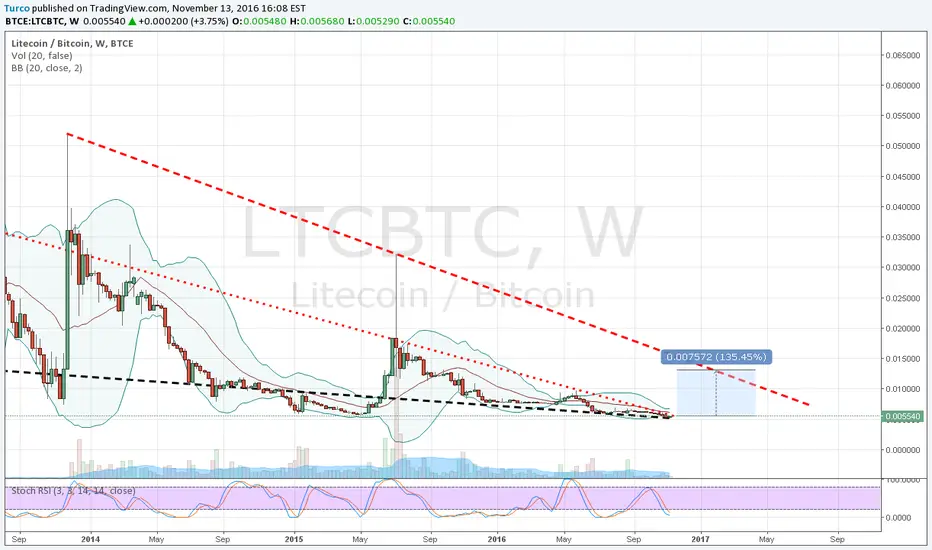
Pay attention to LTC/BTC ratioWe are seeing a bit of bullish momentum in LTC today. Right now the weekly StochRSI is at the floor, the weekly BBs are tight, and price is coiled nicely at the tip of a triangle. Combine this with a Supermoon, and we could have a big move in store (If you believe in that kind stuff).
Since I am inherently bullish by nature, I am long. In any case, regardless of what happens...I would pay attention to LTC right now. Good luck!
BTC WEEKLY CHART: "The Panic Zone" THEY'RE BAAAACK!Actually "THEY" never left. The volume of Chinese Yuan moving into Bitcoin is off the charts. It's ten to fifteen times larger than the previous Yuan devaluation I noted with the May 23 "Chinese Insiders" chart tag. The current round of volume and valuation have not been completely reflected in the BTC/USD chart. The US investors are still asleep. There is huge upside pressure on the BTC/USD price.
Here's what's going on. The Yuan is about to be devalued again. The Chinese government likes to pin the Yuan value to the USD. The USD has been rising against other currencies because of a perceived safe haven from problems with other currencies. My opinion is this perception is ill placed but that is not the topic of this discussion. The reality of the manipulated connection between the Yuan and the USD is that this makes Chinese manufactured goods too expensive and the Chinese government is about to take action to correct this problem in a big way. We have already seen China dump massive US debt. They did this just prior to the previous devaluations too.
Hang on to your hats. We're in for a ride!

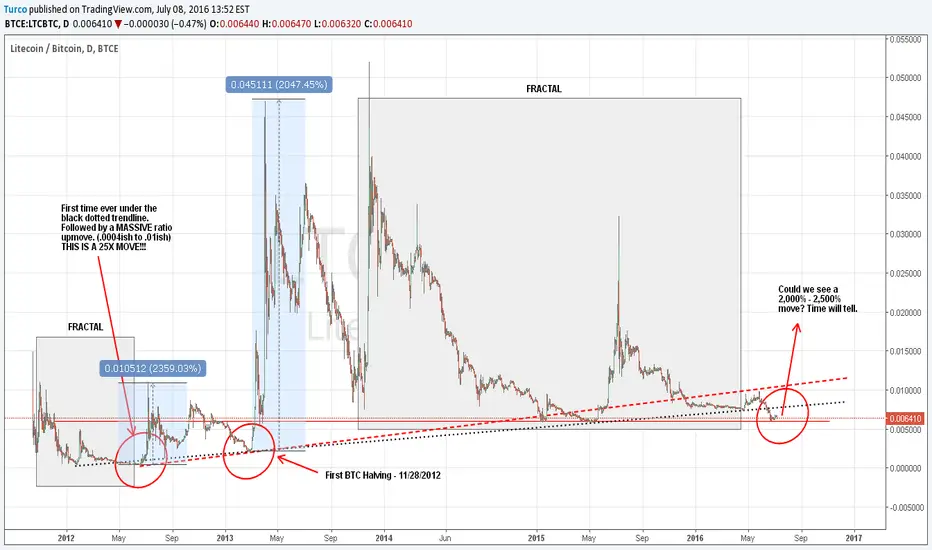
BTC a little fractal?Details at chart. A little similar chart fragments, might be a fractal pattern here...

Hope and DreamsLTCBTC ratio has taken quite a beating over the last few weeks. However, with a little bit of patience we may be in for a bullish surprise.
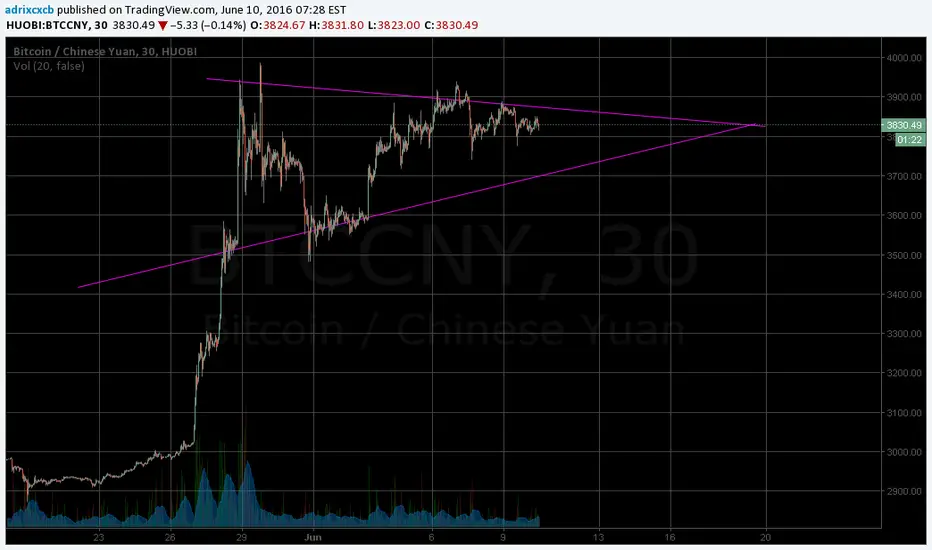
Out of new triangle soon? Here's the target inv HS out :)All details at chart. Simple and clear, just trade.
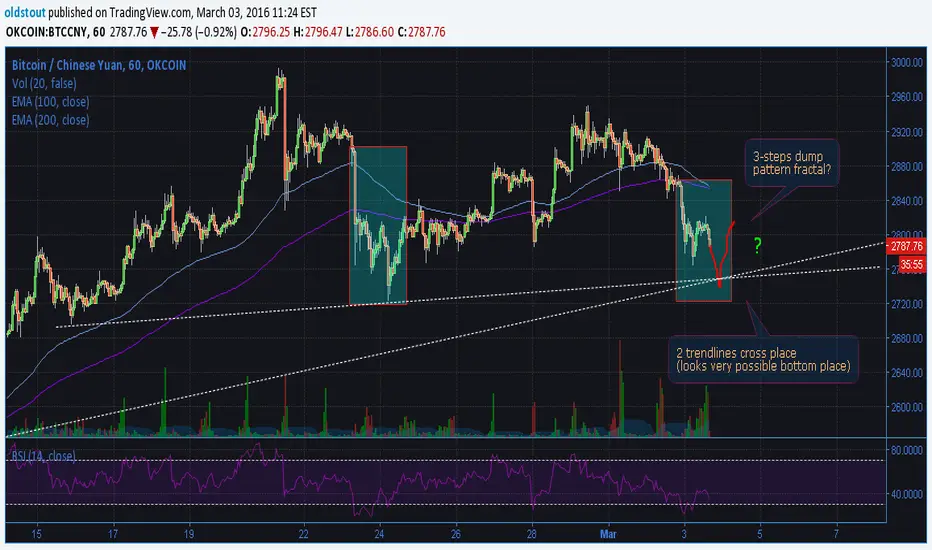
3-steps dump fractal + 2 trendlines. Voodoo?Details at chart...
If this pattern will repeat itself... ...this chart can be interesting one.
Good luck!
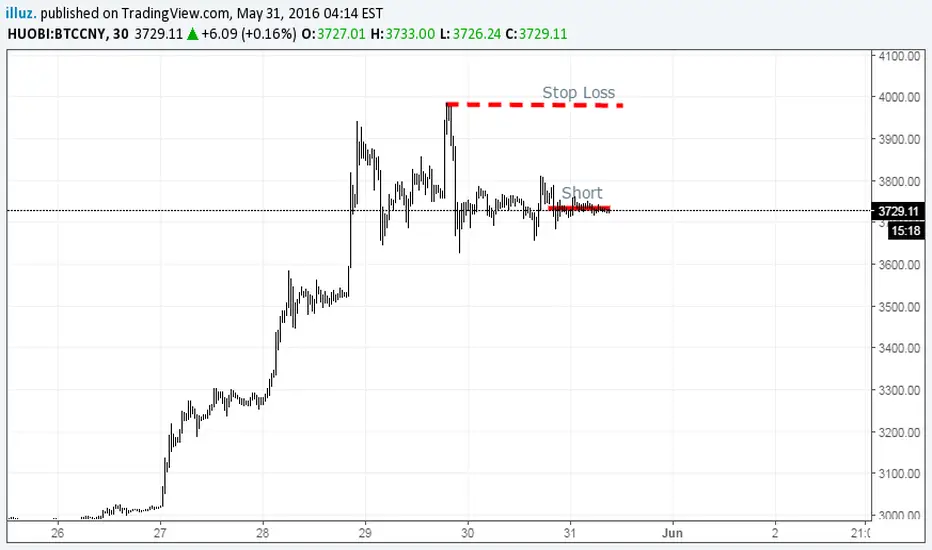
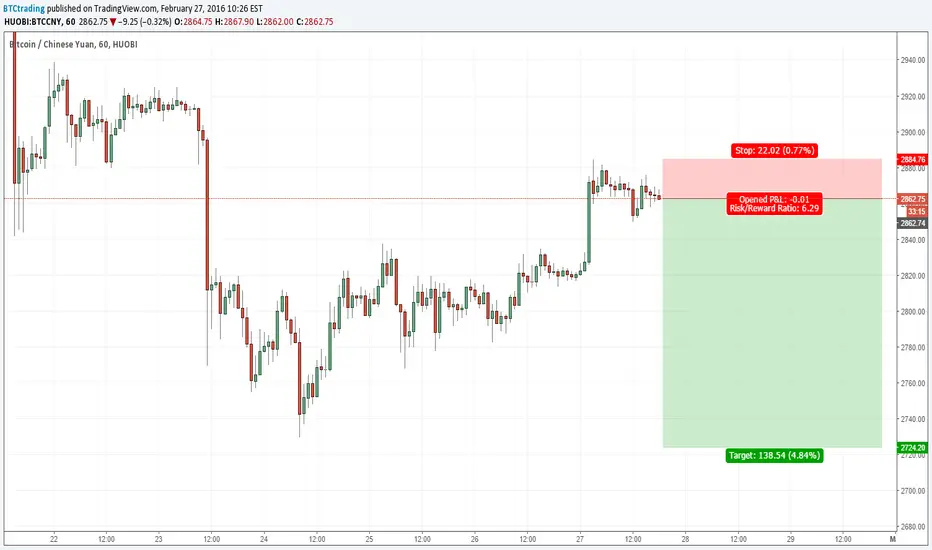
BTCCNY shortBTCCNY - short, trade 2, feb 27.
Stops: (1st - 2884,76; 2nd - 2924,20)
TPs: (1st - 2809; 2nd - 2766; 3rd - 2726)
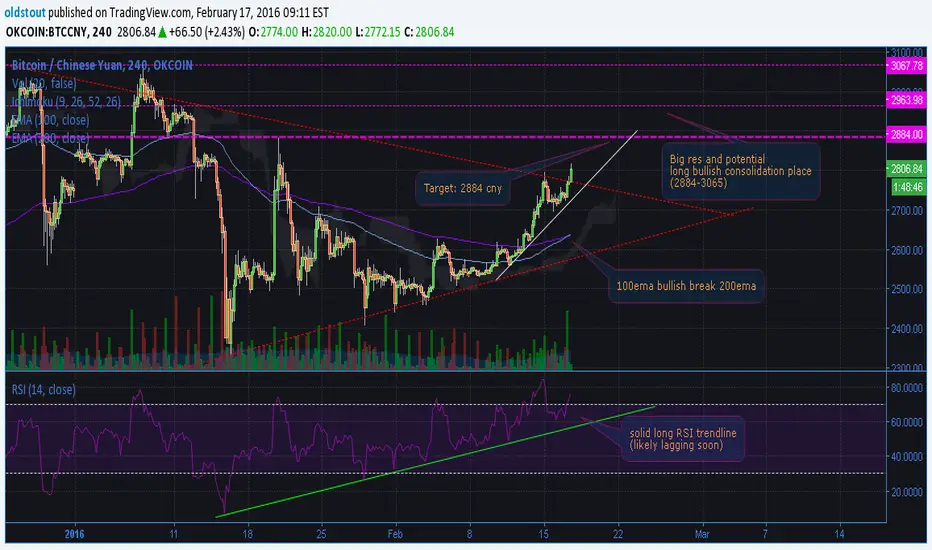
BTC target: 2884 cnyDetails at chart. Target is last high.
Above 2884 cny we see pretty tight potential consolidation place.
Staying above 2884 cny for longer than few days is very bullish for me (but potential sideway with chops).
2800cny should establish as a new floor if trend is really bullish.
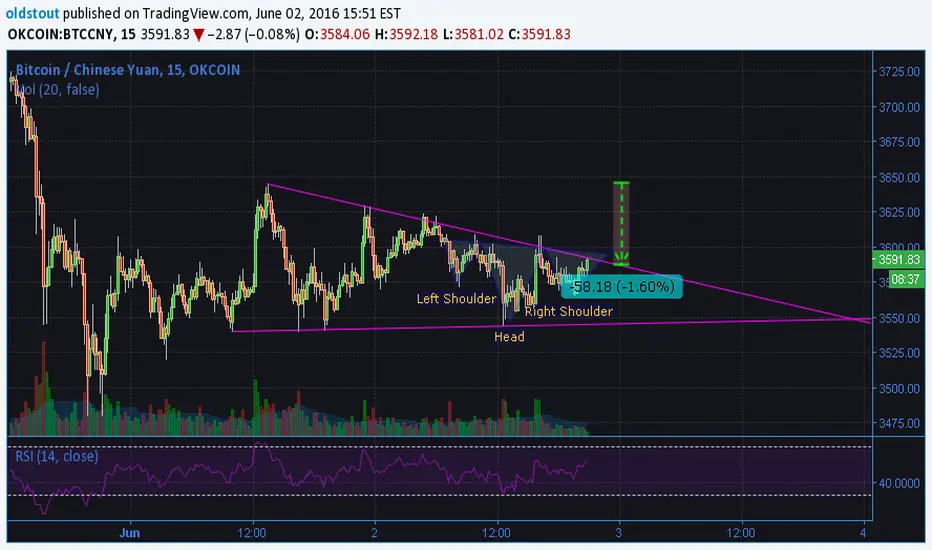
Another classic HS ? :-)Details at chart. Right shoulder and head are pretty similar.
Important moment probably incoming - test of trendline.
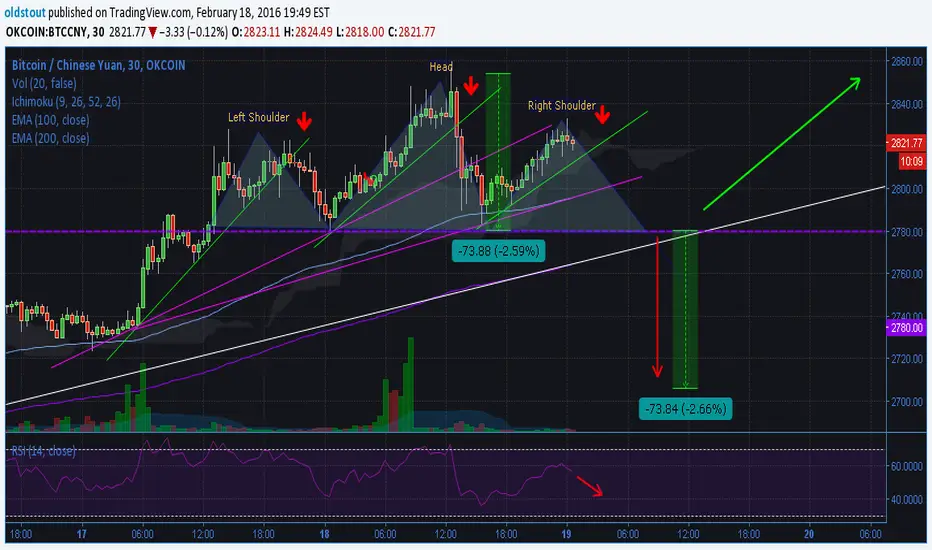
Out of HS and down? shortterm bear chartAll details at chart.
Not shorting this but sold.
BTW. Cannot publish 5m chart but 5m chart is better to see this obv HS pattern.

Bitcoin Next Move Outlook for the second half of FebruaryOn February 7 we started to break indecision which lasted from the end of January. Now its finally confirmed that Bitcoin price will rise, at least for some time from now. RSI is still low around 60 on higher timeframes above H4. Uptrend is confirmed by quick breaking resistance levels which are subsequently confirmed from the upper side and price climbs by this steps up and up.
Last week we also see rallye on different altcoinf such as ETH, MAID, XMR, and many others. However it soon turn out that all this false hope will end in tears. ETH will never make higher high and my prediction is that by the end of February it will decline back to price where it was and in the future ETH price will inevitably comes to almost zero....
CNY is depreciating and thus bitcoin price will go up.
However there exists some tiny possibility that price rose only to decline even more - now on H4 and H2 and H1 we can see divergence between price and RSI however taking into account all other fundamentals and TA this very probably prove to be wrong what on the other hand only even more confirm the uptrend and make uptrend even stronger and thus the final price which we are heading to will be even higher.
My current prediction is that we are heading to $450 level or above. Perhaps we can just see new price canal which is established between $360 and $460 with occasional price flashes more up or down depending on price pumps which occur on different exchanges.
Very probably we reach $460 or CNY 3000 soon. I think now we are making another CNY 500 up from previous decline CNY 500 (which made a triangle which high was CNY 500).
I am very bullish on Bitcoin long term and my short term predictions turned bullish as well. Unfortunately I sold most of my Bitcoins and now I must buy them back again so I am byuing on decline and selling on tops.
happy trading
Let me know what do you think in comments below :) How much profitable trades did you make?

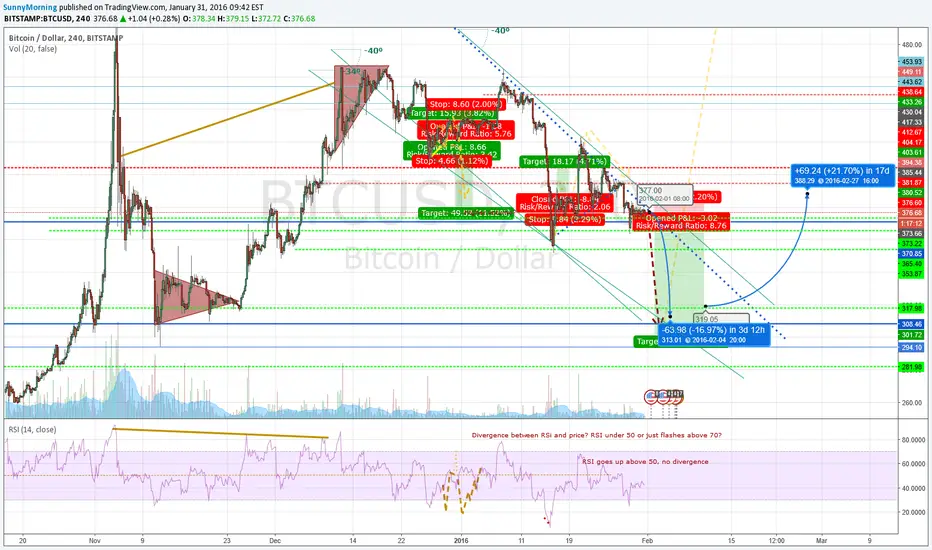
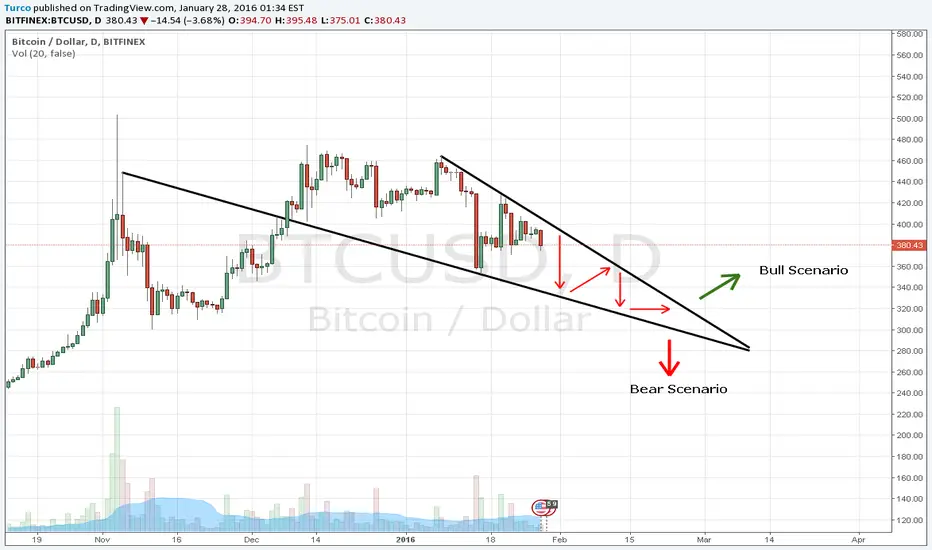
Possible Scenario - Falling WedgeThis is starting to look like one massive falling wedge, for which Bitcoin is famous for. Although it is a bullish pattern, the last one we found ourselves in during the summer of 2015, failed miserably (with a Bitfinex stop run below $200). This time around I tend to be an optimist, expecting a great buying opportunity between $300 - $320. Of course I assume there will be a significant amount of chop and and squeezing within this wedge.
Good luck!
Bitcoin Next Move Outlook for week commencing february 1stHello guys whats up? Another analysis is here for you. Look at that nice green and red candles making new lows day by day. They are so strong and sharp. When does it end? Next week or a week after? When comes that day when we fall at the very bottom and price turns north? Desperate time desperate measures. Despite we all love that shiny Bitcoin we must sell it. Yes sell it all which almost bring tears to my eyes but it is only because we want to buy more bitcoins at the bottom from weak hands.
Now Bitcoin again touched downtrend line and it will decline sharply to the bottom line. First and weak resistance is at $370 stronger resistance is at $317 which will very probably be at the very bottom and offers reasonable point for buying bitcoin. However on some exchanges price could drop lower, maybe on Bitstamp or Bitfinex we can go as low as $299. Maximum possible decline during this decline could be $282 but it might b just an unexpected candle shadow on OKcoin or Bitstamp. From $320 price will recover and goes back to $370. However its not clear whether price decline more. Once it breaks downtrend line we can expect strong uptrend which is aimed at $600 with resistance at $400 and $500. Dont forget to use leverage it can multiply your profits but be carefull. Kids dont try leverage it home but only under adult supervision. Thumbs up !! :) and let me know what do you think in comments below :) How much profitable trades did you make?