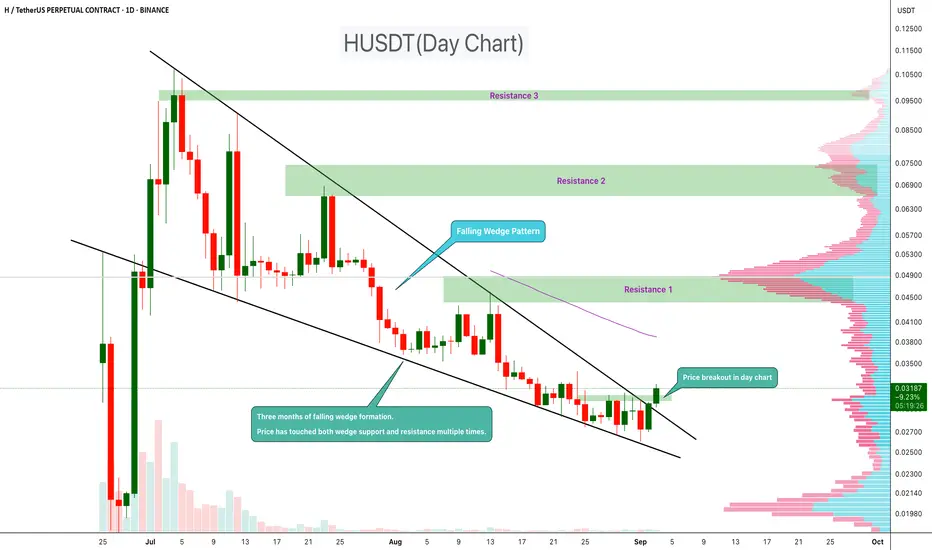
HUSDT Reversal Signal – Wedge Pattern BreaksHUSDT has been forming a falling wedge pattern over the past three months. During this period, the price has tested both the wedge support and resistance multiple times, confirming the structure.
Now, a breakout has appeared on the daily chart, suggesting that bullish momentum may be building. Falling wedges are typically seen as reversal patterns, often leading to upside continuation once the breakout is confirmed.
Resistance 1:$0.045
Resistance 2:$0.066
Resistance 2:$0.095
cheers
Hexa
Husd
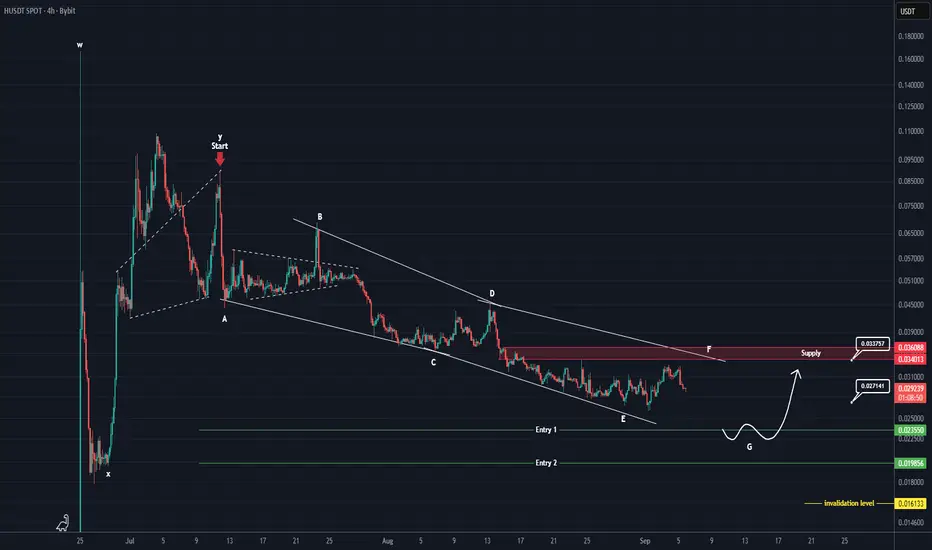
HUSDT Analysis (4H)This coin, after completing a bullish wave in the form of a WXY, has entered a corrective phase from the point where we placed the red arrow on the chart.
This phase appears to be a Diametric, and we are currently in wave F of this Diametric.
It is expected that wave G will soon be completed, pushing the price toward the green lines, which mark our entry zone for a buy/long position.
In the green zone, we are looking for a buy/long position. If you are considering a sell/short position, the red-marked box is suggested.
Targets are marked on the chart.
A daily candle close below the invalidation level will invalidate this analysis.
For risk management, please don't forget stop loss and capital management
When we reach the first target, save some profit and then change the stop to entry
Comment if you have any questions
Thank You
Gold Proven Trading strategy that will help to to achieve ..... Do you want to be a profitable and successful gold trader?
Know about the economic conditions in the USA.
Use Pure Price action.
Use your trading psychology.
As long you are good at a fundamental and technical chart, it will constantly develop your trading psychology.
Then use pure price action as I said in the video. if fundamental and analysis support help try to combine it \go

Bollinger bands wide open, stochastics good, third times a charmWith the recent news of the IOST integration of the husd stablecoin, it experienced a couple of strong spikes in the upward direction. Stochastics indicate a mild buy, while the bollinger bands are like a hungry snake with its mouth wide open. Will we see a breakout to seven cents?
