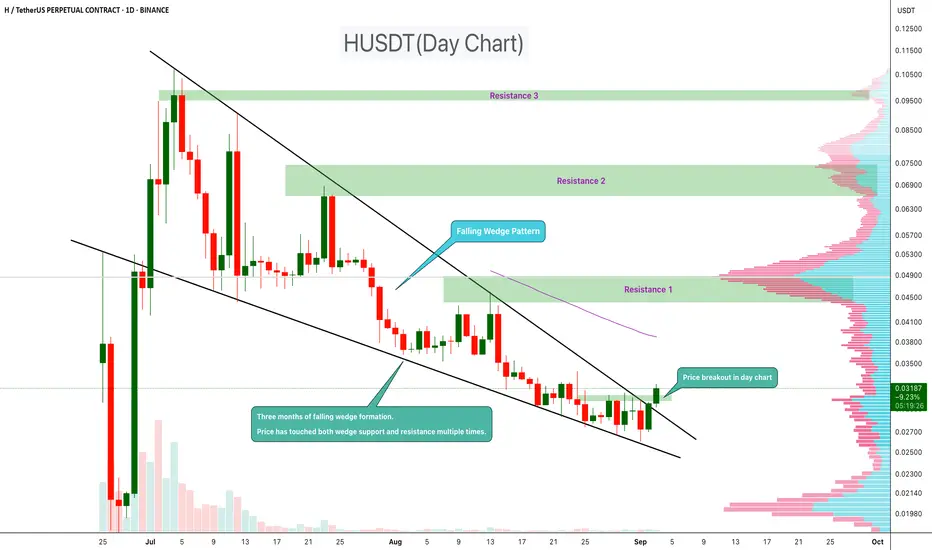
HUSDT Reversal Signal – Wedge Pattern BreaksHUSDT has been forming a falling wedge pattern over the past three months. During this period, the price has tested both the wedge support and resistance multiple times, confirming the structure.
Now, a breakout has appeared on the daily chart, suggesting that bullish momentum may be building. Falling wedges are typically seen as reversal patterns, often leading to upside continuation once the breakout is confirmed.
Resistance 1:$0.045
Resistance 2:$0.066
Resistance 2:$0.095
cheers
Hexa
HUSDT
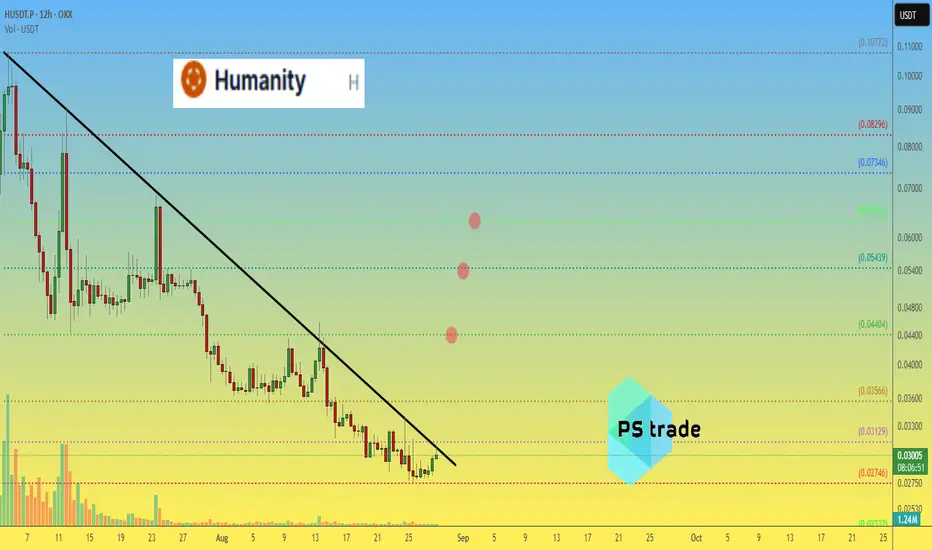
Humanity H price analysis🔥 Have you also noticed the recent "market magic"?
Random coins with ZERO news suddenly 🚀 pumping x2–x3 in just a day!
Here’s the pattern we’ve spotted 👇
▪️ Market Cap: $20–50M
▪️ Base Trading Volume: $2–5M
▪️ And then — a green rocket without any fundamentals 💥
🤔 Could #H be the next one to pump?
Or maybe it’s time for another “chosen one”?
💬 Drop your guesses in the comments — let’s analyze them together!
🧠 DYOR | This is not financial advice, just thinking out loud.
______________
◆ Follow us ❤️ for daily crypto insights & updates!
🚀 Don’t miss out on important market mov
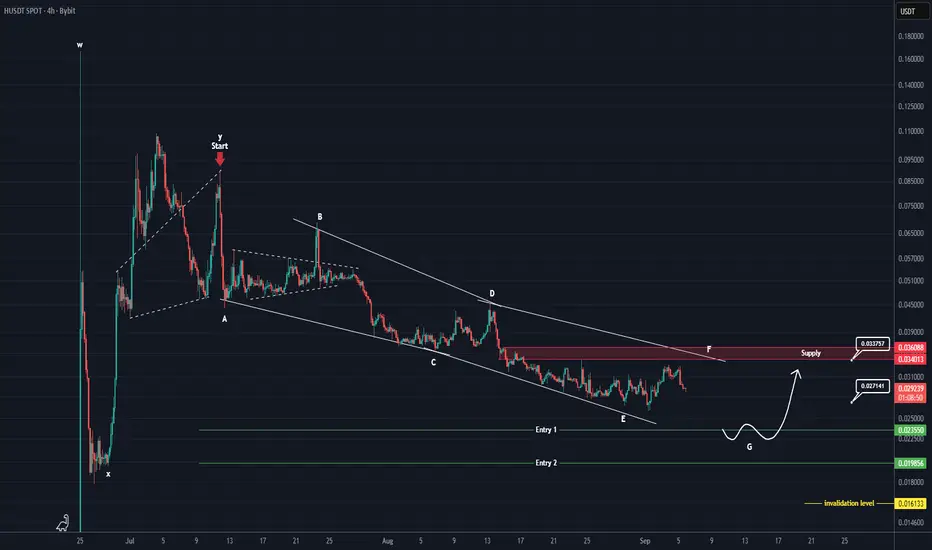
HUSDT Analysis (4H)This coin, after completing a bullish wave in the form of a WXY, has entered a corrective phase from the point where we placed the red arrow on the chart.
This phase appears to be a Diametric, and we are currently in wave F of this Diametric.
It is expected that wave G will soon be completed, pushing the price toward the green lines, which mark our entry zone for a buy/long position.
In the green zone, we are looking for a buy/long position. If you are considering a sell/short position, the red-marked box is suggested.
Targets are marked on the chart.
A daily candle close below the invalidation level will invalidate this analysis.
For risk management, please don't forget stop loss and capital management
When we reach the first target, save some profit and then change the stop to entry
Comment if you have any questions
Thank You