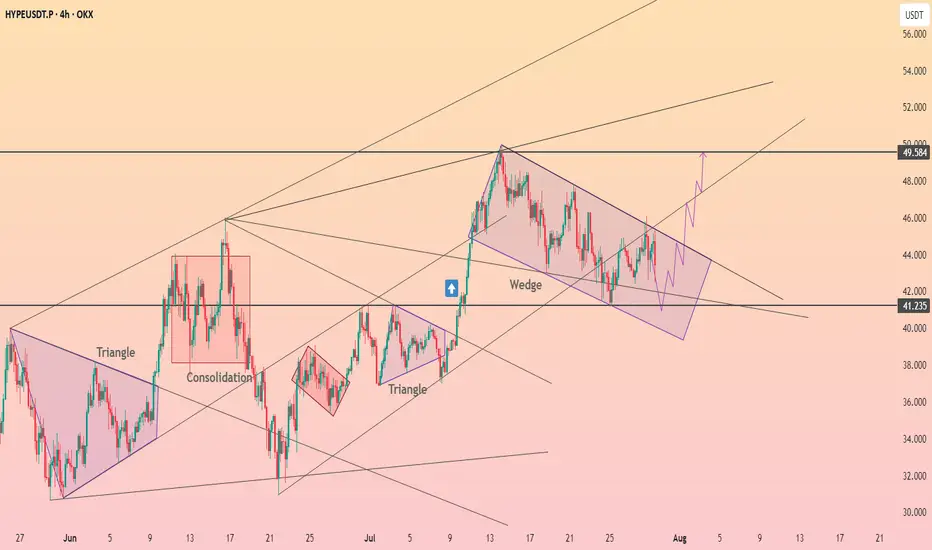
Hyperliquid reached the upper limit of the wedge ┆ HolderStat$BINANCE:HYPEUSDT is currently trading within a falling wedge after a sharp bullish move. Price is consolidating near key support around 41.2, showing signs of pressure building for a potential breakout. A clean break above the wedge resistance may open the path toward 49.5, aligning with the higher trend channel projection.
Hype
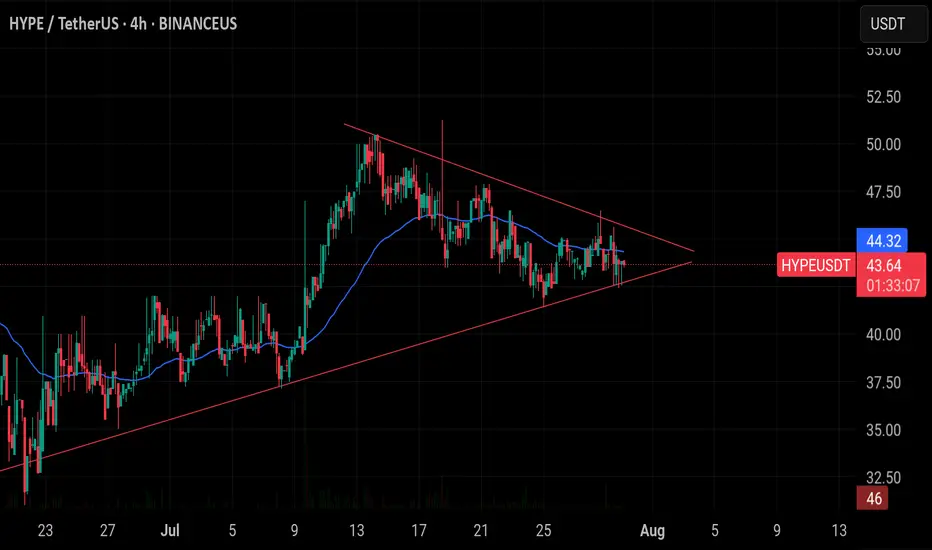
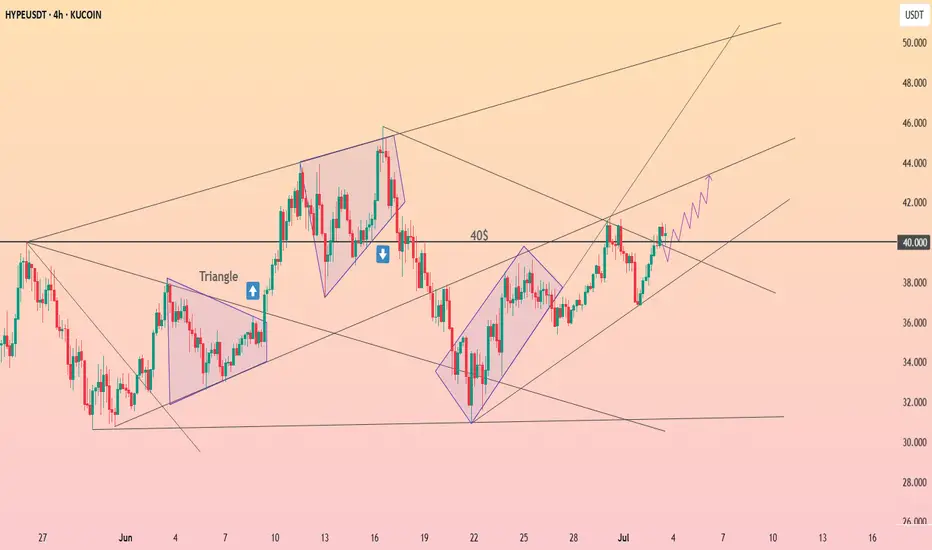
$HYPE/USDT is sitting at the edge of a triangle.$HYPE/USDT is sitting at the edge of a triangle. If it breaks above $44, it could jump to $52. But if it falls and close 4h candle below $42, the setup will fail.
HYPE Swing Long Opportunity - Altcoin Season📌 Fundamental Sentiment:
The crypto market — alongside broader risk assets — continues to gain traction. This momentum is largely fueled by rising expectations of policy shifts in the U.S., with Trump intensifying pressure on Jerome Powell and advocating for aggressive rate cuts from the Fed.
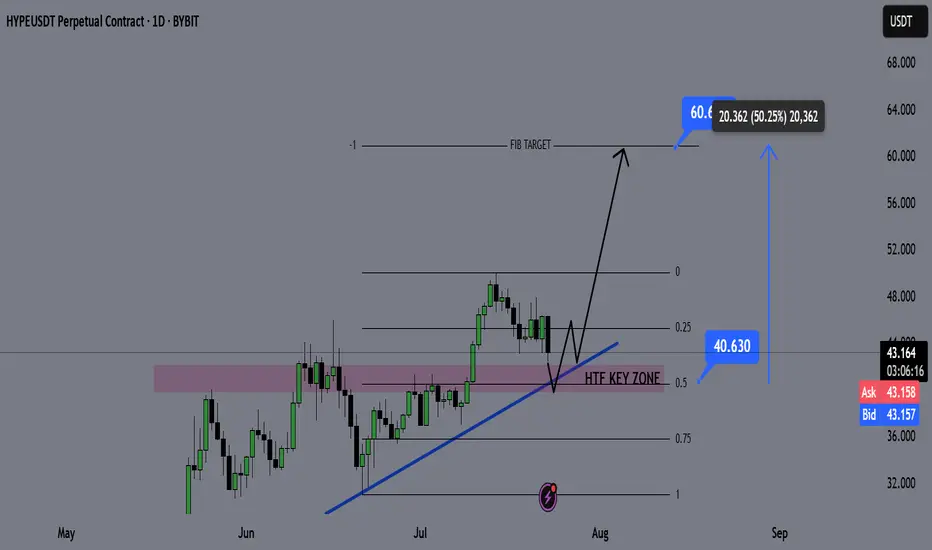
📌 Technical Analysis:
HYPE is approaching a key HTF bullish trendline, and confluences are stacking up in the same region:
✅ HTF Demand Zone
✅ Equilibrium (EQ) of the HTF bullish trend
✅ Bullish Trendline Support
These three HTF confluences overlapping at the same price zone indicate a high-probability setup for a significant bounce and a possible swing long opportunity.
📌 Gameplan:
Price hits HTF bullish trendline
HTF demand zone gets tested
EQ level tapped → discount offered to buyers
📌 LTF Confirmation Criteria:
I’ll wait for:
A 1H swing break
A strong 4H rejection candle
These will confirm momentum shift. If confirmed, I’ll enter a swing long.
🎯 Target: $60
💰 Potential gain: ~+50%
❗ Stop-loss: Below the swing low that triggers the LTF confirmation
—
🔔 Follow for daily setups and weekly macro recaps
💬 Drop your chart or questions below!
Hyperliquid is retesting the $44 level ┆ HolderStatKUCOIN:HYPEUSDT has flipped $0.074 into support. Holding this level could trigger a move to $0.088. Structure favors bulls.

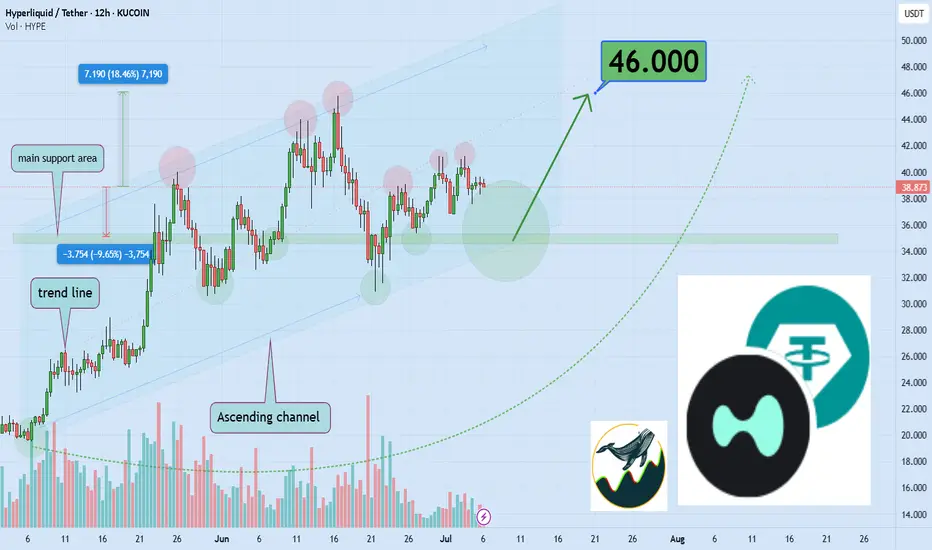
Watch Hyperliquid Surge 18% to $46 Key Resistance LevelHello,✌
let’s dive into a full analysis of the upcoming price potential for Hyperliquid 🔍📈.
KUCOIN:HYPEUSDT is trading within a reliable daily ascending channel and is currently near its lower boundary, where a strong daily support zone has formed. This setup suggests a potential upside of at least 18%, with a target around $46 , which aligns closely with a key trendline. 📈
✨ Need a little love!
We pour love into every post your support keeps us inspired! 💛 Don’t be shy, we’d love to hear from you on comments. Big thanks , Mad Whale 🐋
Real party starts when hype breaks out against btc pair Any meaningful crypto looking to enter top 10 territory will understandably be under the scope of some major btc whales . Since crypto assets for size buyers are carefully paired up against btc . The hype/btc chart should be the one that would catapult us into price discovery once we break agints btc. I anticipate large buyers to enter this trade

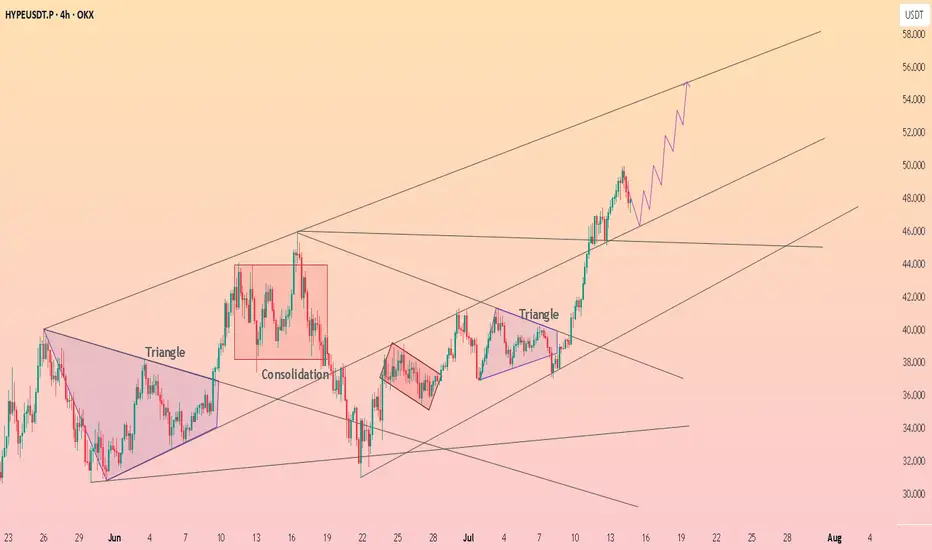
HolderStat┆HYPEUSD has consolidated above the trend line$OKX:HYPEUSDT surged after a breakout from a well-formed triangle and a bullish retest of prior resistance. The chart shows a textbook ascending channel with the price climbing from $38 toward the $56 upper range. If momentum remains, a breakout beyond the top boundary is likely.
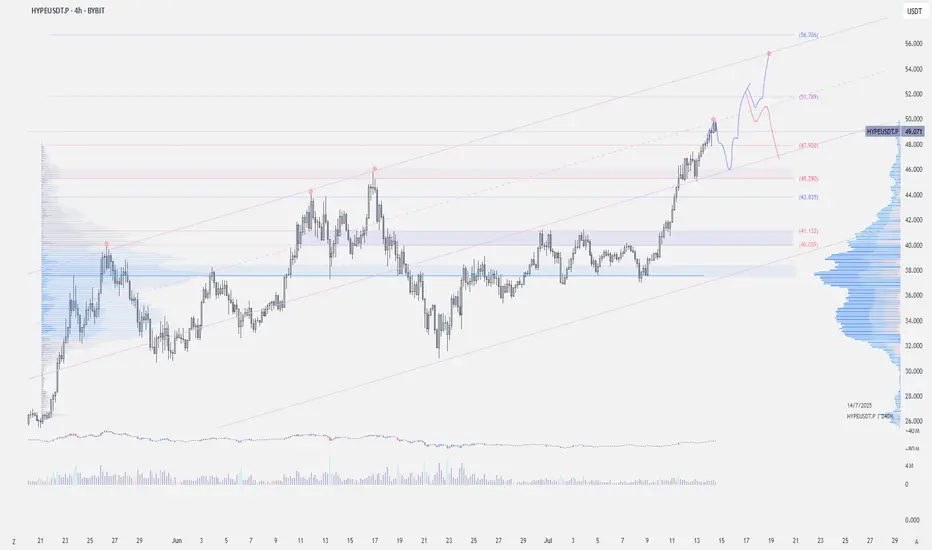
$HYPE - Short term OutlookKUCOIN:HYPEUSDT | 4h
Price just tapped the channel on its first test — expecting a minor pullback to the $47.5–$45.3 area (short term).
Key support to hold now is $45–43 for potential continuation toward $57–60 zone.
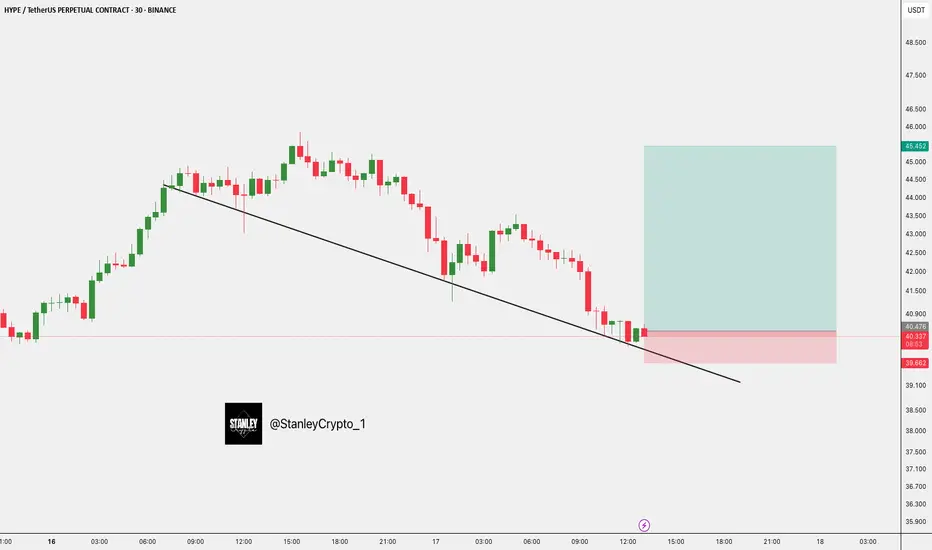
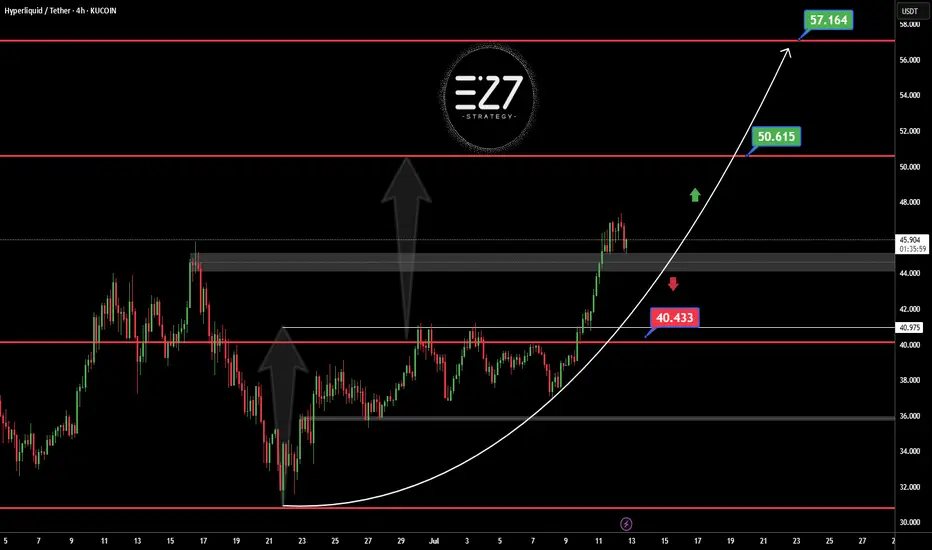
HYPEUSDT KUCOIN:HYPEUSDT 4H Analysis Price has broken out above the 44.5 support zone and is holding strong 🚀. As long as this level holds, targets are set at 50.615 and 57.164 📈. If 44.5 breaks down, next support is seen at 40.433 🔻.
Key Levels:
✅ Support: 44.5
🟩 Targets: 50.615 → 57.164
🔴 Next support if breakdown: 40.433
[UPD] BTC / ETH / SOL / XRP / HYPE / SUPER / FLOKIUpdating my view on intermediate trend structures I am tracking in CRYPTOCAP:BTC , CRYPTOCAP:ETH , CRYPTOCAP:SOL , CRYPTOCAP:XRP , GETTEX:HYPE , BSE:SUPER and SEED_DONKEYDAN_MARKET_CAP:FLOKI highlighting key support and resistance zones to watch in the coming sessions
Charts featured in the video:
BTC
ETH
XRP
SOL
HYPE
SUPER
FLOKI
Thank you for your attention and I wish you successful trading decisions!
If you’d like to hear my take on any other coin you’re tracking — feel free to ask in the comments (just don’t forget to boost the idea first 😉).

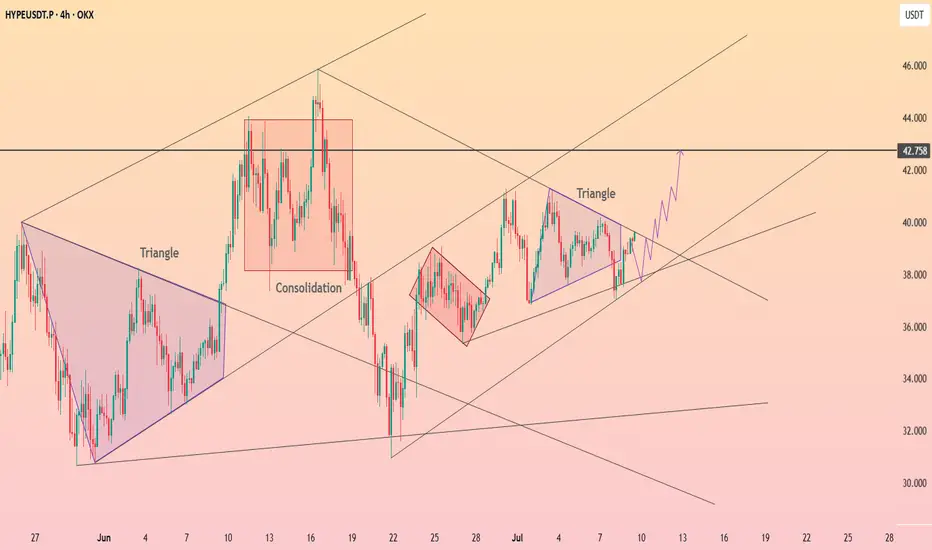
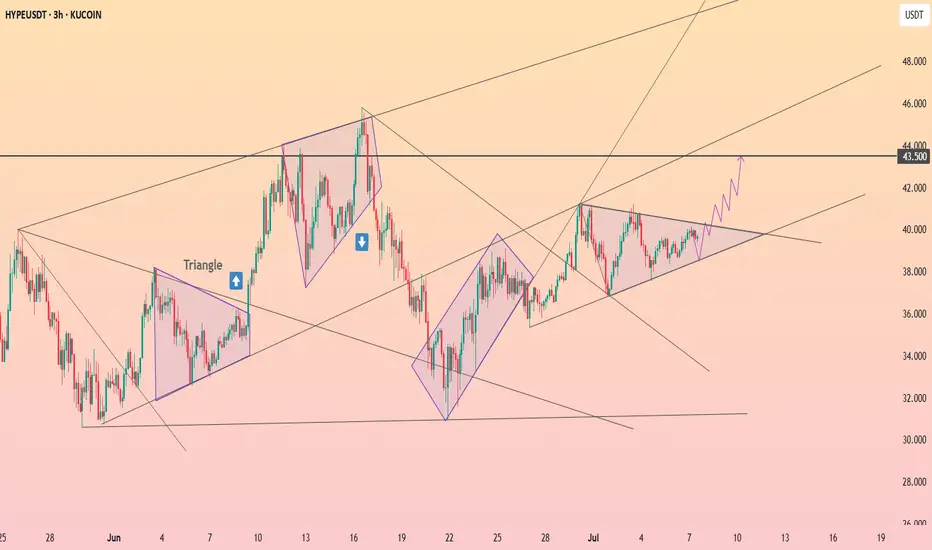
HolderStat┆HYPEUSD back to the trend line$OKX:HYPEUSDT is breaking out of a triangle formation, continuing a sequence of bullish consolidation and triangle patterns. Price is targeting the upper channel line near 42.75, with the structure supporting continued upside momentum.
BTC / ETH / SOL / XRP / HYPE: Potential Trend StructuresIn this video, I share my current daily and weekly analysis on the trend structures of BTC, ETH, SOL, XRP, and HYPE, highlighting key support and resistance zones to watch in the coming sessions.
Charts featured in the video:
BTC
ETH
SOL
XRP
HYPE
Thank you for your attention and I wish you successful trading decisions!
If you’d like to hear my take on any other coin you’re tracking feel free to ask in the comments (just don’t forget to boost the idea first 😉).

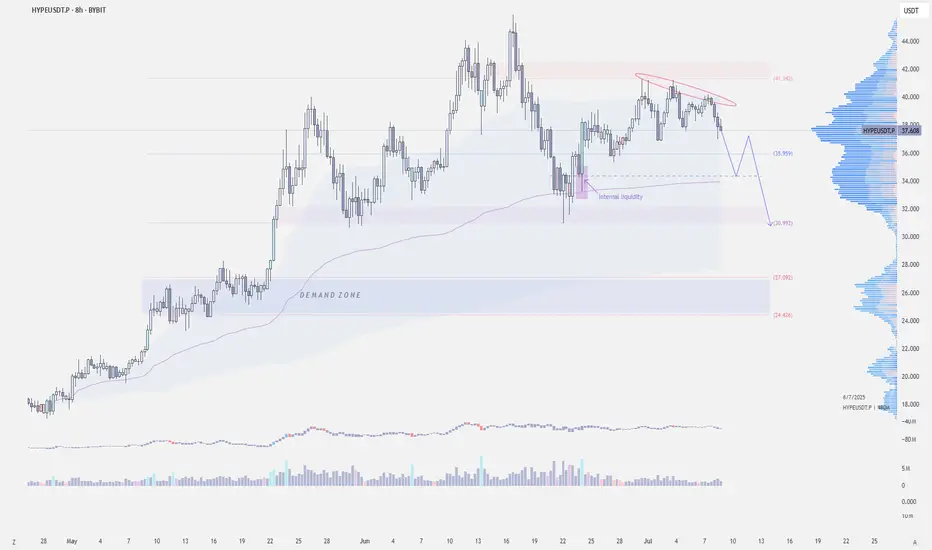
$HYPE - Short-term OutlookKUCOIN:HYPEUSDT | 8h
We're seeing a short-term distribution forming on the daily chart.
Price has now tested the supply zone around $42 three times and is struggling to break through.
There's local demand in the $34.5–$34 area, where I expect a reaction, in confluent with vwap. However, if price keeps getting rejected at $37–38, a move back to $30 is likely.
A break below $30 opens the door for a deeper drop toward $27–24, which is a higher timeframe demand zone.
HolderStat┆HYPEUSD forming the triangleKUCOIN:HYPEUSDT has entered a narrowing triangle formation with a bullish trajectory, forming higher lows from the 33 USDT base. Price is nearing resistance around 40 USDT, and if breached, the pattern projects continuation toward the 43.5 USDT level.
HolderStat┆HYPEUSD above the $40 resistanceKUCOIN:HYPEUSDT has reclaimed $40 resistance and is now trending in a rising channel. Past triangle breakouts signal that $43–$45 could be next if the current momentum continues to build.
HYPEUSDT Probably CookedToken driven by demand from trading on Hyperliquid. Crypto looks set for a few month long consolidation probably into Q4.
That loss in trading volume will reduce demand for the token and the company may be forced to sell the token to come up with large gains for its clients. Either way it's a bearish catalyst for the token which has really ran hard. Ugly head and shoulders as well as a topping pattern in an overall financial market that looks like it wants a pull back
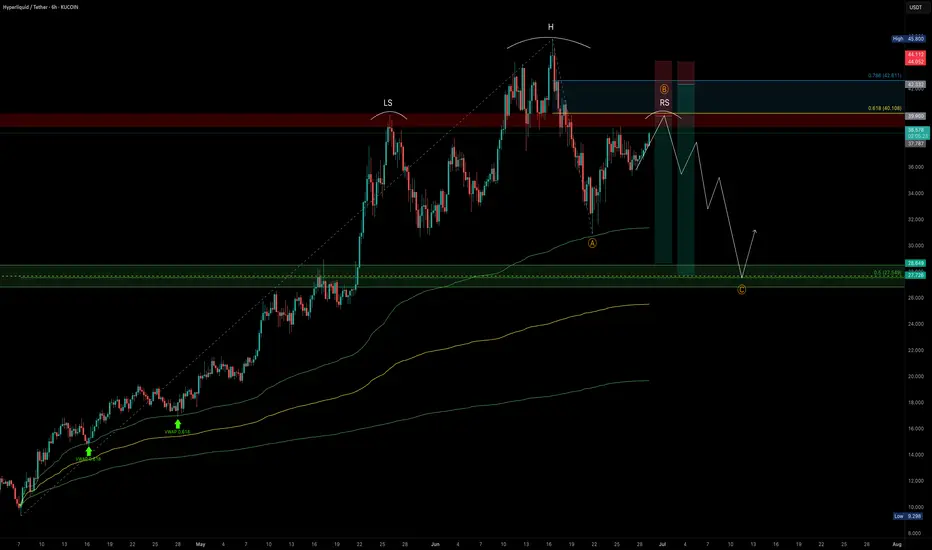
HYPE — How to Combine Fibonacci, VWAP and Market StructureAfter an explosive +392% rally in just 70 days — from $9.298 to a peak of $45.8 — HYPE has entered a consolidation range as expected. Structurally, this appears to be a 5-wave impulse now transitioning into a corrective ABC pattern. Based on current structure, we may now be forming wave B.
What’s Unfolding Now?
A potential Head & Shoulders pattern is developing, with price currently working on the right shoulder. The $40 mark stands out as a key resistance — both technically and psychologically:
0.618 Fibonacci retracement of the down move sits at $40.108
Structural resistance from prior highs
Ideal area for a short rejection
🎯 Short Setup:
Entry: Laddered short between 0.618 ($40.108) and 0.786 ($42.611)
Stop-Loss: Above $44 (after rejection adjust to entry)
Target: $28–$27 zone
R:R potential: 1:3 up to 1:9 depending on entry quality
📍 Why $28–$27 Is Key Support:
0.5 Fibonacci retracement of entire +392% rally sits at $27.549
Anchored VWAP from the rally origin ($9.298) aligns around this zone
Weekly & Monthly S/R convergence
VAH (Value Area High)
0.618 Fibonacci Speed Fan also aligns as dynamic support
Fair Value Gap (FVG) lies in this region
Weekly 21 EMA at $28.05/Weekly 21 SMA at $24.10 — both key moving averages providing layered support and trend structure
📐 Bonus Confluence Insight:
If this is indeed wave B, then projecting a 0.786/1.0 Trend-Based Fib Extension from wave A aligns well with the 0.5 fib retracement at $27.5.
📚 Educational Insight:
Stacking confluences such as Fibonacci retracements, anchored VWAPs, volume zones, EMA/SMA levels, and harmonic structures helps identify high-probability zones where smart money is likely to act. These levels become even more powerful when they align across multiple tools and timeframes. Always confirm with price action.
_________________________________
💬 If you found this helpful, drop a like and comment!
Want breakdowns of other charts? Leave your requests below.
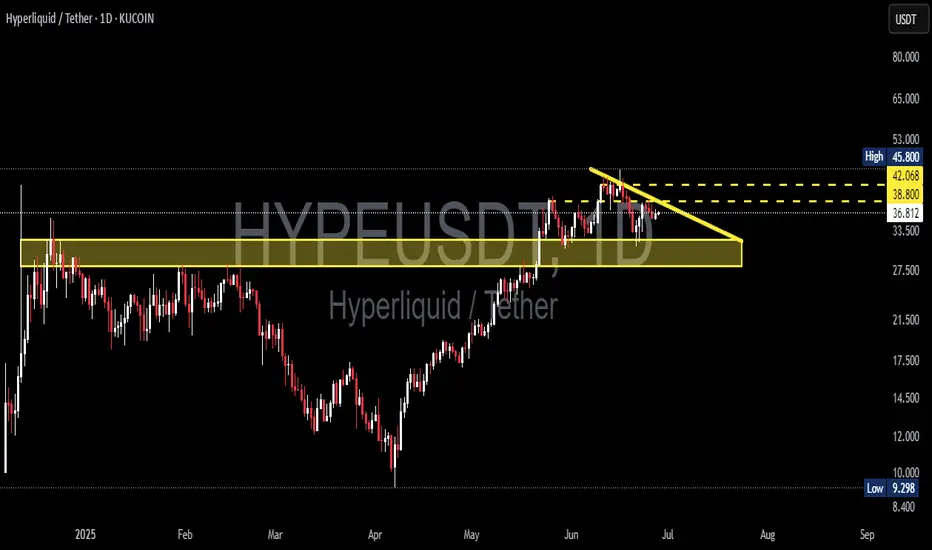
HYPE/USDT Ready for a Breakout? Watch These Key LevelsAnalysis Description:
The HYPE/USDT pair is currently forming a descending triangle pattern on the 1D timeframe — a classic technical setup that often signals a strong upcoming price move, either upward or downward.
🔶 Strong Support Block:
The yellow horizontal zone between 33.500 – 36.785 USDT represents a solid support area where price has repeatedly bounced with strong volume. This zone is ideal for monitoring buy-back opportunities if price pulls back.
📉 Descending Resistance Line:
A descending trendline has been acting as dynamic resistance. A breakout above this line could trigger a significant bullish continuation.
🎯 Upside Targets (If Breakout Occurs):
Target 1: 38.800 USDT (minor resistance)
Target 2: 42.068 USDT (mid-range target)
Target 3: 45.800 USDT (major resistance / previous high)
📌 Trading Strategy:
Conservative Entry: Buy on support re-test within the 33.500 – 36.785 USDT zone.
Aggressive Entry: Buy after a confirmed daily breakout above the descending trendline.
Stop Loss: Below the support block, around 33.000 USDT.
💡 Additional Note:
Watch for increased volume during the breakout — this would validate the move and confirm strong momentum. If the breakout fails, expect further sideways consolidation within the current range.
#HYPE #HYPEUSDT #AltcoinBreakout #CryptoChart #TechnicalAnalysis #CryptoTrading #DescendingTriangle #BullishSetup #CryptoCommunity
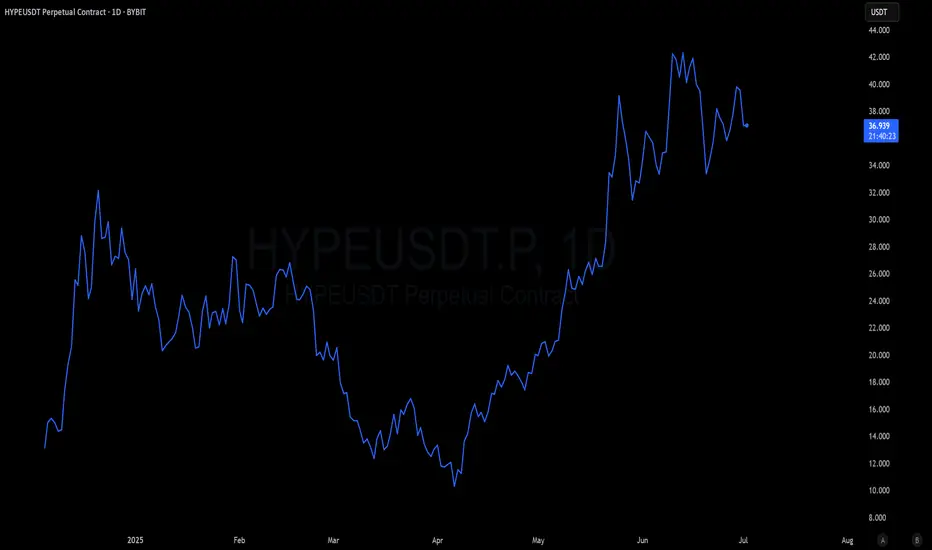
Hype's path to $55BYBIT:HYPEUSDT.P is currently forming a wedge shape pattern, is it indicating that it will break out and follow Path A, the blue path? I'm not so sure, I am sure we'll hit $55 either way.
If we take the red path, Path B, we'll come down to some heaviy support which could give us the fuel needed to get to $55
Out of all of the oscillators I was using, all except the chop zone on the daily mind you, were in bearish mode. So logically one would choose the red Path B right?
I can't wait to see how this plays out, shall we dip some and buy some more BYBIT:HYPEUSDT.P on Path B or experience more of a continuation of the current trendline to $55?
Let me know what you think in the comments, that'ls all for today, let's go HYPE!!! straight to $55!

HYPE’s Triangle Is Tightening! Get Ready for What’s NextYello, Paradisers! Are you watching what #HYPE is doing while the rest of the market barely holds on? We've been talking about this for a while, some altcoins are setting up for their next big move, and HYPE just might be leading the pack.
💎While the broader crypto market remains in a corrective or consolidative phase, HYPE has quietly maintained strength, pushing above a critical support/resistance zone and now forming a converging triangle pattern, a classic setup for explosive movement.
💎#HYPEUSDT is in a sideways consolidation phase. Price action is calm on the surface, but what’s actually unfolding is a textbook build-up. The next move could be a retest of the EMA-50, which sits near the 31.480 level. That zone also aligns with a moderate support area, making it a solid demand zone for bulls to reload and re-accumulate.
💎Even if HYPE slides lower into the 30.00 to 28.00 strong support region, it wouldn’t damage the structure. In fact, such a move would shake out late longs and weak hands, further strengthening the overall foundation. A drop into that zone should not be seen as failure, but rather as a potential springboard for the next impulsive wave.
💎The key to watch remains the descending resistance at the 37.20 level. Once this is broken with volume and conviction, the price is likely to push toward 40.05—a moderate resistance. But don’t get it twisted. That’s not where the bulls are aiming to stop. The structure, momentum, and higher-timeframe alignment all suggest this isn’t the final destination. Bulls are likely targeting the $47–$50 range, an area that isn’t just technical, it’s psychological mark as well.
Paradisers, strive for consistency, not quick profits. Treat the market as a businessman, not as a gambler.
MyCryptoParadise
iFeel the success🌴

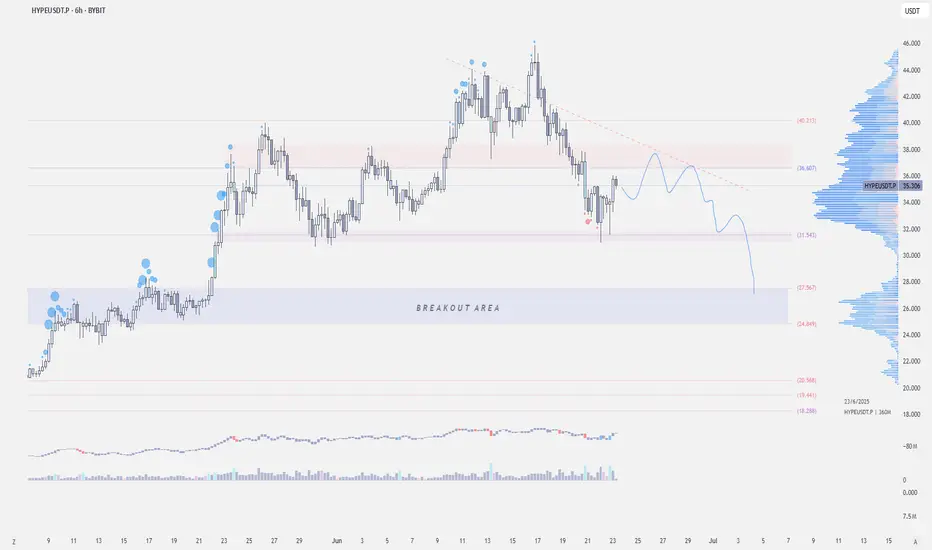
$HYPEUSDT - LTF OutlookKUCOIN:HYPEUSDT | 6h
$30 is holding for now, but if it can’t get back above $37.5–$38 soon, we might see it trading back to the $27–24 breakout zone
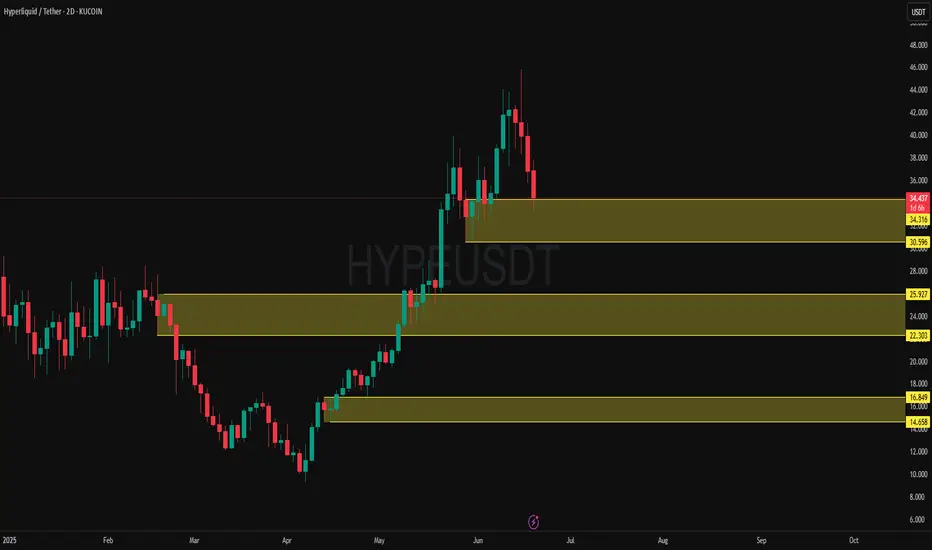
HYPE/USDT: Analyzing Major Buying Levels & Current RetracementPrice Action and Trend:
Since late 2024, HYPE/USDT has exhibited a volatile but generally upward-biased trend, particularly from April 2025 onwards. The initial period in late 2024 and early 2025 showed significant volatility with rapid pumps and dumps, characteristic of a nascent or highly speculative asset. A notable downtrend occurred from late February to mid-April 2025, reaching a low around the $12-$13 range. Following this, there's been a strong uptrend, with price breaking out of previous resistance levels and establishing new highs in May and June 2025, peaking near $40-$42. Currently, the price is undergoing a significant retracement from its recent highs.
Major Buying Levels (Yellow Zones):
The yellow zones on the chart clearly delineate significant demand (buying) levels:
Lowest Zone ($14.658 - $16.849) : This zone served as a strong accumulation area in late April and early May 2025. Price found substantial support here after the preceding downtrend, indicating a strong influx of buyers. This zone represents a foundational demand level where strong buying interest emerged, leading to the subsequent upward impulse.
Middle Zone ($22.303 - $25.927) : After the initial rally from the lowest zone, price consolidated and then retested this middle zone in late May 2025. The swift bounce from this area confirms its role as a significant demand zone, where buyers stepped in to prevent further declines and propel the price higher. This zone likely represents a point where early buyers took profits, and new demand entered, or previous buyers added to their positions.
Highest Zone ($30.596 - $34.316) : This most recent yellow zone became active in June 2025. After breaking through earlier resistance, price retraced into this area following its peak. The current price is hovering around the upper boundary of this zone ($34.316), indicating that buyers are attempting to defend this level. This zone signifies a crucial area where previous resistance may have flipped into support, attracting new buying interest. Its ability to hold will be critical for the continuation of the uptrend.
Supply Zones:
While not explicitly highlighted in yellow, several supply zones are evident where selling pressure intensified:
Around $27-$28 (Late 2024/Early 2025): Multiple wicks and rejections around this price range in late 2024 and early 2025 suggest a strong supply area. Price struggled to sustain above this level on several occasions, leading to pullbacks.
Around $30-$31 (Early 2025): Similar to the above, this area acted as resistance, causing price to reverse downwards after attempts to break higher.
The recent peak around $40-$42 (June 2025): This is the most significant recent supply zone. The sharp rejection from this area, marked by the long upper wick and subsequent bearish candles, indicates strong selling pressure at these elevated prices. This suggests profit-taking by earlier buyers and/or new shorting interest.
Current Price Position:
The current price of HYPE/USDT is approximately $34.345, which is at the upper boundary of the highest major buying level (yellow zone: $30.596 - $34.316). This indicates that the price has retraced significantly from its recent peak and is currently testing a crucial demand zone. The reaction at this level will be paramount in determining the immediate future direction.
Potential Future Scenarios:
Bullish Scenario: If the highest yellow zone ($30.596 - $34.316) holds as strong support, and buying pressure re-emerges, HYPE/USDT could consolidate within this zone before attempting another rally towards the recent highs ($40-$42) and potentially breaking above them. A strong bounce from this level would confirm renewed buyer confidence.
Bearish Scenario: If the current demand zone ($30.596 - $34.316) fails to hold, indicating a lack of buying interest at these levels, HYPE/USDT could see further downside. The next potential support levels would then be the middle yellow zone ($22.303 - $25.927). A break below the current zone would signal a shift in market sentiment and potentially the beginning of a deeper correction.
Key Observations:
Clear Demand Zone Effectiveness: The yellow zones have historically served as effective demand zones, leading to significant bounces and upward movements. This reinforces their importance as areas where institutional or significant retail buying has occurred.
Volatility and Wicks: The presence of long wicks (both upper and lower) indicates periods of significant price discovery and battle between buyers and sellers, especially around key levels.
Breakout and Retest Pattern: The price has shown a tendency to break out of resistance, then retest those levels (which often flip to support) before continuing its move, as seen with the middle yellow zone.
Recent Pullback: The current pullback from the highs around $40-$42 suggests profit-taking and the encounter of a strong supply zone. The ability of buyers to absorb this selling pressure at the current demand level will be a key determinant of future price action.
In summary, HYPE/USDT is at a critical juncture, testing a major buying level. The market's reaction to this demand zone will dictate whether the recent bullish momentum can be sustained or if a deeper correction is on the horizon.