HYPERUSDT Forming Bullish WaveHYPERUSDT is forming a compelling bullish wave pattern, a continuation formation indicating strong upward momentum is building following a recent correction and consolidation. This pattern typically reflects renewed buyer strength, marked by higher highs and higher lows as momentum reasserts itself—high-probability setup territory for traders looking for continuation moves.
Recent price action supports this bullish outlook: the pair has broken above a key resistance level on solid volume, reinforcing the pattern and increasing the likelihood of further upward acceleration. This breakout phase is often where traders look to position for the next leg up, and with volume backing the move, confidence in the rally's sustainability grows.
Fundamentally, the project behind HYPER is gaining traction as well. Bitcoin Hyper is positioning itself as a layer-2 scaling solution for Bitcoin—built using the Solana Virtual Machine for high performance and scalability. It offers near-instant(tx) finality and low-cost transactions, enabling DeFi, gaming, and app development on Bitcoin’s network. The narrative is gaining further momentum, with its presale surpassing $8 million and promising massive upside potential, especially in a renewed bull market.
Putting it all together, HYPERUSDT has the technical structure, volume support, and narrative tailwinds lining up perfectly for a strong bullish run. Traders targeting continuation setups should monitor for sustained price action above key levels. The projected 90% to 100%+ upside reflects the strength of this confluence.
✅ Show your support by hitting the like button and
✅ Leaving a comment below! (What is your opinion about this Coin)
Your feedback and engagement keep me inspired to share more insightful market analysis with you!
HYPERUSDT
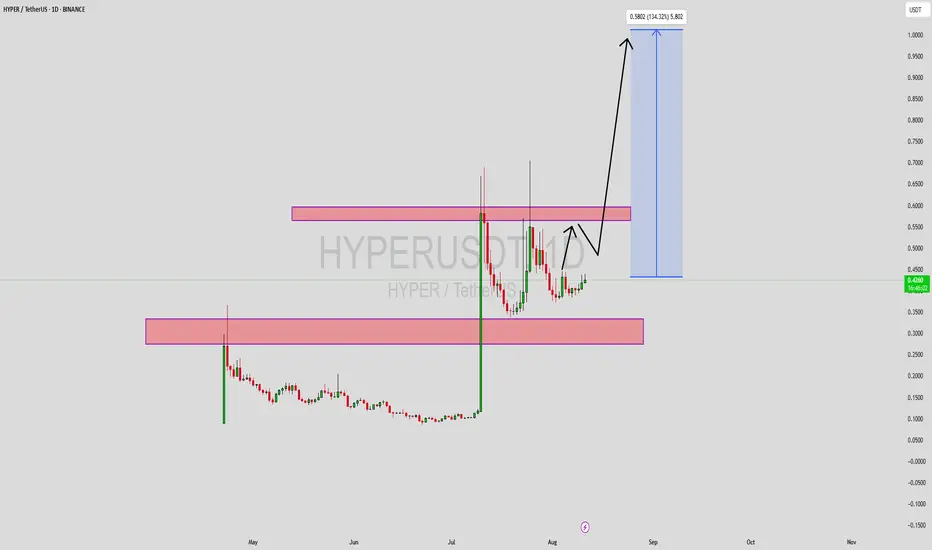
HYPERUSDT Forming Bullish ContinuationHYPERUSDT is capturing significant attention as it emerges from a consolidation zone, signaling a potential bullish continuation. After a massive impulse move to the upside, the price found support at a critical zone, which has now flipped into a demand area. This area is acting as a strong base for buyers, with volume steadily increasing—a key indication of accumulation and renewed interest from market participants.
Currently, the price is forming a structure that reflects bullish momentum, supported by recent higher lows and increased wick rejections from below. This kind of setup often precedes a strong breakout, especially when reinforced by strong volume, as seen here. The chart suggests a potential upside move of over 130%, targeting previous liquidity zones and untouched resistance areas, as buyers step in aggressively.
HYPER is becoming a trending topic in the altcoin space, with investors closely watching its price action for signs of a full recovery. As trading sentiment shifts bullish and on-chain metrics support the narrative, HYPERUSDT stands out as one of the higher potential mid-cap coins. A breakout beyond recent highs could quickly accelerate gains, given the relatively thin resistance levels above.
This setup is ideal for breakout traders and swing positions, especially as the broader market regains confidence. Patience and technical confirmation will be key, but HYPERUSDT is positioning itself as a standout opportunity for the weeks ahead.
✅ Show your support by hitting the like button and
✅ Leaving a comment below! (What is You opinion about this Coin)
Your feedback and engagement keep me inspired to share more insightful market analysis with you!
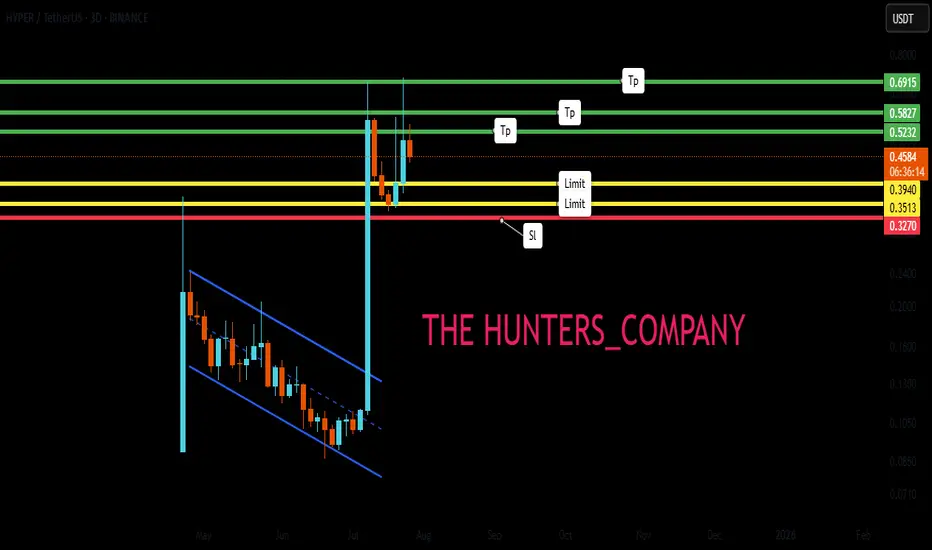
Memecoin is risky but profitable...Hello friends🙌
Given the channel's failure on the weekly time frame, there is now a good opportunity to buy in the price reversal or price correction, of course, with capital and risk management.
🔥Follow us for more signals🔥
*Trade safely with us*
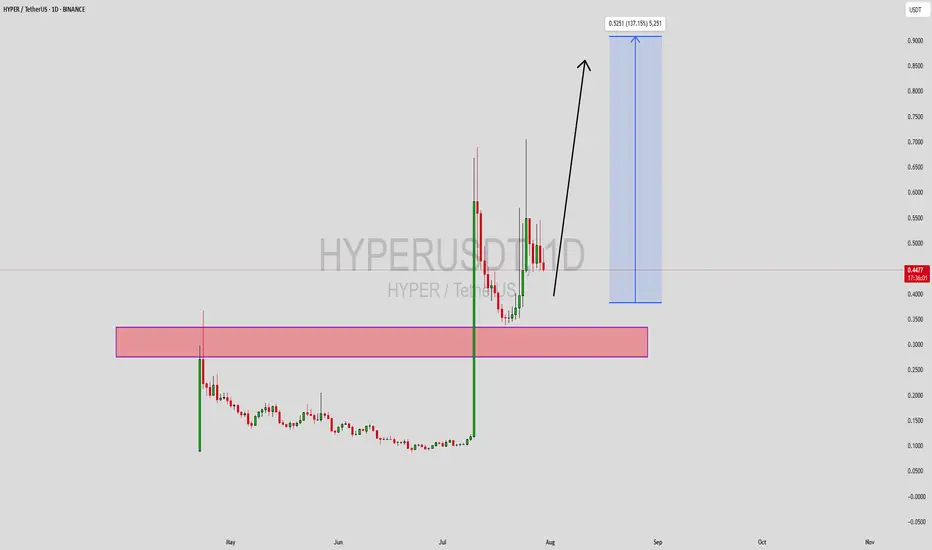
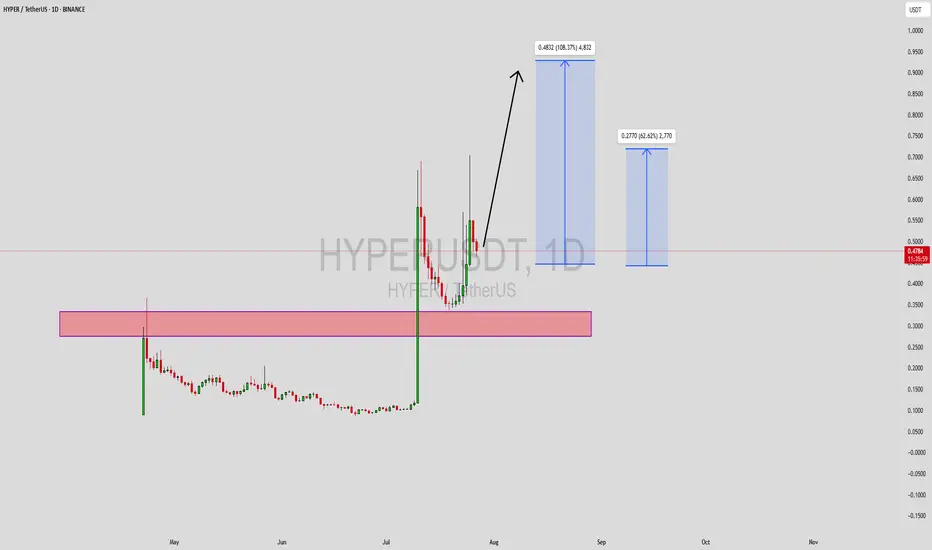
HYPERUSDT Forming Bullish ReversalHYPERUSDT is currently forming a bullish reversal pattern, suggesting a potential shift in momentum from bearish to bullish. This type of setup typically emerges after a downtrend, signaling that sellers are losing strength and buyers are preparing to reclaim control. The current chart shows early signs of trend exhaustion with tightening price action, which often precedes a breakout in the opposite direction. This setup is particularly attractive for swing traders looking to capitalize on a major reversal.
Volume activity is supporting the reversal thesis, with increased accumulation evident at key support zones. This suggests strong interest from investors and smart money anticipating a move higher. Bullish reversal patterns backed by volume typically lead to sharp rallies, and based on this structure, HYPERUSDT has the potential to deliver gains of 90% to 100%+ in the coming sessions. Confirmation of this setup will be a breakout above the neckline or key resistance with sustained buying volume.
Investor sentiment around HYPER is also improving, fueled by growing community support and rising visibility in crypto forums and social platforms. Technically, the coin is sitting at a major inflection point where a clean break can result in a parabolic upside move. Traders should remain alert for breakout confirmation and be ready to manage risk accordingly for maximum reward potential.
This trade idea aligns well with common reversal setups seen in successful altcoin rallies. If executed with precision, it offers both technical strength and strong upside risk-to-reward profile.
✅ Show your support by hitting the like button and
✅ Leaving a comment below! (What is You opinion about this Coin)
Your feedback and engagement keep me inspired to share more insightful market analysis with you!
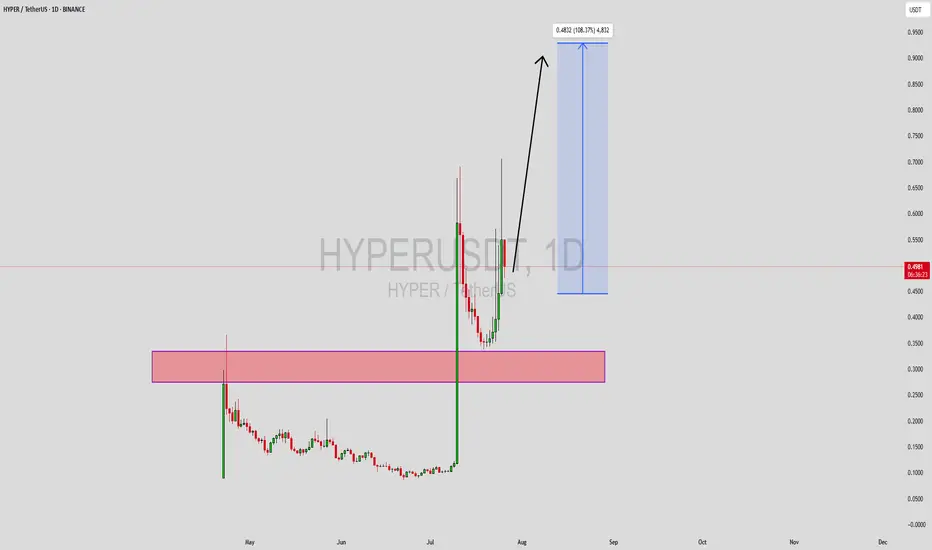
HYPERUSDT Forming Bullish WaveHYPERUSDT is currently showcasing a bullish wave pattern, a strong technical formation that often signals the continuation of an upward move after a healthy correction or consolidation. This wave structure suggests that bulls are regaining control, creating the potential for a significant price expansion. With volume remaining solid and consistent, this aligns well with the expected upside breakout, making this a promising setup. Analysts and short-term traders alike are eyeing a 90% to 100%+ gain from the current levels based on wave projection.
The growing interest around the HYPER project adds a layer of fundamental strength to the technical setup. With active community engagement and strategic development updates, HYPERUSDT has been catching investor attention across crypto forums and social media platforms. This increasing visibility could further drive price action, especially if market conditions remain favorable for altcoin momentum.
Looking at historical price movements, HYPERUSDT has shown the capacity for sharp, impulsive waves followed by periods of consolidation—characteristics of a trending asset. If the current bullish wave completes its projected move, it could push the price back into a previous resistance zone or even break into price discovery, depending on broader market sentiment.
Given the technical pattern confirmation and rising investor interest, HYPERUSDT is shaping up to be a strong short-to-mid-term play. Traders looking for volatility and high-reward setups may want to keep this pair on their active watchlist.
✅ Show your support by hitting the like button and
✅ Leaving a comment below! (What is You opinion about this Coin)
Your feedback and engagement keep me inspired to share more insightful market analysis with you!
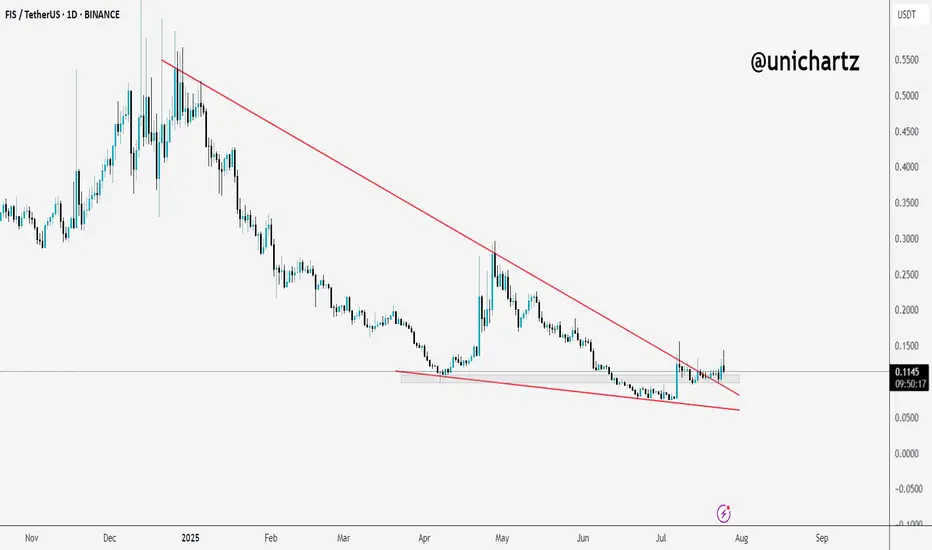
FIS Breaks Out of Falling Wedge – Reversal in Play?$FIS/USDT has finally broken out of a long-term falling wedge pattern, a structure that often signals reversal.
Price is now holding above the breakout zone, showing signs of strength.
As long as it stays above the wedge, we might see further upside in the coming days.
DYOR, NFA
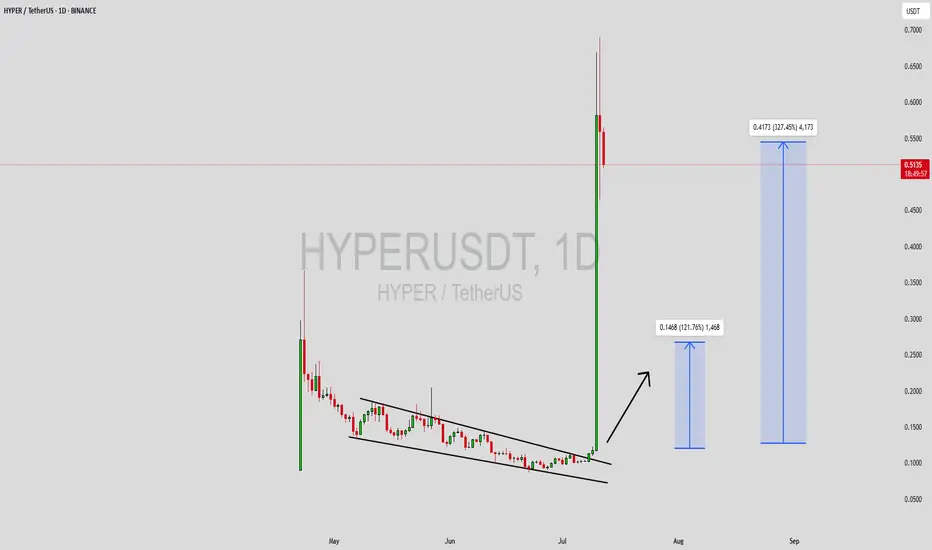
HYPERUSDT Forming Falling WedgeHYPERUSDT is catching the attention of traders with its clear falling wedge pattern, a technical formation often linked to strong bullish reversals. This setup signals that the asset has been consolidating within narrowing trendlines and may soon break out with significant momentum. With volume levels holding steady, the conditions are aligning for a potential explosive move that could deliver an impressive 290% to 300% gain for investors who position themselves early.
The HYPER project is starting to build a name for itself in the crypto space, attracting investors interested in its unique blockchain applications and real-world utility. As awareness of the project grows and its community expands, more market participants are likely to accumulate HYPERUSDT, providing further fuel for a breakout. The increased interest is reflected not just in price action but also in the steady rise in trading activity, which often precedes major upswings.
Technically, the falling wedge is one of the most reliable patterns for identifying trend reversals. Once the price convincingly breaks above the descending resistance line with a surge in buying volume, it can trigger a wave of bullish momentum as traders and algorithms react to the breakout confirmation. It’s important to monitor this breakout closely and manage risk wisely to capitalize on this high-probability setup.
✅ Show your support by hitting the like button and
✅ Leaving a comment below! (What is You opinion about this Coin)
Your feedback and engagement keep me inspired to share more insightful market analysis with you!
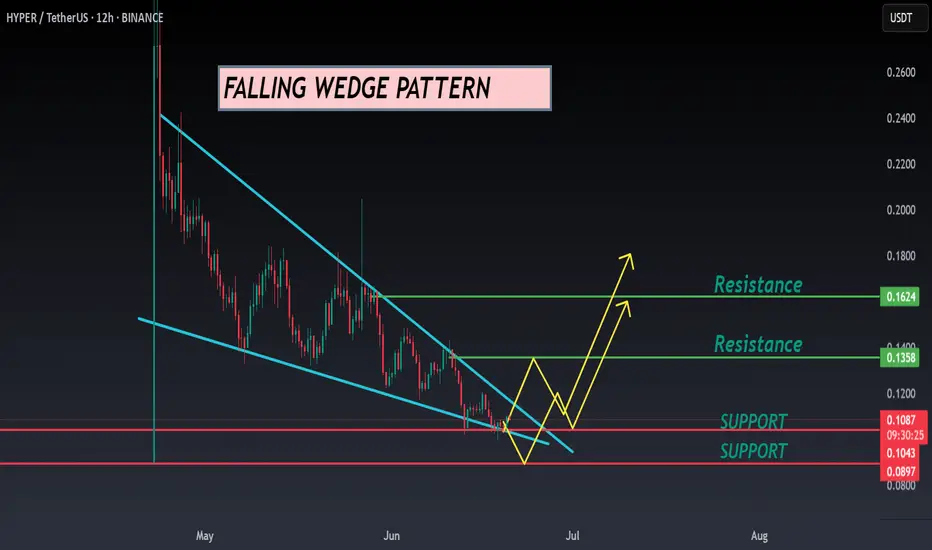
HYPER ANALYSIS🔮 #HYPER Analysis - Update 🚀🚀
💲 We can see that there is a formation of Falling Wedge Wedge Pattern in #HYPER and we can see a bullish movement after a good breakout. Before that we would see a little retest and and then a bullish movement.
💸Current Price -- $0.1087
📈Target Price -- $0.1358
⁉️ What to do?
- We have marked crucial levels in the chart . We can trade according to the chart and make some profits. 🚀💸
#HYPER #Cryptocurrency #Breakout #DYOR
HYPERUSDT Forming Strong Bullish ReversalHYPERUSDT is currently trading within a classic falling wedge pattern — a formation known for signaling strong bullish reversals once a breakout occurs. This structure is typically a sign of seller exhaustion and accumulation by smart money, particularly when accompanied by steady or rising volume, as we see now. With bullish divergence becoming more apparent on momentum indicators, the technical conditions are aligning for a significant price rally.
This setup suggests the potential for an explosive breakout to the upside, with a projected gain range of 80% to 90%+ once the upper resistance of the wedge is decisively breached. The falling wedge is forming at the tail end of a sustained downtrend, which often serves as a base for major upward reversals. A breakout above key resistance could bring a sharp bullish wave, pushing HYPERUSDT back toward previous supply zones and even forming new local highs.
Investor interest in the HYPER project is gaining traction, with increasing mentions across social platforms and a noticeable uptick in trading activity. As new capital flows into smaller-cap altcoins showing promising technicals, HYPER appears to be on many watchlists, especially among swing traders and early-stage investors looking for asymmetric risk/reward setups.
Overall, HYPERUSDT is offering a compelling opportunity based on this pattern. A confirmed breakout from the wedge may trigger strong momentum in the days ahead, particularly as market sentiment leans increasingly risk-on.
✅ Show your support by hitting the like button and
✅ Leaving a comment below! (What is You opinion about this Coin)
Your feedback and engagement keep me inspired to share more insightful market analysis with you!

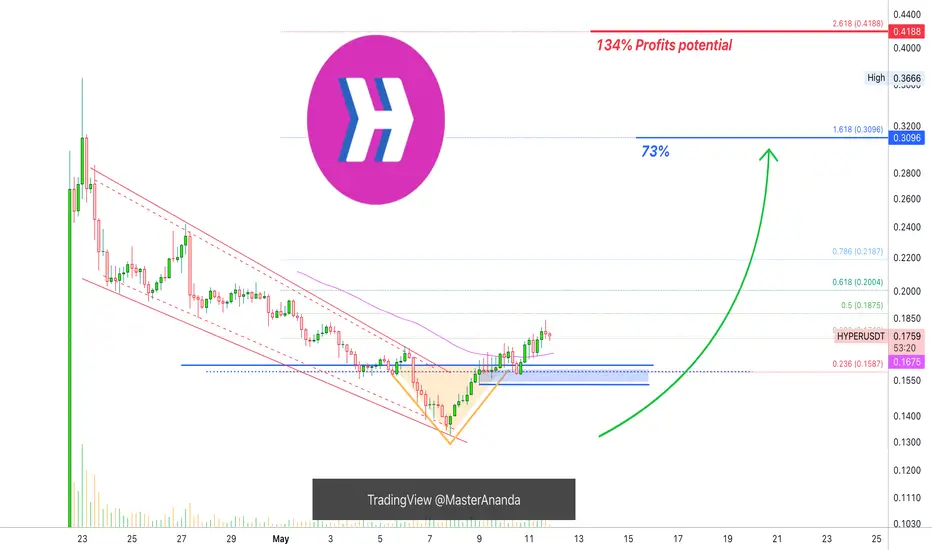
Hyperlane Short-Term (134% Profits Potential)Hyperlane (HYPERUSDT) produced a v shaped bottom recently as it broke out of a major downtrend. This chart is not very strong as there isn't much volume but the action is already happening above EMA55 which is a strong bullish signal.
The low volume signal can be ignored because price action is more important when it comes to reading a chart. Volume can be low, or high, for a number of reasons. The volume indicator can be a great tool but it doesn't work without a context and it can be easily misinterpreted.
We can use it to support other signals but never in isolation nor to make a decision based on what the trading volume of a pair is doing.
Current price action, the break above this mid-term moving average, marketwide action and Bitcoin trading above $100,000 are all bullish signal. So we can easily make the assumption that HYPERUSDT will continue to grow. Not that it will grow, but that this is the most likely scenario in the coming weeks and months.
Market conditions can always change and they already changed from bearish to bullish last month. it will take a while before the market goes back into bearish mode. A bullish cycle can last anywhere between 6 to 12 months.
Namaste.
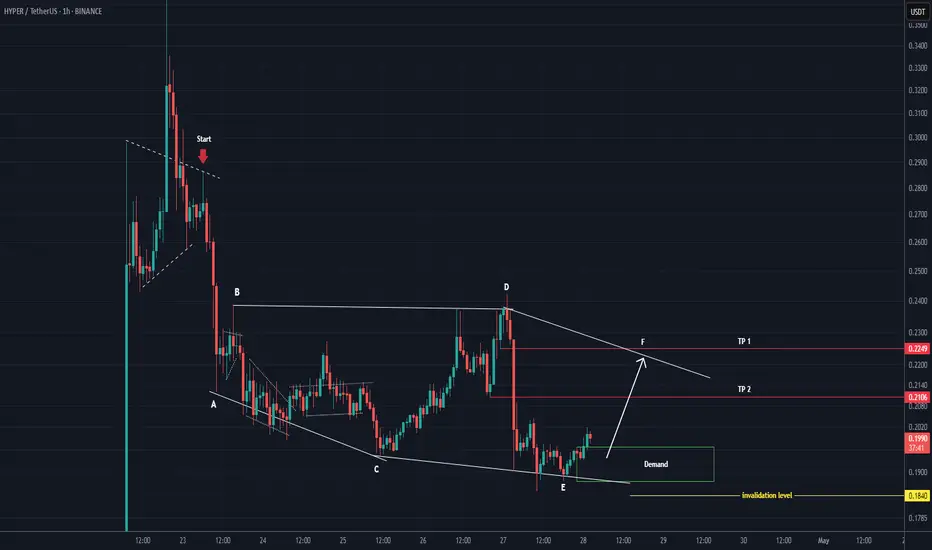
HYPER Analysis (4H)From where we placed the red arrow on the chart, the HYPER correction has started.
This corrective pattern might be diametric, with wave E near completion.
By maintaining the green box, it could move toward the targets, which are marked on the chart.
A daily candle closing below the invalidation level will invalidate this analysis.
For risk management, please don't forget stop loss and capital management
When we reach the first target, save some profit and then change the stop to entry
Comment if you have any questions
Thank You