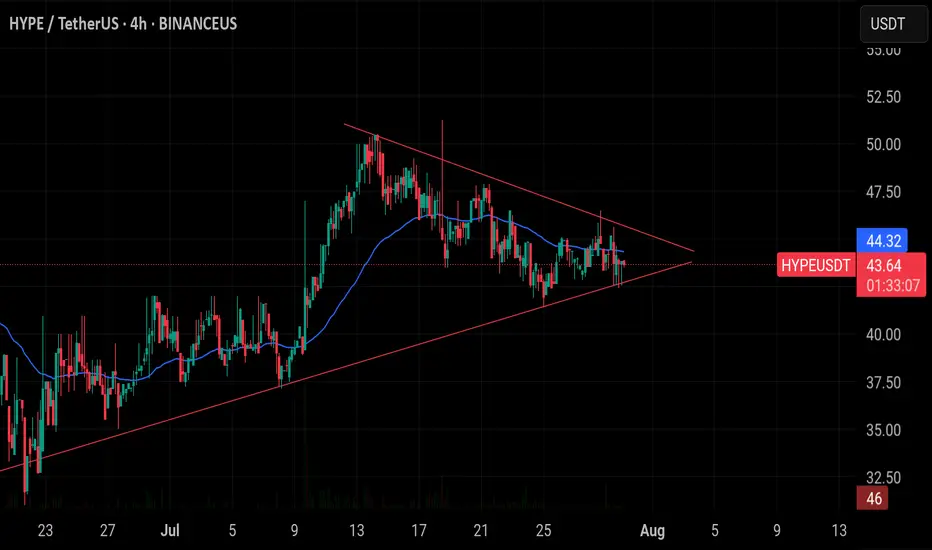
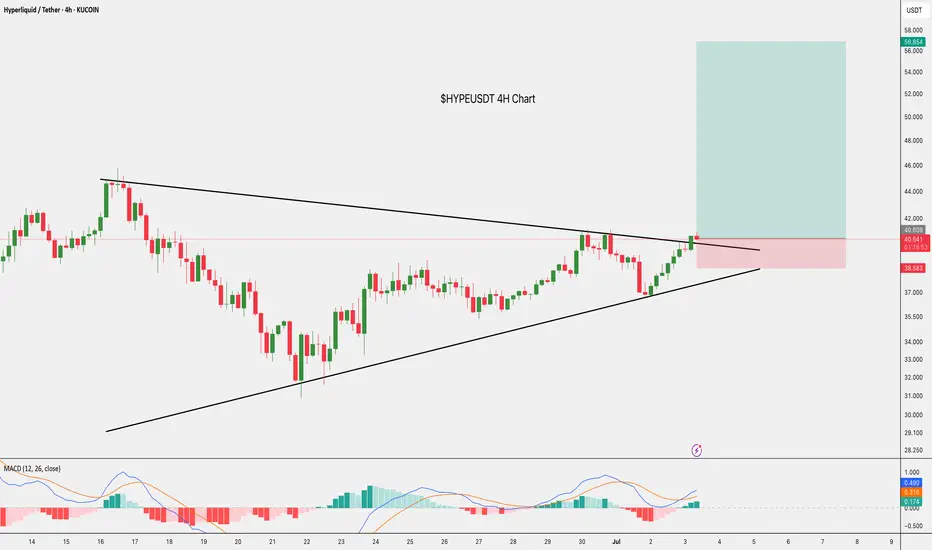
$HYPE/USDT is sitting at the edge of a triangle.$HYPE/USDT is sitting at the edge of a triangle. If it breaks above $44, it could jump to $52. But if it falls and close 4h candle below $42, the setup will fail.
HYPEUSDT
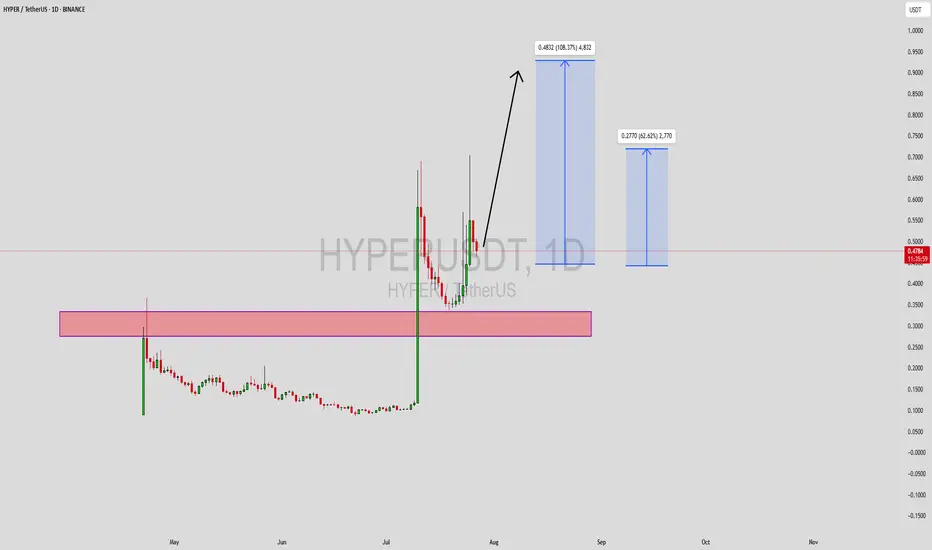
HYPERUSDT Forming Bullish ReversalHYPERUSDT is currently forming a bullish reversal pattern, suggesting a potential shift in momentum from bearish to bullish. This type of setup typically emerges after a downtrend, signaling that sellers are losing strength and buyers are preparing to reclaim control. The current chart shows early signs of trend exhaustion with tightening price action, which often precedes a breakout in the opposite direction. This setup is particularly attractive for swing traders looking to capitalize on a major reversal.
Volume activity is supporting the reversal thesis, with increased accumulation evident at key support zones. This suggests strong interest from investors and smart money anticipating a move higher. Bullish reversal patterns backed by volume typically lead to sharp rallies, and based on this structure, HYPERUSDT has the potential to deliver gains of 90% to 100%+ in the coming sessions. Confirmation of this setup will be a breakout above the neckline or key resistance with sustained buying volume.
Investor sentiment around HYPER is also improving, fueled by growing community support and rising visibility in crypto forums and social platforms. Technically, the coin is sitting at a major inflection point where a clean break can result in a parabolic upside move. Traders should remain alert for breakout confirmation and be ready to manage risk accordingly for maximum reward potential.
This trade idea aligns well with common reversal setups seen in successful altcoin rallies. If executed with precision, it offers both technical strength and strong upside risk-to-reward profile.
✅ Show your support by hitting the like button and
✅ Leaving a comment below! (What is You opinion about this Coin)
Your feedback and engagement keep me inspired to share more insightful market analysis with you!
HYPE Swing Long Opportunity - Altcoin Season📌 Fundamental Sentiment:
The crypto market — alongside broader risk assets — continues to gain traction. This momentum is largely fueled by rising expectations of policy shifts in the U.S., with Trump intensifying pressure on Jerome Powell and advocating for aggressive rate cuts from the Fed.
📌 Technical Analysis:
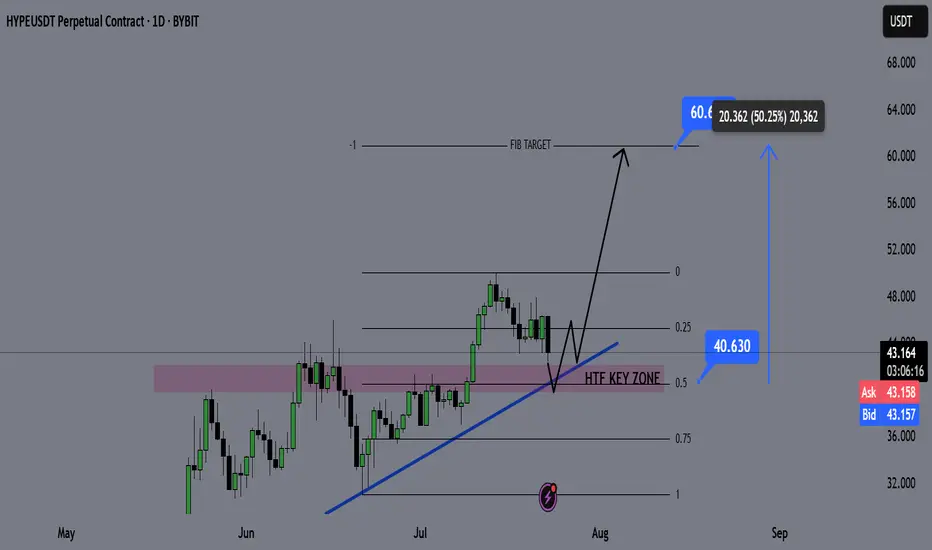
HYPE is approaching a key HTF bullish trendline, and confluences are stacking up in the same region:
✅ HTF Demand Zone
✅ Equilibrium (EQ) of the HTF bullish trend
✅ Bullish Trendline Support
These three HTF confluences overlapping at the same price zone indicate a high-probability setup for a significant bounce and a possible swing long opportunity.
📌 Gameplan:
Price hits HTF bullish trendline
HTF demand zone gets tested
EQ level tapped → discount offered to buyers
📌 LTF Confirmation Criteria:
I’ll wait for:
A 1H swing break
A strong 4H rejection candle
These will confirm momentum shift. If confirmed, I’ll enter a swing long.
🎯 Target: $60
💰 Potential gain: ~+50%
❗ Stop-loss: Below the swing low that triggers the LTF confirmation
—
🔔 Follow for daily setups and weekly macro recaps
💬 Drop your chart or questions below!
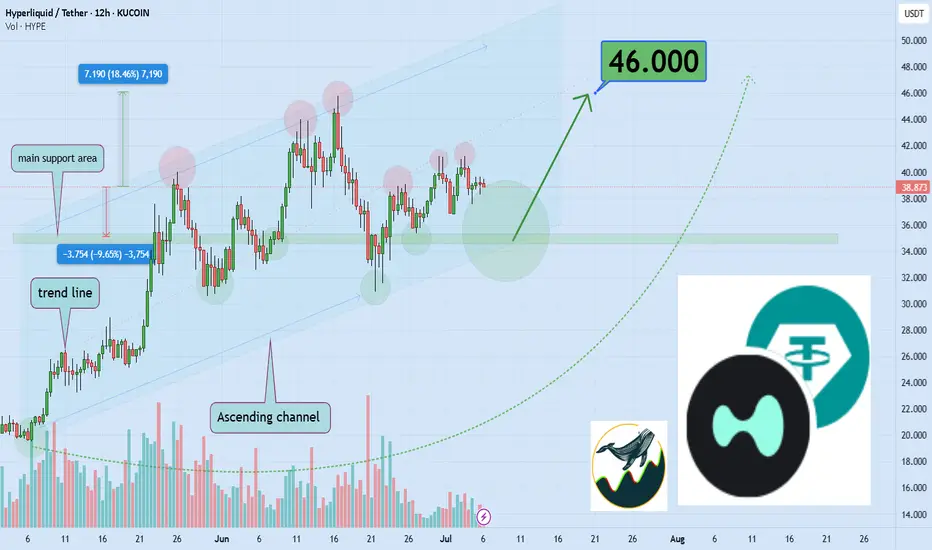
Watch Hyperliquid Surge 18% to $46 Key Resistance LevelHello,✌
let’s dive into a full analysis of the upcoming price potential for Hyperliquid 🔍📈.
KUCOIN:HYPEUSDT is trading within a reliable daily ascending channel and is currently near its lower boundary, where a strong daily support zone has formed. This setup suggests a potential upside of at least 18%, with a target around $46 , which aligns closely with a key trendline. 📈
✨ Need a little love!
We pour love into every post your support keeps us inspired! 💛 Don’t be shy, we’d love to hear from you on comments. Big thanks , Mad Whale 🐋
$HYPE - Short term OutlookKUCOIN:HYPEUSDT | 4h
Price just tapped the channel on its first test — expecting a minor pullback to the $47.5–$45.3 area (short term).
Key support to hold now is $45–43 for potential continuation toward $57–60 zone.
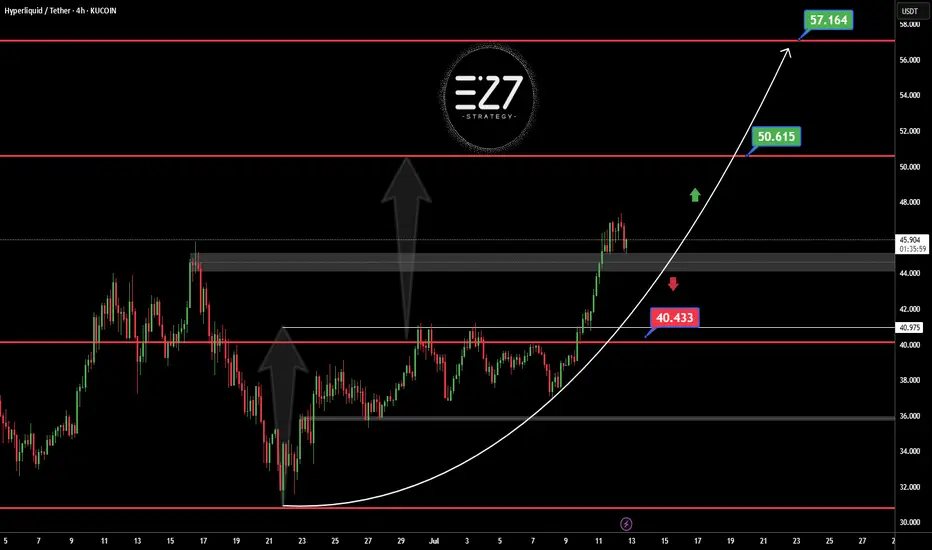
HYPEUSDT KUCOIN:HYPEUSDT 4H Analysis Price has broken out above the 44.5 support zone and is holding strong 🚀. As long as this level holds, targets are set at 50.615 and 57.164 📈. If 44.5 breaks down, next support is seen at 40.433 🔻.
Key Levels:
✅ Support: 44.5
🟩 Targets: 50.615 → 57.164
🔴 Next support if breakdown: 40.433
BTC / ETH / SOL / XRP / HYPE: Potential Trend StructuresIn this video, I share my current daily and weekly analysis on the trend structures of BTC, ETH, SOL, XRP, and HYPE, highlighting key support and resistance zones to watch in the coming sessions.
Charts featured in the video:
BTC
ETH
SOL
XRP
HYPE
Thank you for your attention and I wish you successful trading decisions!
If you’d like to hear my take on any other coin you’re tracking feel free to ask in the comments (just don’t forget to boost the idea first 😉).

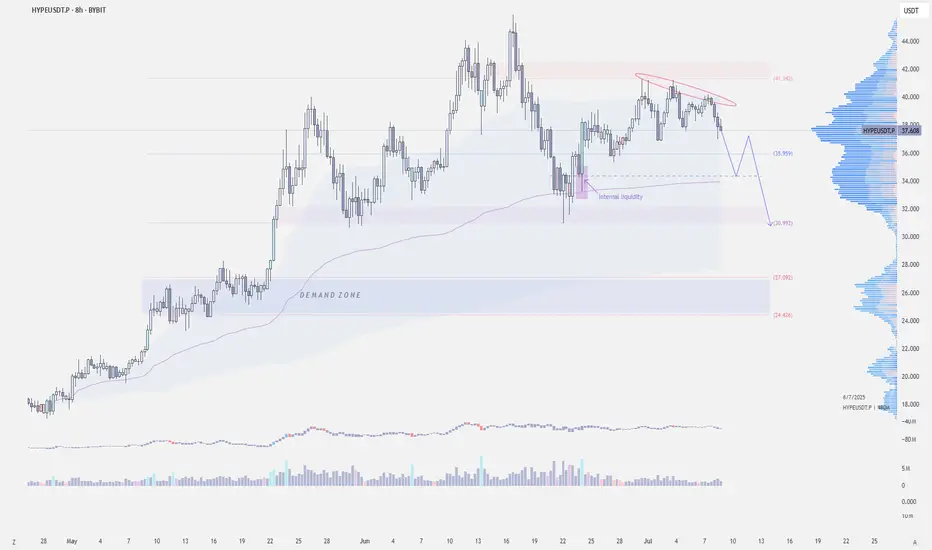
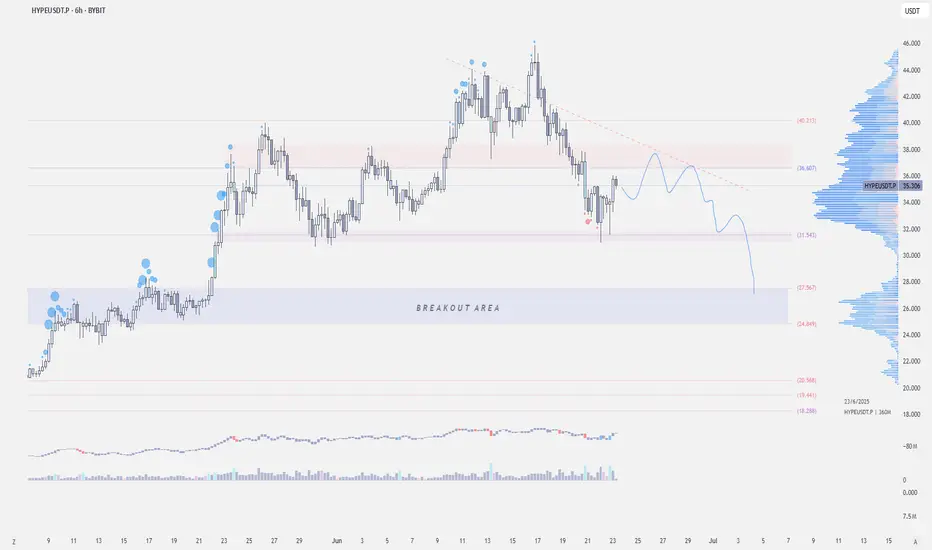
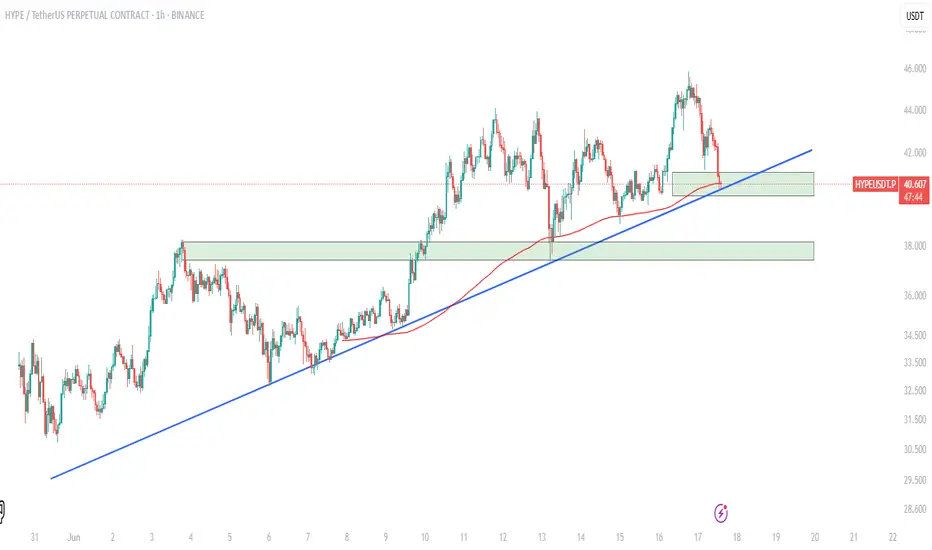
$HYPE - Short-term OutlookKUCOIN:HYPEUSDT | 8h
We're seeing a short-term distribution forming on the daily chart.
Price has now tested the supply zone around $42 three times and is struggling to break through.
There's local demand in the $34.5–$34 area, where I expect a reaction, in confluent with vwap. However, if price keeps getting rejected at $37–38, a move back to $30 is likely.
A break below $30 opens the door for a deeper drop toward $27–24, which is a higher timeframe demand zone.
$HYPEUSDT Trade Setup 4HKUCOIN:HYPEUSDT Trade
Entry: CMP
Stop Loss: $38.501
Target: $45.846, $56.845
Breakout from a triangle pattern with bullish MACD. Watch for retest entry.
DYOR, NFA.
HYPEUSDT Probably CookedToken driven by demand from trading on Hyperliquid. Crypto looks set for a few month long consolidation probably into Q4.
That loss in trading volume will reduce demand for the token and the company may be forced to sell the token to come up with large gains for its clients. Either way it's a bearish catalyst for the token which has really ran hard. Ugly head and shoulders as well as a topping pattern in an overall financial market that looks like it wants a pull back
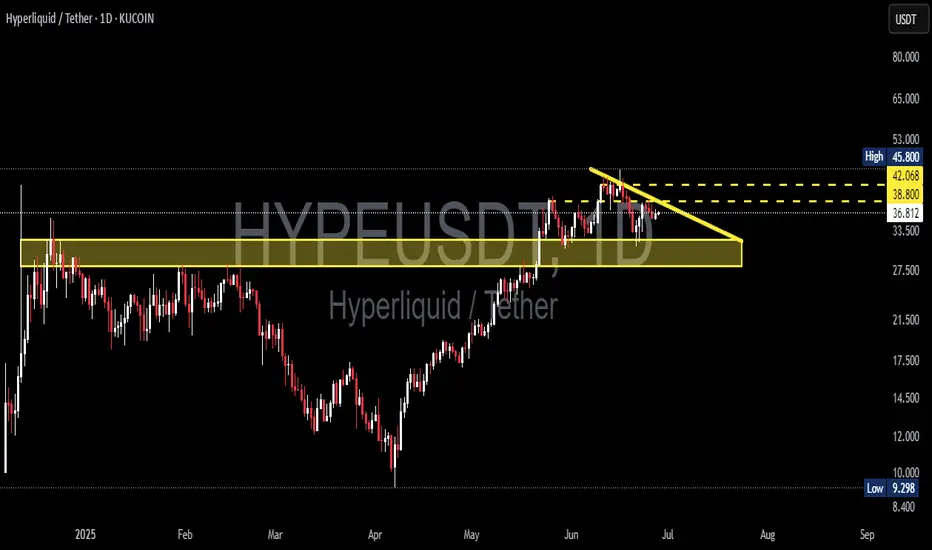
HYPE/USDT Ready for a Breakout? Watch These Key LevelsAnalysis Description:
The HYPE/USDT pair is currently forming a descending triangle pattern on the 1D timeframe — a classic technical setup that often signals a strong upcoming price move, either upward or downward.
🔶 Strong Support Block:
The yellow horizontal zone between 33.500 – 36.785 USDT represents a solid support area where price has repeatedly bounced with strong volume. This zone is ideal for monitoring buy-back opportunities if price pulls back.
📉 Descending Resistance Line:
A descending trendline has been acting as dynamic resistance. A breakout above this line could trigger a significant bullish continuation.
🎯 Upside Targets (If Breakout Occurs):
Target 1: 38.800 USDT (minor resistance)
Target 2: 42.068 USDT (mid-range target)
Target 3: 45.800 USDT (major resistance / previous high)
📌 Trading Strategy:
Conservative Entry: Buy on support re-test within the 33.500 – 36.785 USDT zone.
Aggressive Entry: Buy after a confirmed daily breakout above the descending trendline.
Stop Loss: Below the support block, around 33.000 USDT.
💡 Additional Note:
Watch for increased volume during the breakout — this would validate the move and confirm strong momentum. If the breakout fails, expect further sideways consolidation within the current range.
#HYPE #HYPEUSDT #AltcoinBreakout #CryptoChart #TechnicalAnalysis #CryptoTrading #DescendingTriangle #BullishSetup #CryptoCommunity
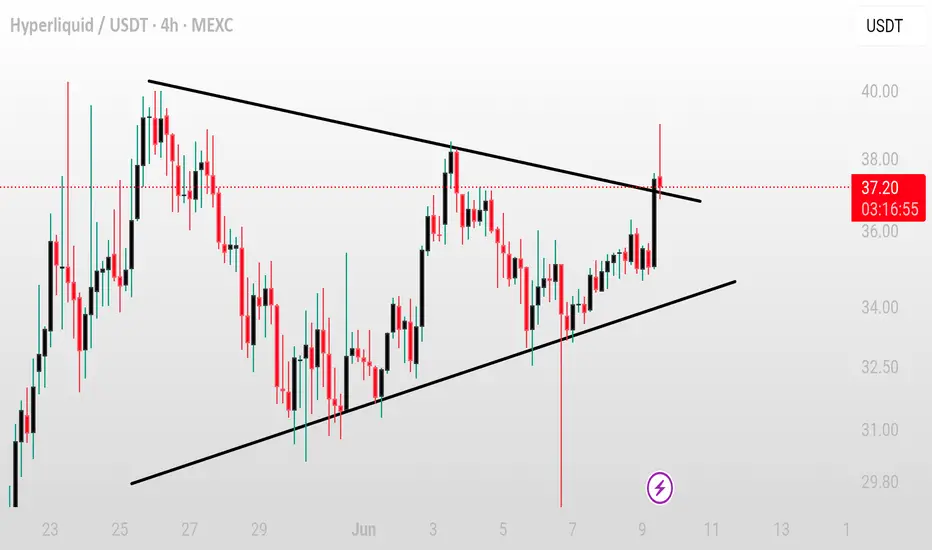
HYPE’s Triangle Is Tightening! Get Ready for What’s NextYello, Paradisers! Are you watching what #HYPE is doing while the rest of the market barely holds on? We've been talking about this for a while, some altcoins are setting up for their next big move, and HYPE just might be leading the pack.
💎While the broader crypto market remains in a corrective or consolidative phase, HYPE has quietly maintained strength, pushing above a critical support/resistance zone and now forming a converging triangle pattern, a classic setup for explosive movement.
💎#HYPEUSDT is in a sideways consolidation phase. Price action is calm on the surface, but what’s actually unfolding is a textbook build-up. The next move could be a retest of the EMA-50, which sits near the 31.480 level. That zone also aligns with a moderate support area, making it a solid demand zone for bulls to reload and re-accumulate.
💎Even if HYPE slides lower into the 30.00 to 28.00 strong support region, it wouldn’t damage the structure. In fact, such a move would shake out late longs and weak hands, further strengthening the overall foundation. A drop into that zone should not be seen as failure, but rather as a potential springboard for the next impulsive wave.
💎The key to watch remains the descending resistance at the 37.20 level. Once this is broken with volume and conviction, the price is likely to push toward 40.05—a moderate resistance. But don’t get it twisted. That’s not where the bulls are aiming to stop. The structure, momentum, and higher-timeframe alignment all suggest this isn’t the final destination. Bulls are likely targeting the $47–$50 range, an area that isn’t just technical, it’s psychological mark as well.
Paradisers, strive for consistency, not quick profits. Treat the market as a businessman, not as a gambler.
MyCryptoParadise
iFeel the success🌴

$HYPEUSDT - LTF OutlookKUCOIN:HYPEUSDT | 6h
$30 is holding for now, but if it can’t get back above $37.5–$38 soon, we might see it trading back to the $27–24 breakout zone
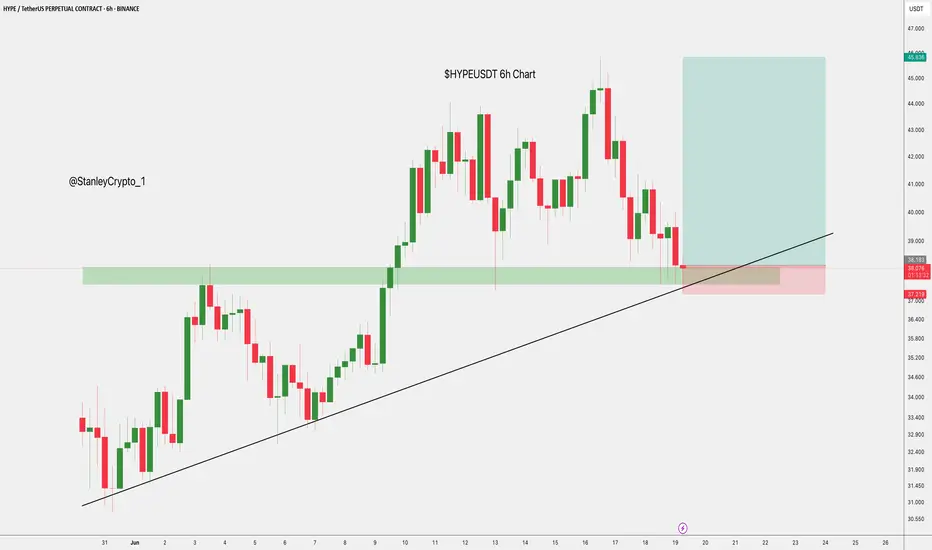
$HYPEUSDT Long Setup 6H Chart$HYPE/USDT – Long Setup (6H Chart)
- Entry Zone: $37.8 – $38.2
- Target: $45.8
- Stop Loss: $37.2
Price is bouncing off strong demand and an ascending trendline.
If support holds, we expect a bullish continuation
Break below $37.2 invalidates the setup.
DYRO, NFA
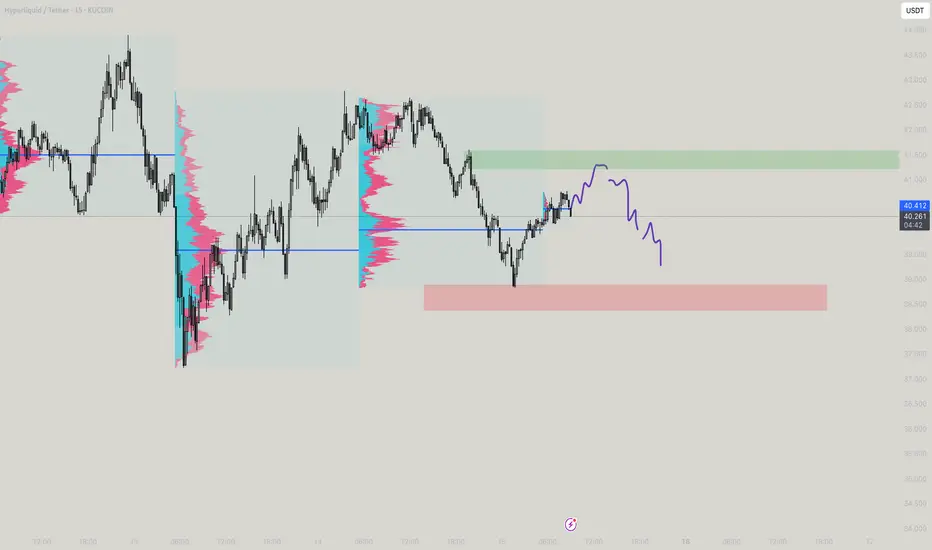
$HYPE Trade!!GETTEX:HYPE is testing the crucial support zone at $40.0–$40.5, right along the ascending trendline and 200 EMA on the hourly chart.
If this zone holds, we could see a rebound toward the $44.5–$46.0 resistance area.
However, a breakdown below $40.0 might trigger further downside toward the next major support at $38.0–$37.4.
Monitor closely—this zone will decide the next move.
Is it worth the HYPE!!Hype! Typical liquidity chase and then fall down, observe for the momentum and then go for the play
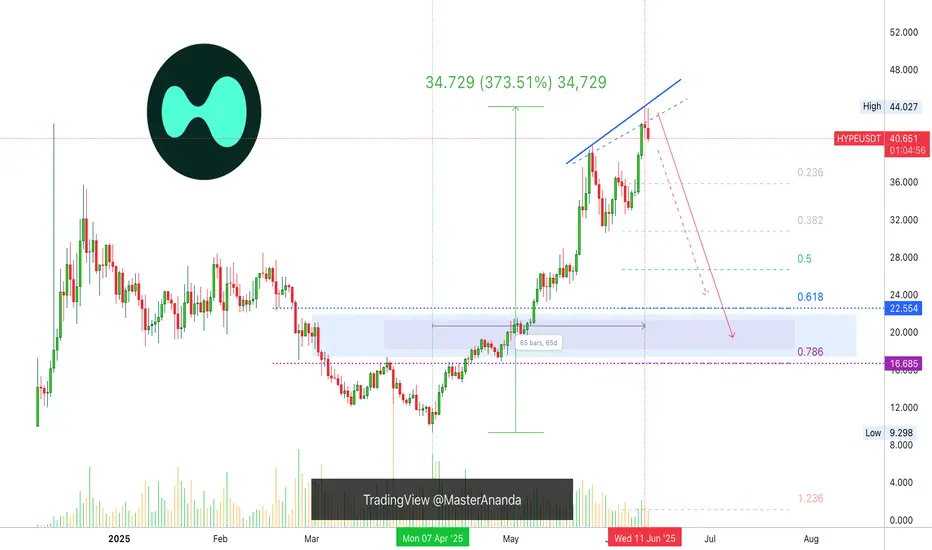
Hyperliquid Correction Exposed, $16.6-$22.5 Range To Be TestedAfter a strong rise there is always a strong correction and I will call this normal market behavior.
Hyperliquid entered the TOP20 altcoins by market capitalization and now sits at #11. Amazing feat.
In a matter of 65 days, between 7-April and 11-June, HYPEUSDT grew a very nice 373%.
A correction can take prices back below the 0.618-0.786 Fib. retracement support range. Which means between $16.7 and $22.5.
As usual, after the bearish wave is over, we can expect a new wave of growth. This one should unravel fast.
Thank you for reading and for your continued support.
Additional details can be found on the chart.
Namaste.
Hyperliquid HYPE price analysis🧐 This idea regarding the price of #HYPE is based more on our "intuition", as the project's tokenomics are excellent:
there will be no major coin unlocks this year, and 97% of the commission income of the #hyperliquid exchange will be directed towards the repurchase of its own token.
🤖 We previously managed to “predict” the growth of the #HypeUSDT price, so maybe our forecast will come true again) 👇
❗️ But this is by no means a call to shorts!
This idea is more about the opportunity to buy #Hype for $22-23 for your investment portfolio.
_____________________
Did you like our analysis? Leave a comment, like, and follow to get more
HYPE/USDT – Symmetrical Triangle BreakoutHYPE/USDT – Symmetrical Triangle Breakout
HYPEUSDT has broken out of a symmetrical triangle pattern, which often signals a strong upcoming move. If the breakout holds above the structure with consistent volume, we could see a continuation toward higher targets.
Symmetrical triangles are neutral patterns, but a breakout to the upside usually indicates bullish momentum building up.
Key levels to monitor:
– Breakout confirmation zone
– Immediate resistance above
– Retest of the triangle (if it happens)
Keep an eye on it — if HYPE sustains above the breakout level, a solid upward move may follow.
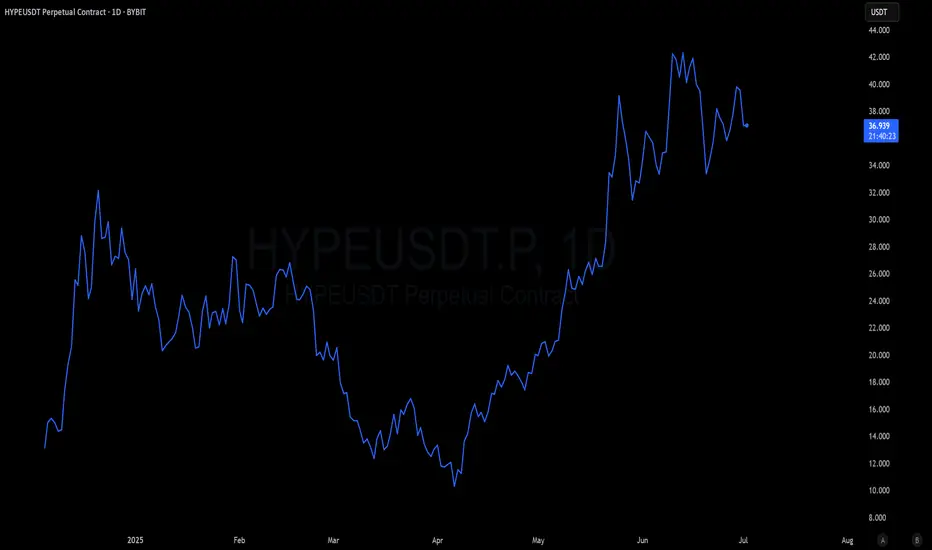
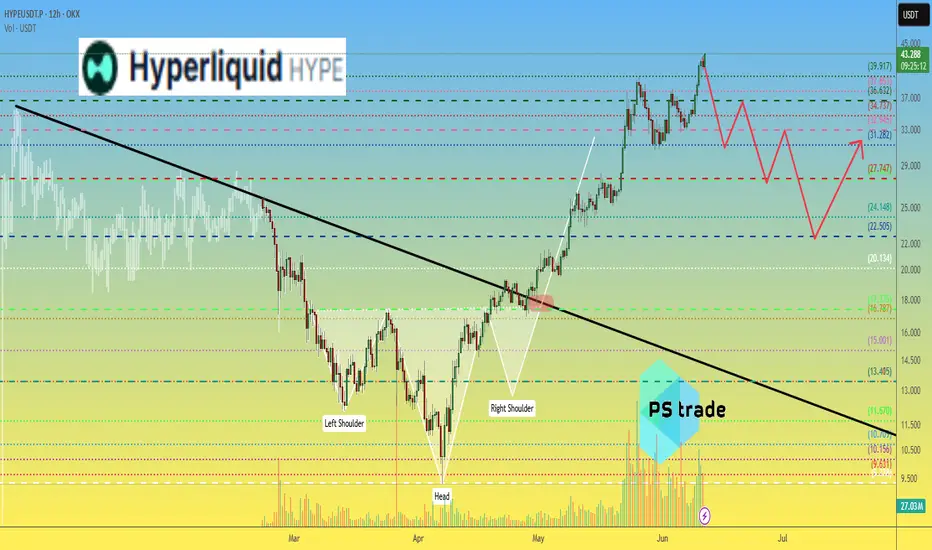
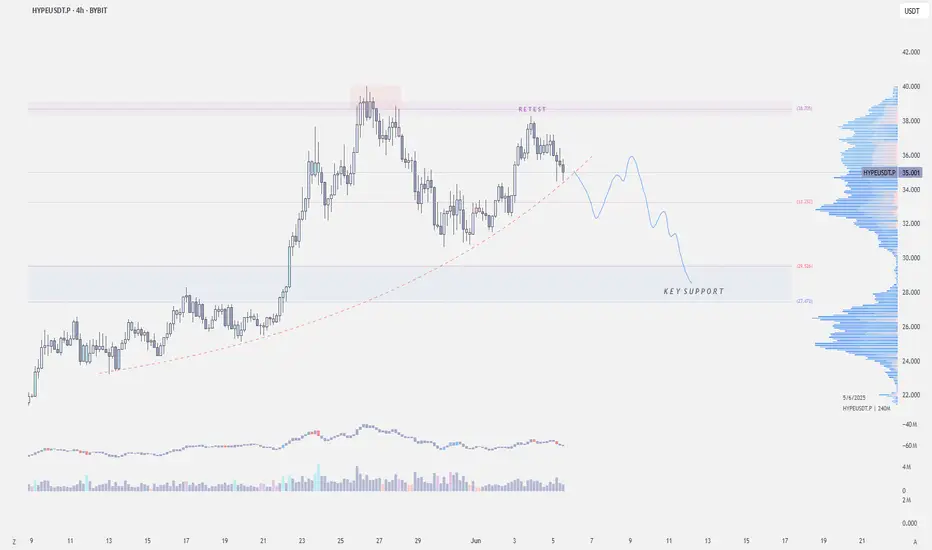
Phemex Analysis #87: Pro Tips for Trading Hyperliquid (HYPE)Hyperliquid ( PHEMEX:HYPEUSDT.P ) has rapidly become one of the most talked-about cryptocurrencies over the past two months. Impressively defying broader market uncertainties, HYPE soared from a low of $9.313 on April 7 to a remarkable high of $40.019 on May 26—achieving an astounding growth of approximately 329%.
However, caution is advised, as recent price action has formed a classic "Head-and-Shoulders" pattern, with the third peak emerging around June 3. This technical setup often indicates weakening bullish momentum and potential trend reversal. Given this scenario, let's delve deeper into several possible outcomes that could unfold for HYPE in the upcoming days.
Possible Scenarios
1. Bearish Reversal
The Head-and-Shoulders formation signals a potential bearish reversal. If HYPE breaks below the critical support levels at $31.5, especially with increased trading volume, and subsequently breaches the $30 support, the likelihood of a sharp downward movement intensifies.
Pro Tips:
Short Positions: Consider initiating short positions upon confirmed breakdowns below $31.5 or $30. Always employ tight stop-losses to manage risk effectively.
Long-Term Accumulation: For those with a longer-term bullish outlook on HYPE, watch closely for price stabilization around lower support levels at $25.5 and $24.3, which could offer strategic entry points for buying the dip.
2. Retesting the $30 Support Level
Another plausible scenario is that HYPE might retrace to the $30 support level, characterized by declining trading volume. If volume diminishes significantly at this level, it could indicate that selling pressure is weakening, setting the stage for consolidation rather than further declines.
Pro Tips:
Grid Trading Strategy: Utilize grid trading to systematically capitalize on potential range-bound movement between clear support at $30 and resistance near $38.
Risk Management: Remain disciplined by setting clear stop-losses above the resistance or below support to protect against unexpected breakouts or breakdowns.
3. Breakout Rise (Bullish Scenario)
While considered less likely given current technical patterns, crypto markets often defy expectations. A bullish breakout above the immediate resistance levels at $37.2 and subsequently $39.7—particularly if accompanied by strong positive news or substantial trading volume—could signal another significant upward move.
Pro Tips:
Watch Resistance Levels: Stay alert for decisive breakouts above $37.2 and $39.7, validating the bullish scenario.
Confirmation Required: Only enter long positions if breakouts are confirmed by sustained volume and supportive fundamental news.
Conclusion
Hyperliquid (HYPE) currently stands at a crucial technical juncture, presenting multiple strategic opportunities for traders. Whether anticipating a bearish reversal, a consolidation phase, or a surprise bullish breakout, successful trading will depend on vigilance, technical confirmations, and disciplined risk management. Stay adaptable, carefully monitor key price levels, and remain informed about news and market developments to confidently navigate trading HYPE.
Tips:
Elevate Your Trading Game with Phemex. Experience unparalleled flexibility with features like multiple watchlists, basket orders, and real-time adjustments to strategy orders. Our USDT-based scaled orders give you precise control over your risk, while iceberg orders provide stealthy execution.
Disclaimer: This is NOT financial or investment advice. Please conduct your own research (DYOR). Phemex is not responsible, directly or indirectly, for any damage or loss incurred or claimed to be caused by or in association with the use of or reliance on any content, goods, or services mentioned in this article.

$HYPE - Short-term OutlookKUCOIN:HYPEUSDT | 4h
Price already retested the supply zone at $38
Local support is around $32, however, not sure if we'll get a bounce at this level.
If CRYPTOCAP:BTC sweeps the 100k-99k lows, KUCOIN:HYPEUSDT could revisit $30–27 range
Hyperliquid: Your Altcoin ChoiceLow volume lower low and high volume reversal candle.
Here we do not have six months of data but the chart looks pretty clear. It is simple to read.
I can spot two perfect 5-waves pattern, one going down and another one going up.
Going down is the second one, the correction, and the session that hit a new bottom ended up as a higher low based on the close. That is, the low in December 2024 is $10. The low 7-April is $9.3 but the close happened at $11.5. ($11.5 higher than $10 ).
This can be a bullish signal.
Today's candle trades higher than the 13-March low. A full green candle.
After going down, the market tends to reverse and go up. The action is bullish on the short-term and this is a short-term chart.
Hyperliquid is good as long as it trades above support.
"Support" is clearly depicted orange on the chart.
I used this chart setup to open a short-term based trade.
The main targets are 145% & 270% as shown on the chart.
Thank you for reading and for your continued support.
You are appreciated.
Namaste.

Check if it can hold the price above 26.37
Hello, traders.
If you "Follow", you can always get new information quickly.
Have a nice day today.
-------------------------------------
Hyperliquid token is a decentralized exchange token.
It forms the Hyperliquid Ecosystem.
To see if Hyperliquid can survive in the coin market in the future, we will have to see if the ecosystem expands.
---------------------------------------------
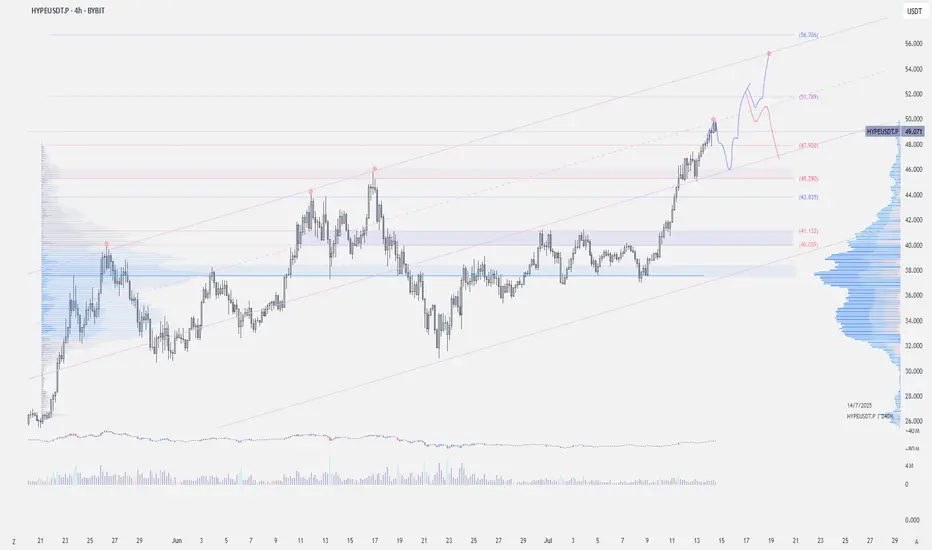
(HYPEUSDT 1D chart)
We need to see if the price can be maintained by rising above the Fibonacci ratio 1 (35.51).
If so, the next target range is expected to be around the Fibonacci ratio 1.618 (51.70).
-
The HA-High indicator on the 1D chart is formed at the 26.37 point.
Therefore, if it falls, we need to check if it is supported near the HA-High indicator on the 1D chart.
The current volume profile section is formed over the 19.59-23.19 section.
Therefore, if it falls to the maximum, it is expected that the 19.59-23.19 section will act as a strong support.
-
(30m chart)
Since the chart was created not long ago, it is difficult to analyze the chart over a long period of time.
Therefore, when trading these coins (tokens), it is recommended to trade mainly in short-term trading (day trading) or increase the number of coins (tokens) corresponding to the profit by increasing the number of coins (tokens).
-
The basic trading strategy is to buy when it receives support near the HA-Low indicator and sell when it meets the HA-High indicator.
However, if it is supported and rises near the HA-High indicator, there is a possibility of a stepwise upward trend, so you should think about how to proceed with a split transaction.
If it is resisted and falls near the HA-Low indicator, there is a possibility of a stepwise downward trend, so you should also think about a response plan for this.
-
In any case, you can see that it must rise above 33.89 to continue the upward trend.
Therefore, the key is whether it can rise with support near 33.17-33.89.
Currently, OBV > OBV EMA, so when it rises above the High Line, you should check whether it can maintain the price by rising above the 33.17-33.89 range.
-
Thank you for reading to the end.
I hope you have a successful transaction.
--------------------------------------------------
- This is an explanation of the big picture.
(3-year bull market, 1-year bear market pattern)
(3-year bull market, 1-year bear market pattern)
I will explain more details when the bear market starts.
------------------------------------------------------
