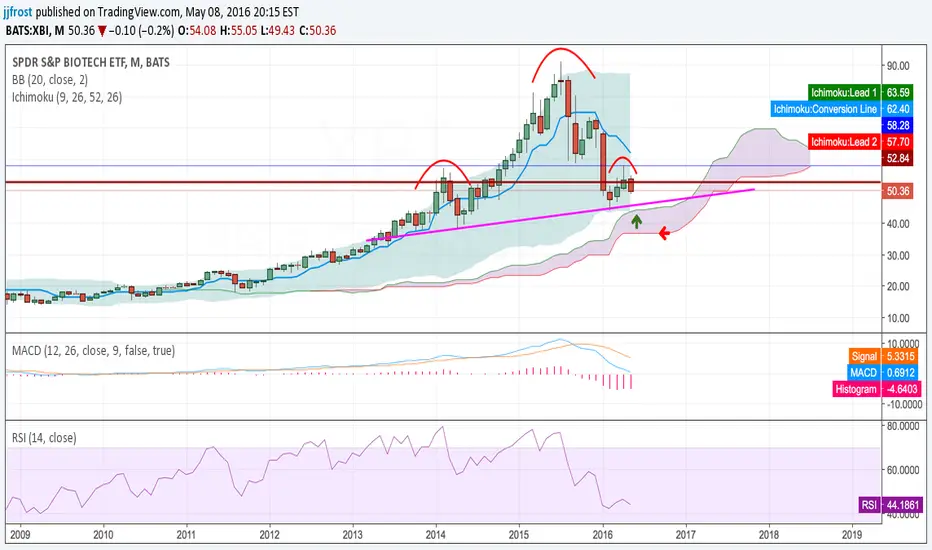
XBI remains bearish IMOThe gap may close to 57.30's but I'm expecting it to fall below mid 55's , where it should continue to drop IMO
IBB

IBB: Short IBB at market openIBB is potentially a giant weekly short. I'd like to go short at the open, or if we get a slight retrace, with stops at 257.58.
Target is as low as 207.70, at the ver least. You can see the previous weekly signal on chart to the left, it hit the target and even exceeded it after confirming the decline as per the 'Time at mode' method.
You may pick your preferred bearish strategy, feel free to comment too.
Check out my updated track record here: pastebin.com
If interested in my trading signals, or in personal tuition, contact me privately. I'm offering a considerable discount on a packaged course which includes access to my private trading signals list for a year.
Cheers!
Ivan Labrie
Link to Tim West's chatroom: tradingview.sweetlogin.com
We discuss setups like this often there. Feel free to stop by and subscribe to his indicator pack. If you have any questions ask.
Risk disclaimer: My analysis is provided as general market commentary and does not constitute investment advice. I will not accept liability for any loss or damage including, without limitation, to any loss of profit which may arise directly or indirectly from use of or reliance on such information.

XBI - At Very Critical PointXBI below every major MA except 100 SMA and this lies on an important point in the Kumo. IMO if this breaks and sell off starts, it could impact the entire market.


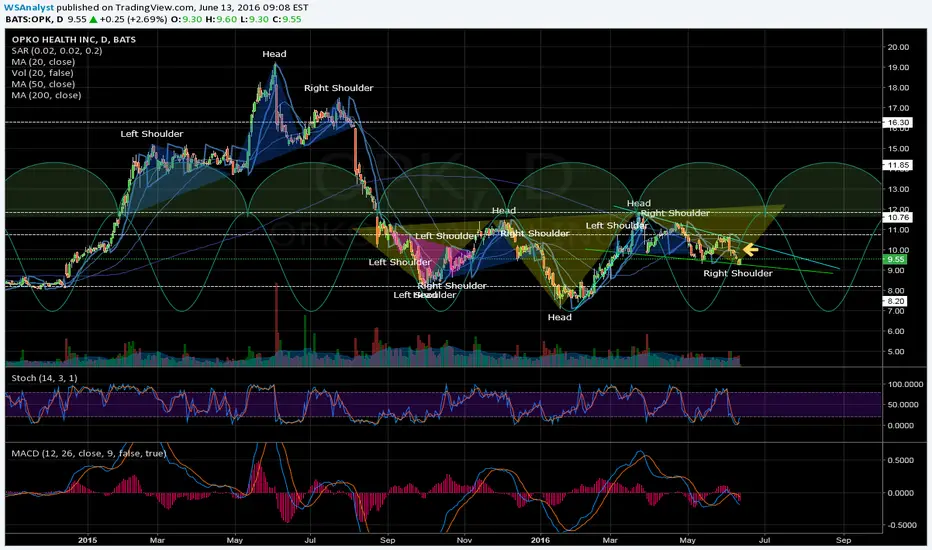
Hold itCreating symmetrical inverted H&S, which is a good thing. Needs to hold above low of left shoulder. Added at $8.91
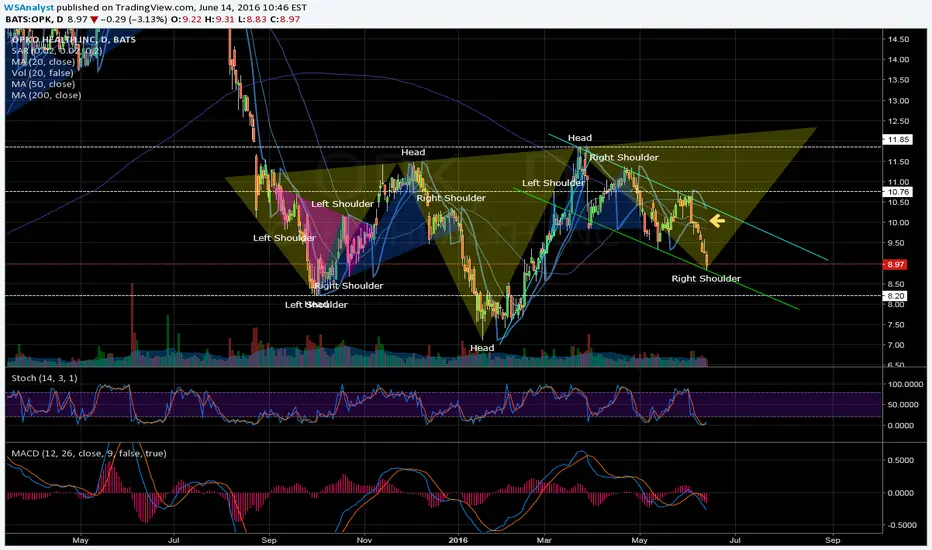
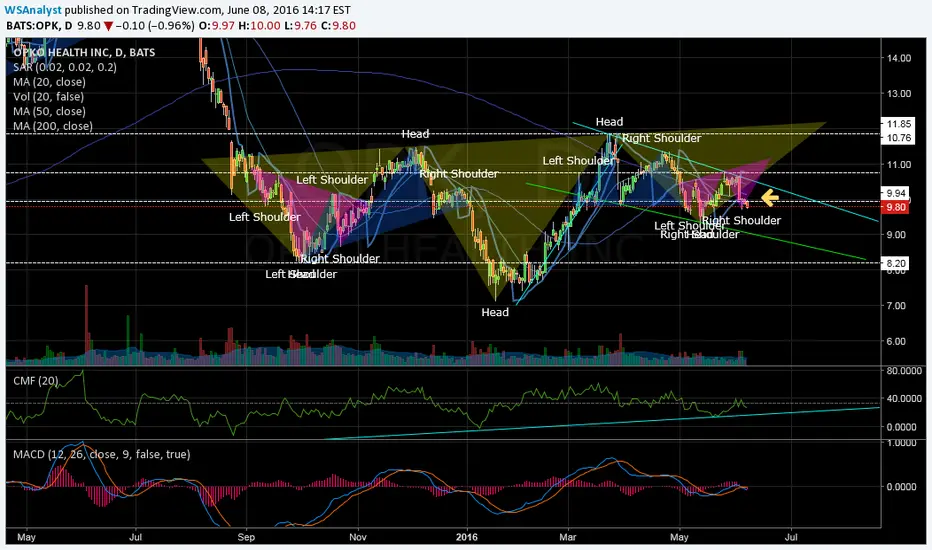
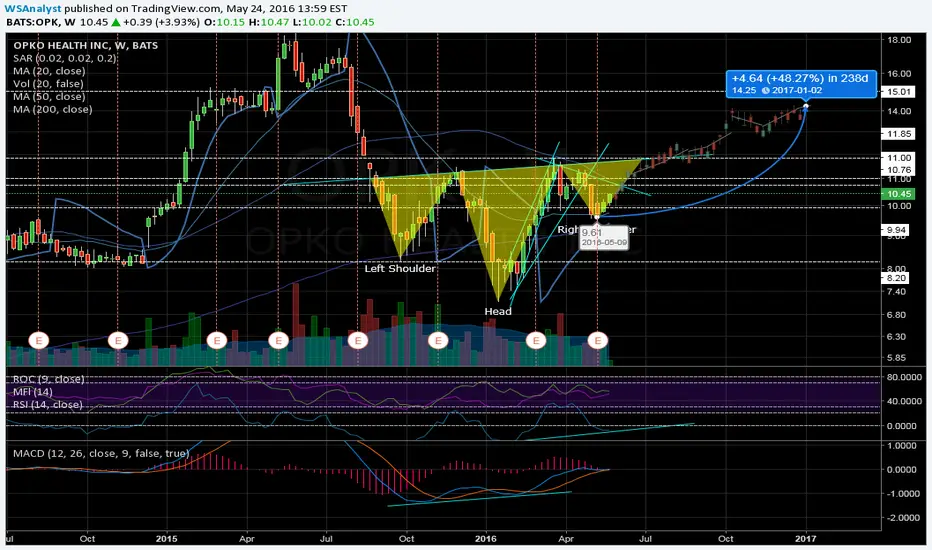
UpdatedUpdated Opko Health Chart. Still in inverted H&S. Looking to break out of falling wedge on right shoulder.
Weekly chart finding support a 50% retracementWe are seeing organized accumulation at the 50% retracement which mean the overall trend for IBB remains intact and bullish. Failure to hold the 50% threshold would suggest that prices could breakdown to $200. In the meantime demand is contracting on this smaller timeframe rally. This will likely result in a re-test and confirmation of this level following any potential break. If a re-test happens on light volume this is an ideal long entry. If the re-test is on greater than average selling volume watch out below.
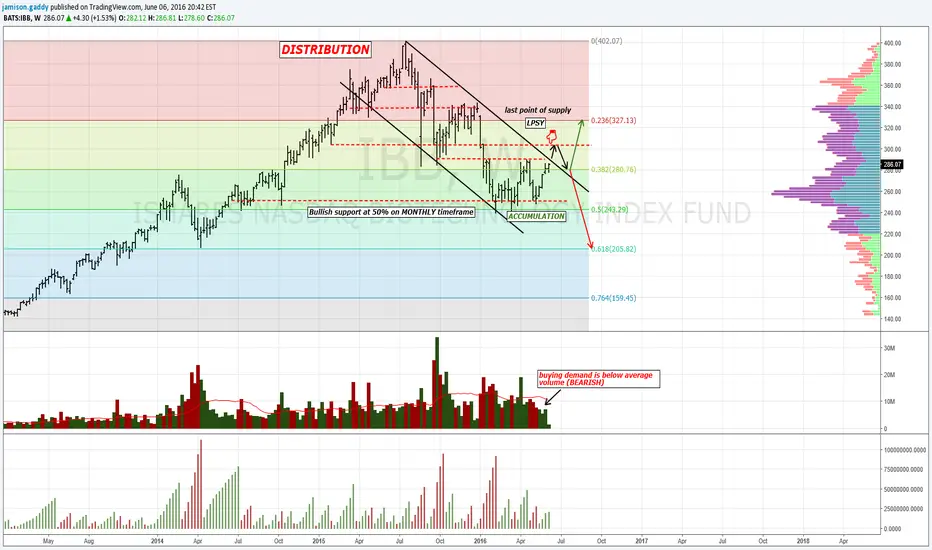
Showing signs of accumlation but has to close above $290Bullish above $290. Buyer of $270 as risk is well defined
IBB has been under accumulation for most of 2016. This is try because both the monthly and weekly vertical bar/candle stick charts are in distribution. In other words this smaller timeframe is in accumulation and upon testing $320 will likely encounter longer timeframe supply and continue to break down and test $240.
We can see selling volume contract on the re-test of lows followed by an increase in buying demand. Note; however, they buying volume is contracting into resistance of $290. It is reasonable to anticipate that prices will pullback and test $270 where I suspect strong hands will resume control and push price discovery higher.
Good Luck


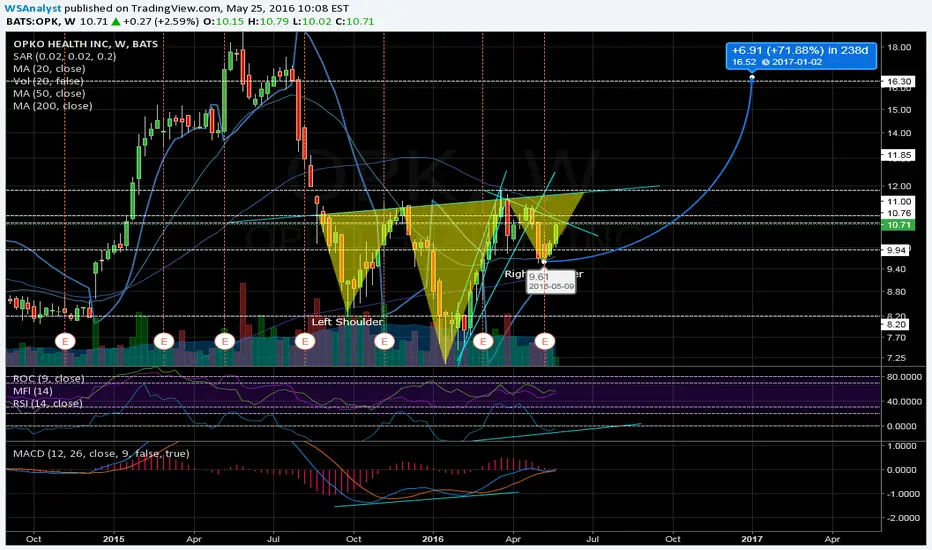
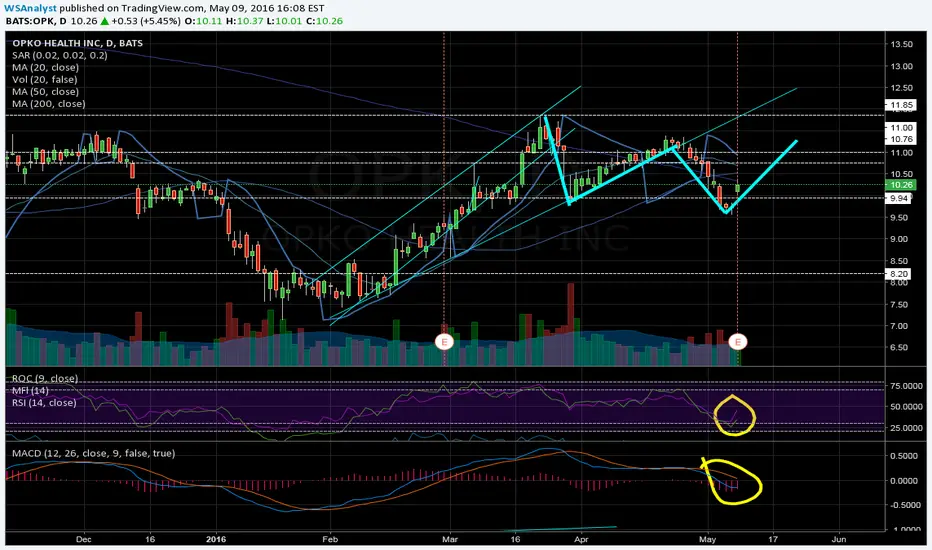
Ripe for BOBullish divergences in the MACD & MFI from Jan. Extended to Inverted H&S, buy point $12.17.
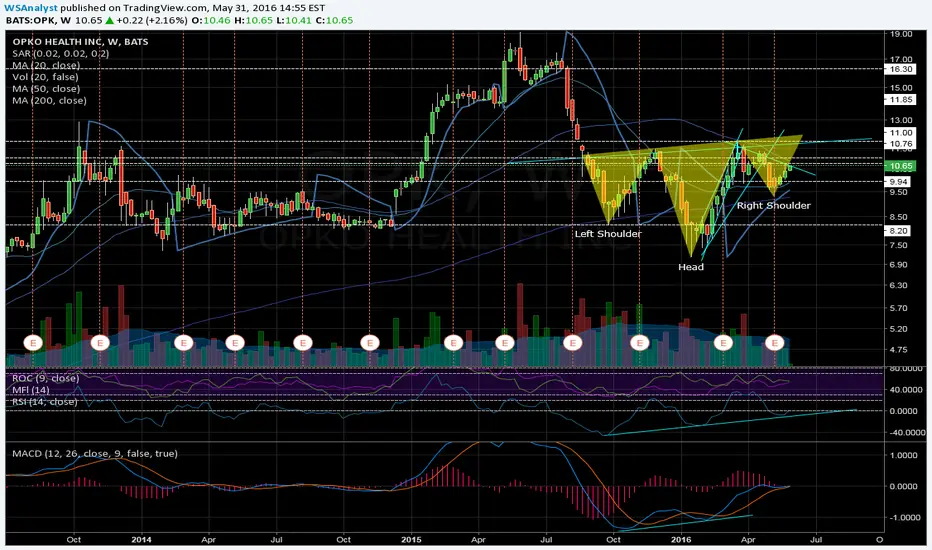
ContinuousStrong extension of inverted Head & Shoulders. Breakout over $11.85 will clear the neckline and commence through.

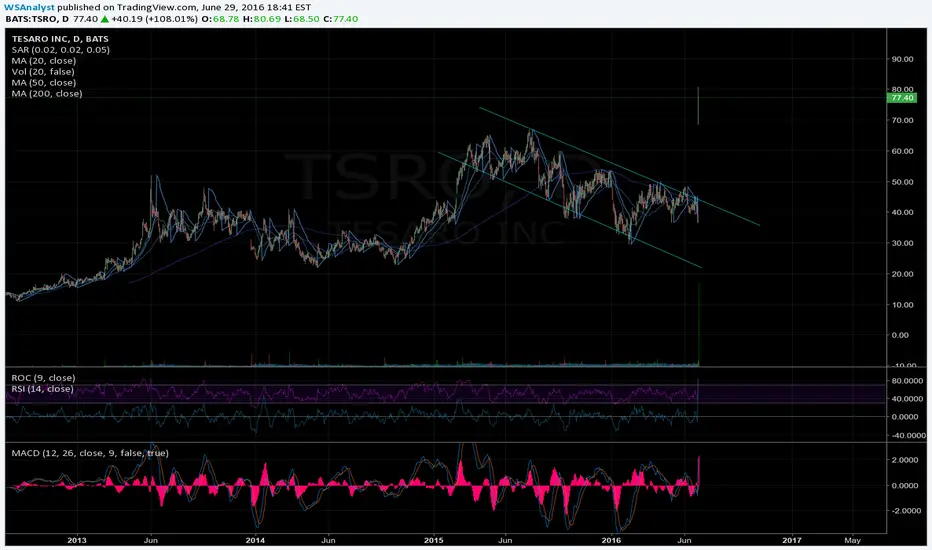
Reversal ConfirmedDouble Bottom, Oversold Condition, MACD turning up, beat Rev by+9% and EPS by +33%
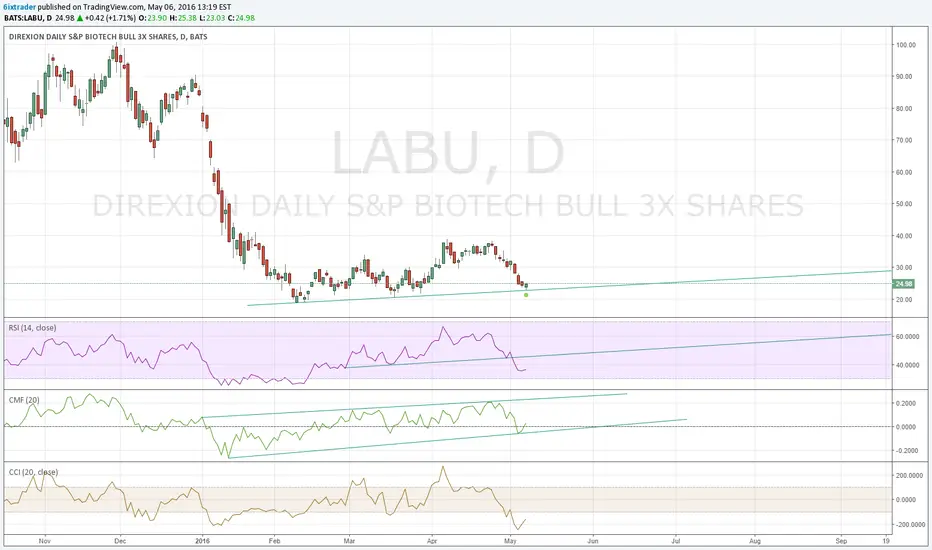
BIOTECH sector on situation!Either going to bounve, or brake nasty... I think it's going to bounce and then die. Look for neg divergences to short later...


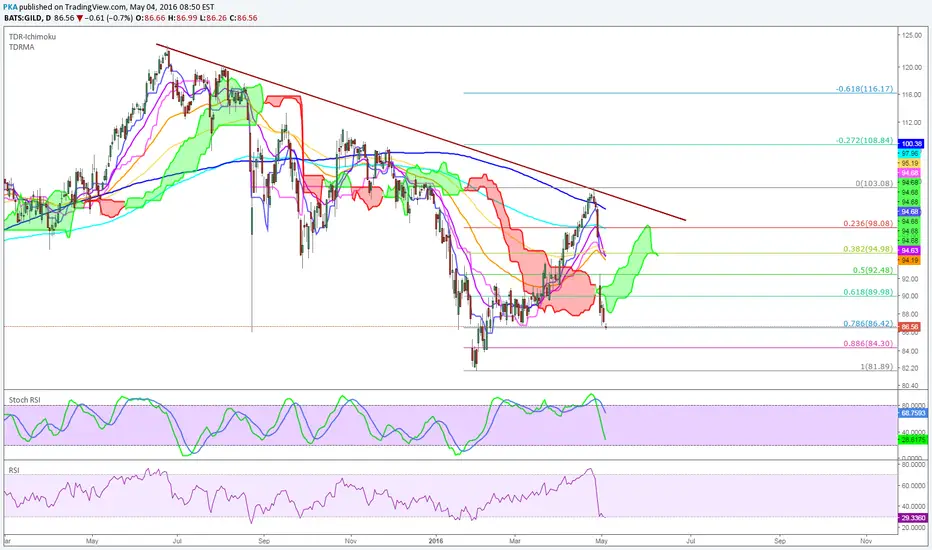
Signs of Life to $62Very strong Weekly MACD bullish crossover and RSI reversal at oversold conditions.