DXY Daily AnalysisDxy Trend is upward. we expcet it to reach higher levels.
consider all Support and resistance levels on the chart.
Ichimoku_trader

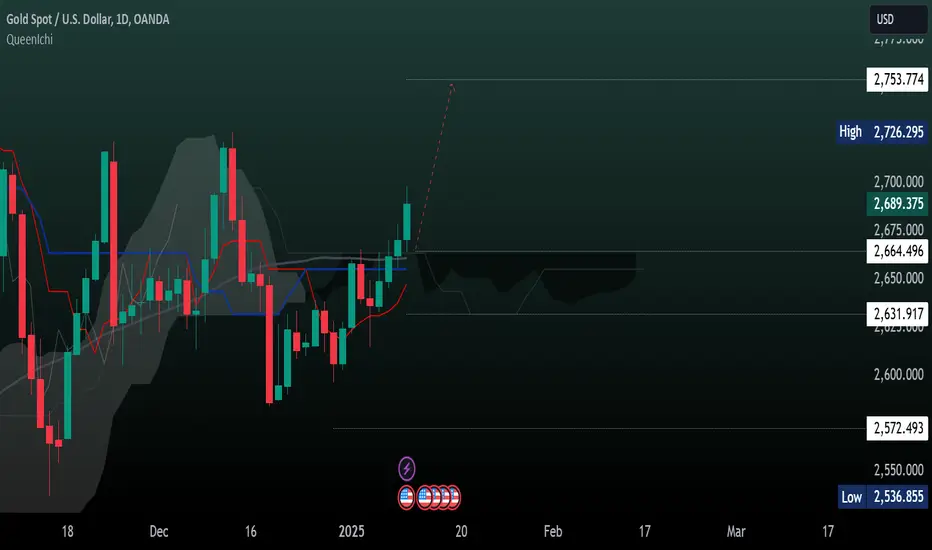
XAUUSD Daily AnalysisTrend is bullish ( based on ichimoku)
We expect upward movement till 2753 level.
Resistance levels which are important for us (2664, 2633 & 2572)
as usaual we trade on these level!
ALGO's expected movement!BINANCE:ALGOUSDT
ALGO is in a symmetrical Triangle which means we can't be sure of the coming movement. BUT! Ichimoku cloud shows a positive sign to us which means the price can increase to the top of the pattern easily👍
⚠️ Disclaimer:
This is not financial advice. Always manage your risks and trade responsibly.
👉 Follow me for daily updates,
💬 Comment and like to share your thoughts,
📌 And check the link in my bio for even more resources!
Let’s navigate the markets together—join the journey today! 💹✨

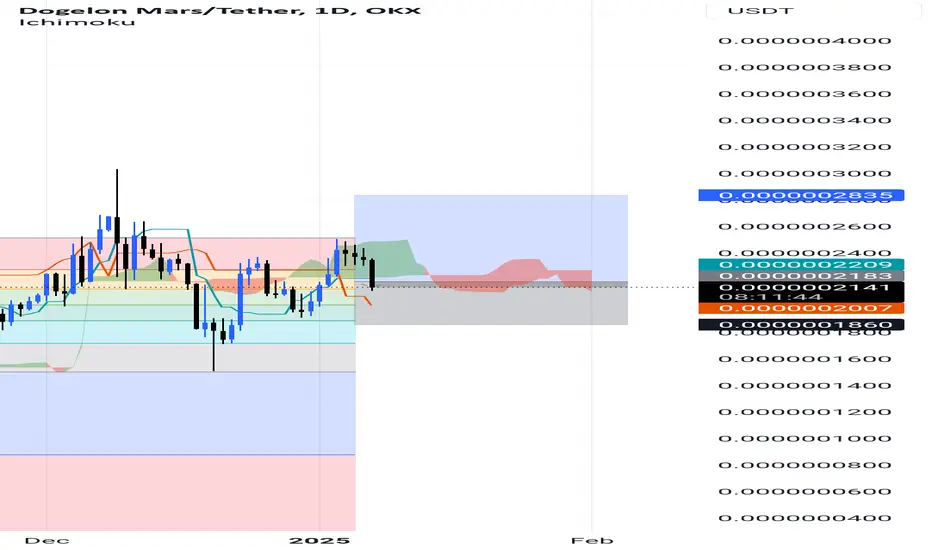
Elon can grow by 30%Hi
My name is Fazel
This is my idea
From the combination of Ichimoku and Fibo, you will understand my idea🛫
Thanks for watching me
DOG/USD Rebounds from Key Ichimoku SupportFollowing an all-time high of US$0.4671 in early December 2024, Dogecoin (DOG) had printed a correction versus the US dollar (USD) and rebounded from the Ichimoku Cloud Support area. This support zone was formed following the Ichimoku’s Leading Span A (light green at US$0.3576) crossing above the Leading Span B (light orange at US$0.2965) in the final full trading week of December.
Conversion Line Confirmation
While a rebound from the Ichimoku Cloud Support has been seen, and price action has ventured above the Ichimoku Conversion Line (blue at US$0.3511) and the Base Line (red at US$0.3640), both of which are considered bullish signals, traders will still likely be cautious entering long at current levels. This is due to a concentrated area of resistance around the record high mentioned above and may deter buying at this point.
Price Direction?
Traders exercising caution at current levels will likely monitor the Conversion and Base Lines on the DOG/USD chart. The Conversion Line crossing above the Base Line is often observed as a bullish cue to seek long opportunities, particularly after a rebound from the Ichimoku Cloud. As a result, should the Conversion Line cross above the Base Line, buyers may attempt to challenge all-time highs and possibly tackle their way into unchartered territory.

Potentially large move on gold inbound.Gold daily is showing price rejection right in the range of $2,666.90 which is an area of confluence of resistance, Icimoku cloud, and a triangle that price has formed. Looking left I can see that the current price is a high traffic zone with many daily candles opening and closing as well as a lot of indecision. Essentially, I can see price churning to the right until Friday, January 10th for NFP. Because the price is in such a zone that it is in right now, bullish or bearish news, I predict price will push to and passed the zones in green and will most likely move to the support and resistance that I has indicated with the arrows.

How to use Ichimoku cloud?The Ichimoku Cloud, also known as Ichimoku Kinko Hyo, is a versatile and comprehensive technical analysis tool that provides insights into trend direction, support and resistance levels, and momentum. Developed by Japanese journalist Goichi Hosoda in the late 1930s, it combines multiple indicators into a single chart, making it a favorite among traders worldwide.
What is the Ichimoku Cloud?
The Ichimoku Cloud consists of five lines that provide a detailed view of price action:
1. Tenkan-sen (Conversion Line):
- Represents short-term momentum and trend direction.
2. Kijun-sen (Base Line):
- Acts as a medium-term trend indicator and a potential support or resistance level.
3. Senkou Span A (Leading Span A):
- Forms one edge of the Ichimoku Cloud and provides dynamic support and resistance levels.
4. Senkou Span B (Leading Span B):
- Forms the other edge of the Cloud, offering additional support and resistance insights.
5. Chikou Span (Lagging Span):
- Formula: Current closing price plotted 26 periods back.
- Helps confirm trends by comparing current price levels with past movements.
The area between Senkou Span A and Senkou Span B is shaded to create the "Cloud" (Kumo), which plays a central role in analysis.
How to Use the Ichimoku Cloud
1. Trend Identification:
- Price Above the Cloud:Indicates an uptrend.
- Price Below the Cloud:Indicates a downtrend.
- Price Within the Cloud: Suggests a range-bound or uncertain market.
2. Support and Resistance:
- The Cloud acts as dynamic support in uptrends and resistance in downtrends. The thicker the Cloud, the stronger the level.
3. Crossovers:
- Bullish Crossover: Tenkan-sen crossing above Kijun-sen signals a potential uptrend.
- Bearish Crossover: Tenkan-sen crossing below Kijun-sen signals a potential downtrend.
4. Future Cloud Projection:
- A bullish Cloud (Senkou Span A above Senkou Span B) suggests continued upward momentum.
- A bearish Cloud (Senkou Span A below Senkou Span B) signals potential downward momentum.
5. Chikou Span Confirmation:
- If the Chikou Span is above the price from 26 periods ago, it confirms bullish momentum.
- If it’s below, it confirms bearish momentum.
Strengths of the Ichimoku Cloud
-All-in-One Indicator: Combines trend, momentum, and support/resistance in a single tool.
- Dynamic: Adapts to changing market conditions.
- Forward-Looking: Projects future levels through the Cloud.
Limitations of the Ichimoku Cloud
- Complexity: Can be intimidating for beginners due to the multiple components.
- Lagging Nature: Some elements, like the Kijun-sen and Chikou Span, rely on historical data.
- Less Effective in Choppy Markets: May produce false signals in sideways markets.
Best Practices for Using the Ichimoku Cloud
1. Combine with Other Indicators:
- Pair with RSI, MACD, or volume indicators for better confirmation.
2.Adapt Settings:
- The default settings (9, 26, 52) work well for many markets but can be adjusted to suit specific trading styles or timeframes.
3. Analyze Multiple Timeframes:
- Use higher timeframes for trend confirmation and lower timeframes for precise entries.
Example of the Ichimoku Cloud in Action
Imagine Ethereum (ETH) is trading at $3600 The price breaks above the Cloud, and Tenkan-sen crosses above Kijun-sen, signaling a bullish trend. The Chikou Span is above the price from 26 periods ago, confirming upward momentum. As ETH continues to rise, the Cloud projects higher support levels, guiding traders to hold their positions until bearish signals emerge.
Conclusion
The Ichimoku Cloud is a powerful tool that provides a holistic view of market trends, momentum, and key price levels. While it may seem complex initially, its comprehensive nature makes it invaluable for traders who invest time in mastering it. Practice using the Ichimoku Cloud on historical data and integrate it into your trading strategy for optimal results.
⚠️ Disclaimer:
This is not financial advice. Always manage your risks and trade responsibly.
👉 Follow me for daily updates,
💬 Comment and like to share your thoughts,
📌 And check the link in my bio for even more resources!
Let’s navigate the markets together—join the journey today! 💹✨

BTC Trend in 2025: (Based on Ichimoku)Based on my previous analysis from march 22, 2024 , the BTC trend is still bullish.
According to our medium-term analysis , it has hit our TPs and we see retracement nowadays.
Bitcoin will record new ATH(s):
113866
122524
137082.5
And important support levels:
87800
69000

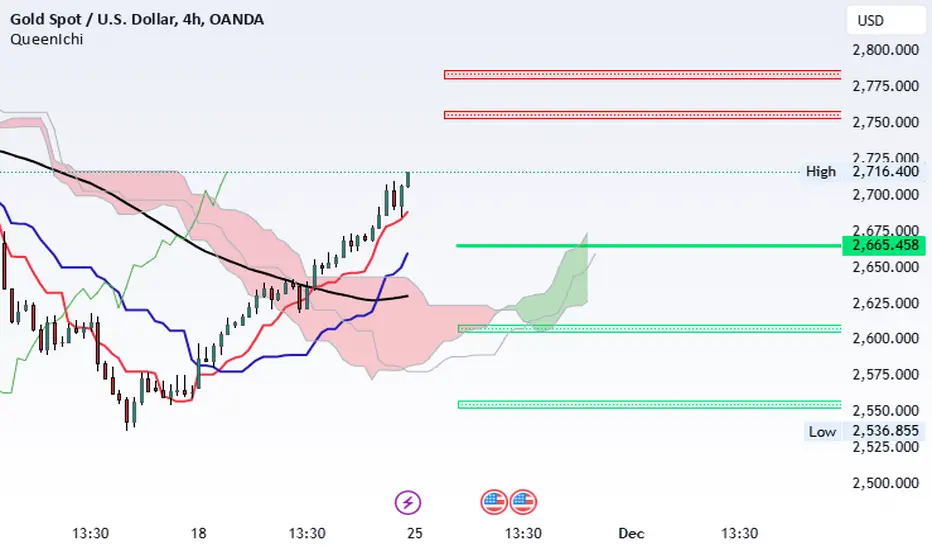
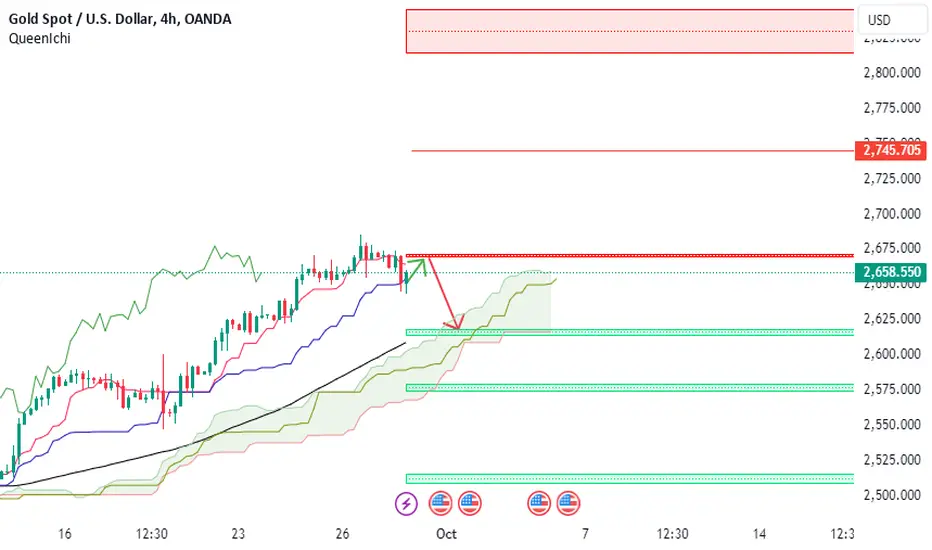
XAUUSD 4h AnalysisAccording to my previous analysis, based on Ichimoku, the gold trend is still bullish.
I see the possibility of a return to higher levels and a retest of the 2760 zone. If this level is broken, it can also reach the 2790 level.
If the price doesn't break through the resistance, we expect it to reach
2611-2640 price range.
We will check the ichimoku and data at these levels.
As usual we trade at all important levels. And you can follow the free signals in TG.
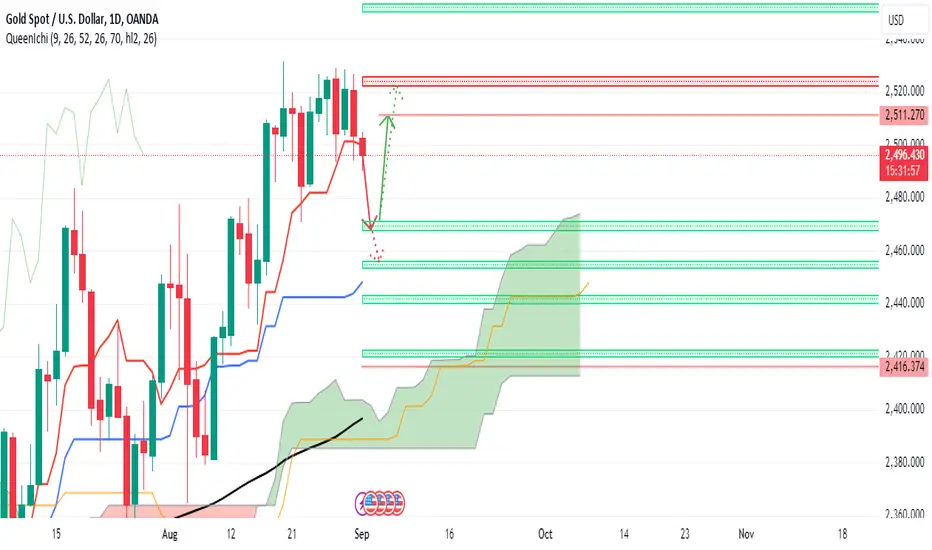
XAUUSD Daily AnalysisFor the up coming weeks, the Gold trend is generally bullish.
Ichimoku shows that the support level (2500) is very important and if gold breaks through the 2663 level, there is a possibility of growth towards 2753.
Our perspective toward gold is positive, unless there are major changes in the global economic situation
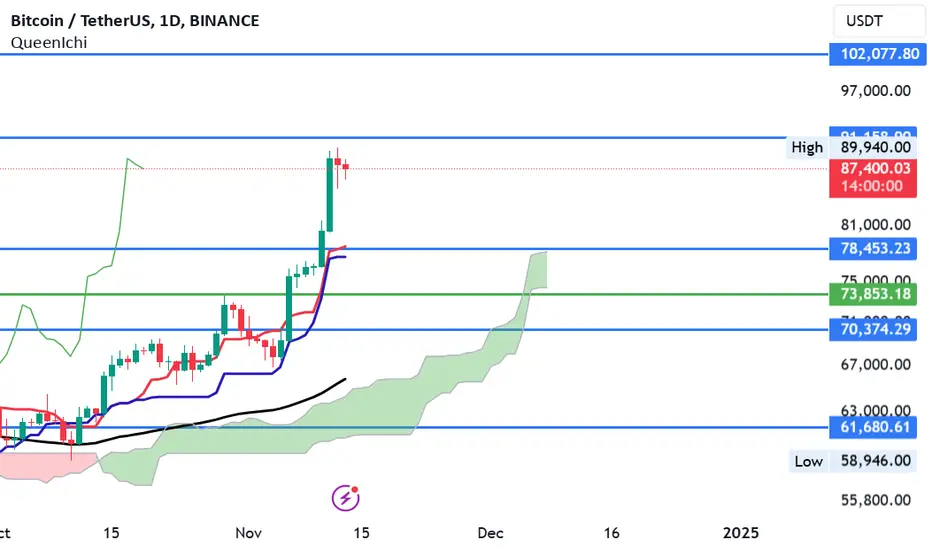
BTC Daily AnalysisAccording to our previous analysis (22,march), Bitcoin is still bullish. Our target at that time was 83680 which is touched.
Currently, based on Ichimoku, Bitcoin is still trending upwards.
We expect a reaction from the following resistance levels:
👉92000
👉102100
👉123000
and supporting zones below:
👉78453
👉 73853
👉70374
👉61680
As long as the price does not break this zone (73853), we consider the Bitcoin trend to be bullish.
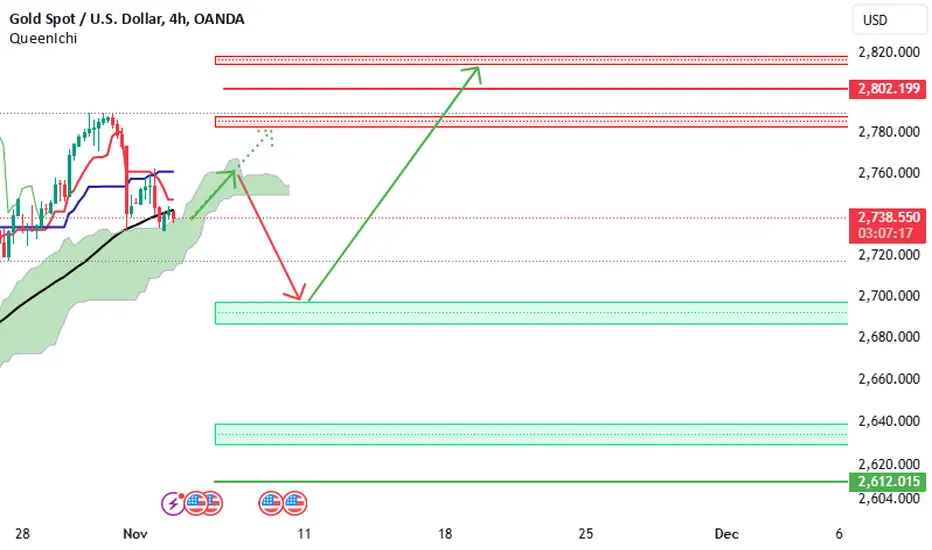
XAUUSD Daily AnalysisAccording to our previous analysis which showed the exact movement of Gold (based on ichimoku ), the trend of gold is still upward.
So we have correction on chart and expecting to move from the range of 2761 to the first support area ( 2698-2688 ) and then move to higher resistance zones ( 2783- 2788 ) and ( 2814-2819 ).
Note:
*If the 2761 range (4-hour kijensen) is broken, we expect our expected downward correction from the 2783-2788 range to the the support zones.
*if the support of 2698-2688 is broken, the next support zone is (2640-2629).
*We trade at all these levels with proper mm :)
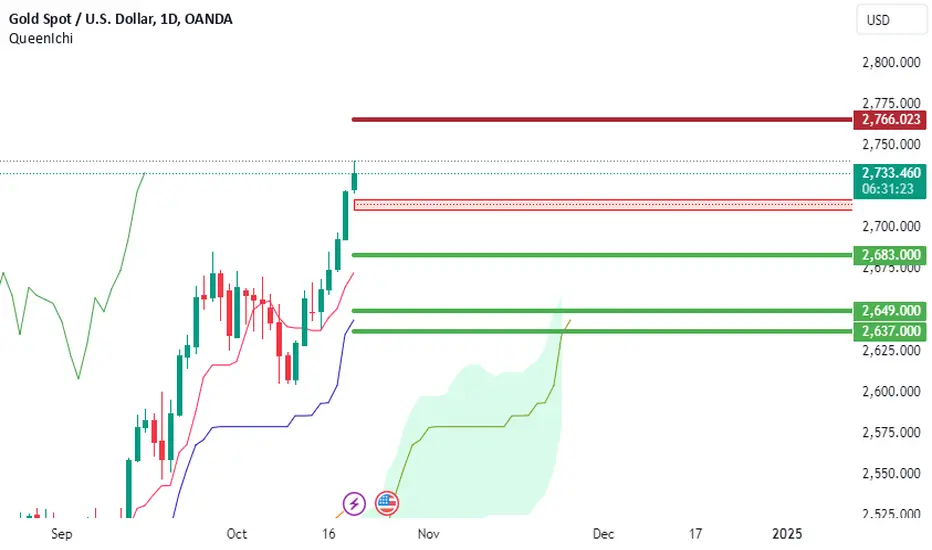
XAUUSD Daily AnalysisAccording to our last week analysis Gold was still bullish in the past week and breaks our resistance zone.
Based on our analysis ( Ichimoku ) gold is still in its upward movement and we expect deep retracement from 2766 zone.
Consider this support zone (2711-2717) and these levels : 2683, 2649 and 2637 as a definite target in future downward movement, so these are valuable levels to trade.
XAUUSD Daily AnalysisBased on our previous analysis, Xauusd is still moves in its long term uptrend.
This week we expect retracement of xauusd. If the price doesn't break its resistance zone of 2671, we will see the downward movement to these zones (2616-2577) and again upward movement to 2745 and 2815.
This week be careful about geopolitical news!
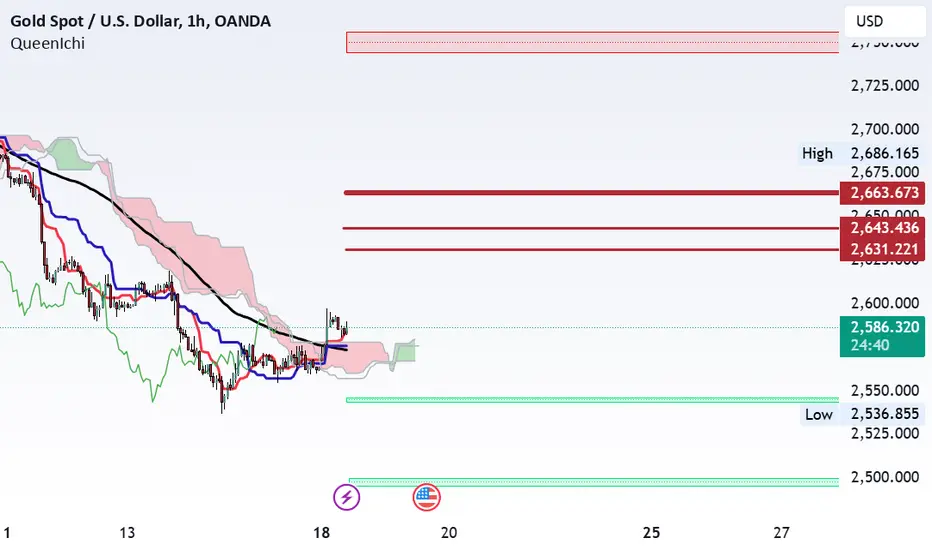
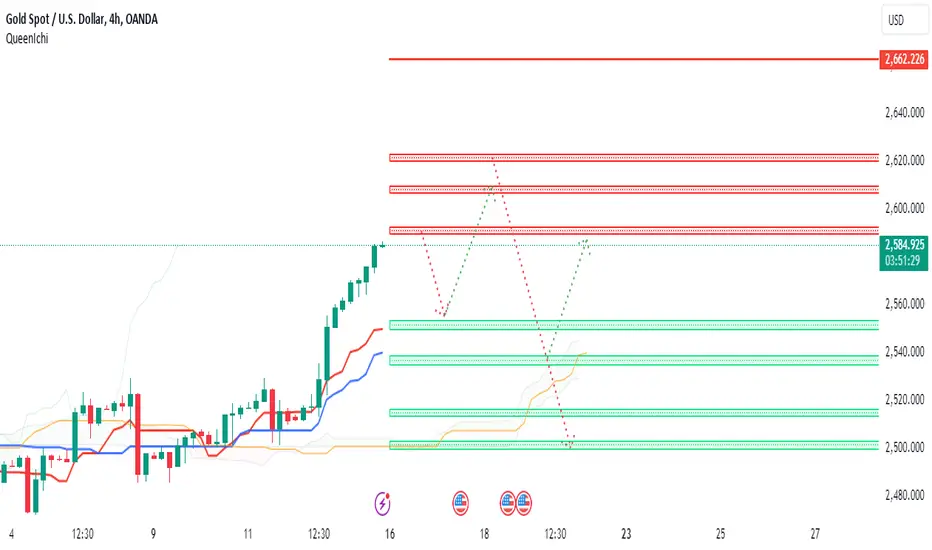
XAUUSD Daily Analysis (4H time frame)We expected gold to rise to 2563 and it happened, gold broke above this range. We saw the trend of gold as bullish generally, and now it is at 2585 levels.
it looks like gold is going to reach these zones 2593, 2608 and 2621, we expect small correction from this 2593 but deep retracement from 2608.
And it should be said that according to Ichimoku, the trend of gold in the long term is still upward.
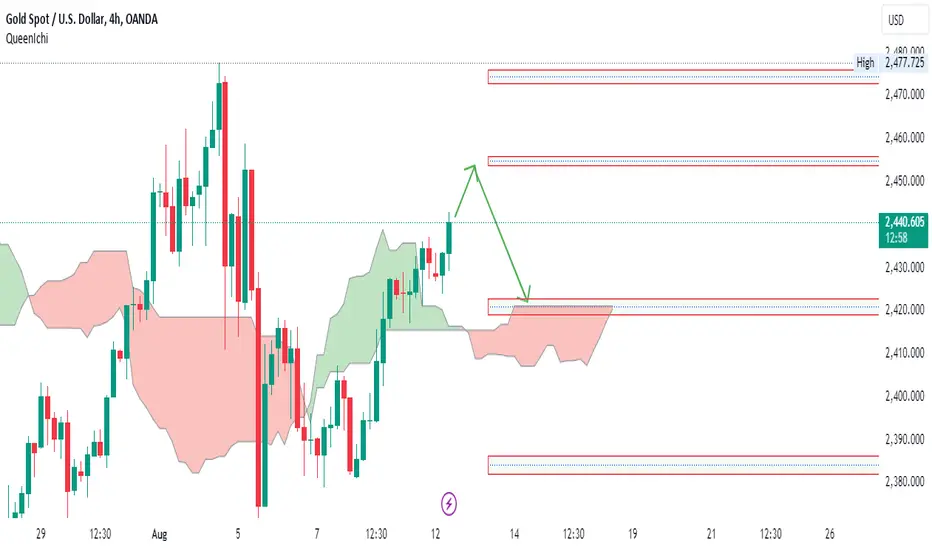
XAUUSD 4H AnalysisWe expect Xauusd to reach the support zones of 2468 and 2455, which are its trading targets and (if this ranges are broken, it will touch its third target in the range of 2421-2416.)
After that, it continues upward movement to resistance zones of 2524-2511.
There are a lot of excellent trading opportunities in all these supports and resistances.
After breaking these levels, chart will be analyzed and updated.
Ichimoku Watch: Salesforce Poised to Breakout Higher?Upcoming Earnings
Salesforce, Inc. (ticker: CRM) is scheduled to report earnings after the market closes on 28 August. The consensus earnings per share (EPS) estimate for the fiscal quarter ending July 2024 is $1.73. The reported EPS for the same quarter a year prior was $1.63.
Vulnerable Resistance?
Resistance is currently being tested at US$263.42 but shows signs of giving way.
While a head-and-shoulders top pattern was recently completed at the underside of the aforementioned resistance (this is more visible on the H1 chart), which could see short-term shorts enter the market and aim at the pattern’s profit objective of around US$253.63, sellers have been unwilling to demonstrate much commitment at resistance in recent trading.
Ichimoku Support
You can see price action closed above the Ichimoku Indicator’s Conversion Line (blue at US$260.27) as well as the Base Line (red at US$260.19), and the Ichimoku Cloud is seen nearby. This comprises the Leading Span B (light orange at US$251.40) and the Leading Span A (light green at US$260.33). As a result, the stock has sufficient support to withstand selling. Should a breakout to the upside occur, this could trigger breakout buy-stops and power a move towards the next layer of resistance coming in at US$279.28.
Price Direction
Although sellers may enter the market from current resistance, the nearby Ichimoku support and the lack of bearishness could eventually stir up a bullish move to target fresh resistance at US$279.28.

XAUUSD Weekly Analysis (Daily Timeframe)let's walk through our thoughts process. we expect gold to reaches to resistance zone (2551-2563) and after that continues its movement downward to the support zones (2098-2080) and (2062-2043). consider these zones for your long term analysis and trades.

XAUUSDThere are two support levels
2420
2385
and we see two important resistance levels:
2477
2454
what we expect is a reaction of price to the level of 2454 and a downward movement to the level of 2420.
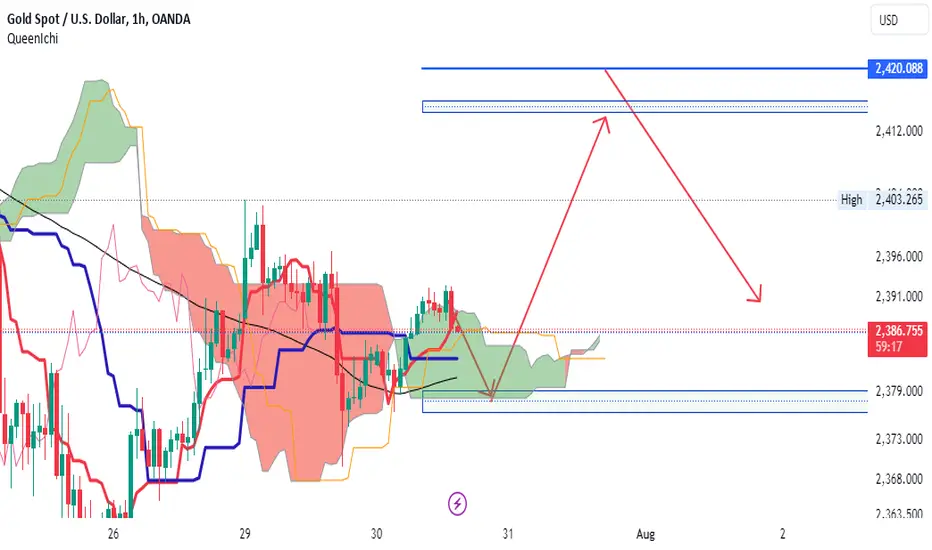
Xauusd Daily Analysis (4H time frame)Xauusd is in its range zone. We expect it to touch support zone (2382-2377) and then move up to upper zone and after touching the range of 2415, it will fall.
After these two movement, we will analyze the next moves.
Ichimoku Watch: Mastercard Testing Ichimoku ResistanceUpcoming Earnings
Mastercard Incorporated (ticker: MA) is scheduled to report earnings before the market opens on 31 July. The consensus Earnings Per Share (EPS) estimate for the fiscal quarter ending June 2024 is $3.51. The reported EPS for the same quarter a year prior was $2.89.
Active Downtrend
Basic trend studies demonstrate that the stock has been gradually trending lower since forming an all-time high of $490.00 in late March of this year. Price action has been working between two parallel downward lines that make up a descending channel (from $468.15 and $436.90).
What is interesting is that the stock recently bounced from the lower side of the descending channel, with the pullback testing the Ichimoku Conversion Line (blue at $442.15). Also, having the Base Line circling just above this line (red at $445.97) offers traders a resistance area to consider bearish scenarios in line with the downtrend.
Also situated near the Conversion Line and Base Line resistance zone is the Ichimoku Cloud between the Leading Span A (light green at $444.06) and the Leading Span B (light orange at $446.90).
Price Direction?
Today’s analysis reveals that Mastercard is demonstrating a bearish stance ahead of earnings tomorrow. The pullback from the lower channel support edge, therefore, may be viewed as a sell-on-rally signal, particularly at the underside of the Conversion Line/Base Line resistance area and the neighbouring Ichimoku Cloud.

1INCH 🦄 Ichimoku Weekly Breakout! | Profits PlanHey guys!
Analyzing past movements, we can see price used to move inside a downwards channel until it broke out from it. But not only that, it broke out and pierced through the Ichimoku Cloud in the weekly timeframe which is huge!
So here's some plan:
1) Condition: -price must breakout from 0.58 towards the upside. After that, it should re-test the zone to give a chance to get into a trade. (DONE)
2) We can set targets 0.90 - 1 dollar mark
3) If price closes above 1.10 we can expect a move towards the following target zone: 1.60 - 1.90
4) For the bears scenario (we must include it even if we feel might not happen at all) Price could fall back into the range and give an awesome opportunity to buy lower even. And a realistic price would be around 0.27 but BEST optimal would be at around 0.20
Let's see how it plays out!
Kina Tip of the Day : My ideas and trades are all for SPOT modality. I don't recommend futures trading unless you really know what you're doing and you're up to get glued into the charts. If you want to live your life and still make money then relax, sit back, analyze and create your own strategy that could be based from another teacher but you must feel connected to it otherwise it won't work in the long run, no matter what you do. So, never give up and keep fighting for independence.
Keep it Shiny! ✨
Kina, The Girly Trader

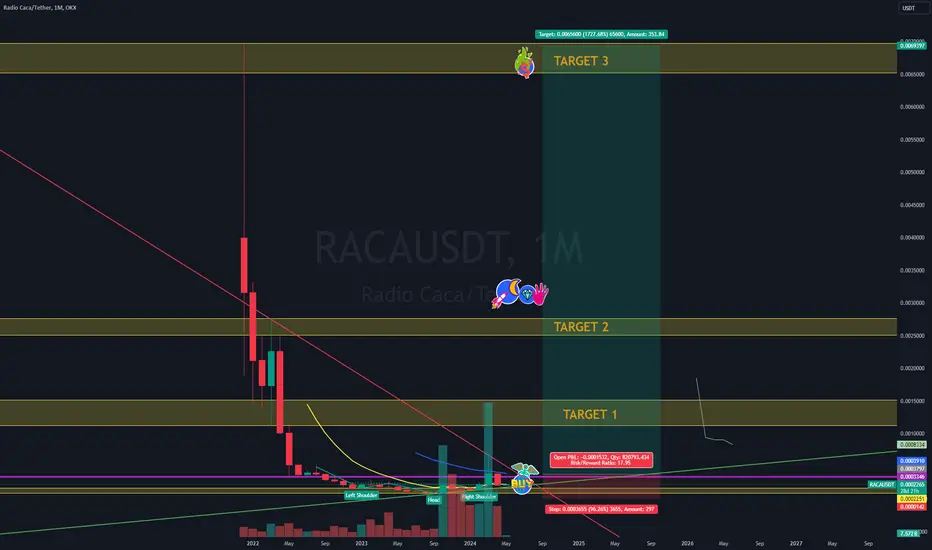
RACAUSDT 🚀 Inverse Head ShouldersHey guys!
Today I'd like to share a RACA Coin idea. I've spotted an inverse head and shoulders pattern that has formed after a solid downtrend. Confirmation to the bullish upside would be a breakout and re-test of the descending triangle line marked in red and followed by entry trigger dropping into the lower timeframes such as Daily TF.
Confluences:
We need the breakout of the pattern to the upside to confirm bullish reversal. But having this pattern itself after a huge drop, it's pretty awesome!
We've got Ichimoku Cloud breakout on the Weekly TF which signals bulls are taking over still make sure you have a plan to be certain with your confirmations.
Targets are marked in the chart with text:
1) 0.0015
2) 0.0025
3) 0.0070
Stop loss below the cloud or 2 ATR or below swing low. Manage that according to your trading plan and take profits partially as you go hitting the targets.
Let's see how it plays out!
Kina 🚀