BTCUSD Daily - Ichimoku AnalysisViewing the bear periods and emergence of red ichimoku following these bear periods
The red emergence is evident along each vertical dashed line
All recoveries lead to further ATH's
Ichimoku_trader

Possible 5% drop on Gold Possible 5% drop on Gold from $1775 to $1687.
After reaching top of the channel today 1st of December we might experience a fall for another 7-9days to retest 1700 and most likely 1687 mark.
High possibility doesn't mean 100% certainty so this is not a trade advice.
Happy trading everyone.

GRND IPO POP then DROPOn the 15-minute time frame, the price action is decidedly bearish
over the past couple of days. Gauss filters downward.
The Ichimoku resistance against a reversal is thick.
Price has dropped more than 15% each day.
The RSI indicator shows dismal strength and no signs of divergense
to herald a reversal. I am in this as a short seup and
have profited well taking a partial each day. Option plays
are not available. Once the bear trend burns out, this will be
worth looking at for a slow uptrend. So once the relative strength
drops to below 25% or some bottoming wicks and Doji candles
appear on the lower time frames, I will look to take the profits
and trade the uptrend. ( this may bounce up from the POC of
the volume profile as a reaction to support. )
PLAY the VOLATILITY !

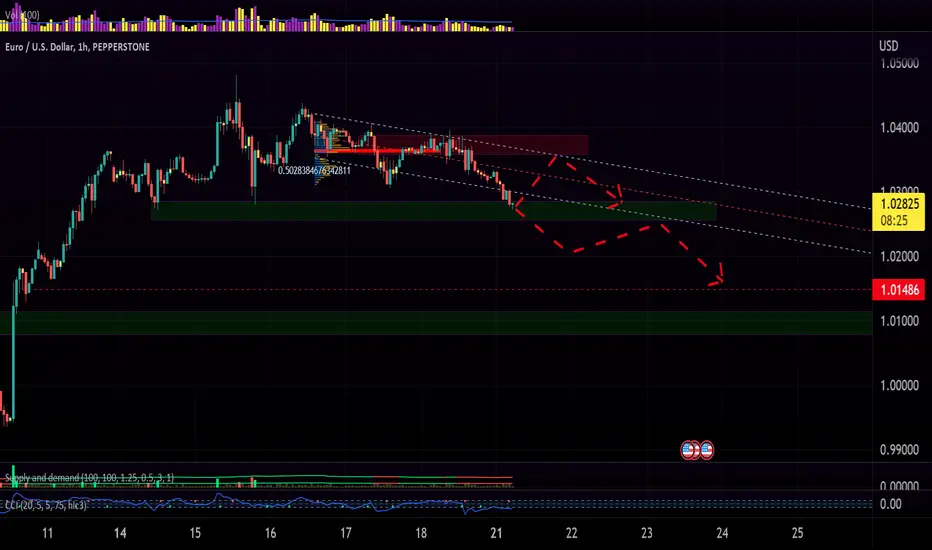
EURUSD: I'm looking for short trades today.EURUSD regarding the Long-term factors is still bearish and it's around a good discount!
Considering mid-term factors we are still bullish but a powerful bearish momentum could be observed.
In shorter term a bearish channel is formed and the linear regression channel is almost perfect. Short the pair around the red zone or in reverse to green zone after breaking the zone down.
NOTE: Consider German CPI news and don't trade against news in the early hours after announcement.
Cancel the trade if you see a big surprise in CPI today.
NiftyHello and welcome to this analysis
Nifty today activated not one but two bearish reversal signals.
First it activated a Bearish Harmonic Alt Shark (double confirmation if price sustains below 18350) for suggested downside levels of 17750/17250. This pattern would be considered negated above 18575.
Second it coincided with an Ichimoku Price and Time axis equilibrium date - (double confirmation if price sustains below 18360. The reversal as per Ichimoku will become invalid if a daily candle close occurs above 18450. Downside targets for Ichimoku are also similar to Harmonic ones.
Use the dips / correction to add stocks, corrections are healthy and a good opportunity to invest in growth stocks.
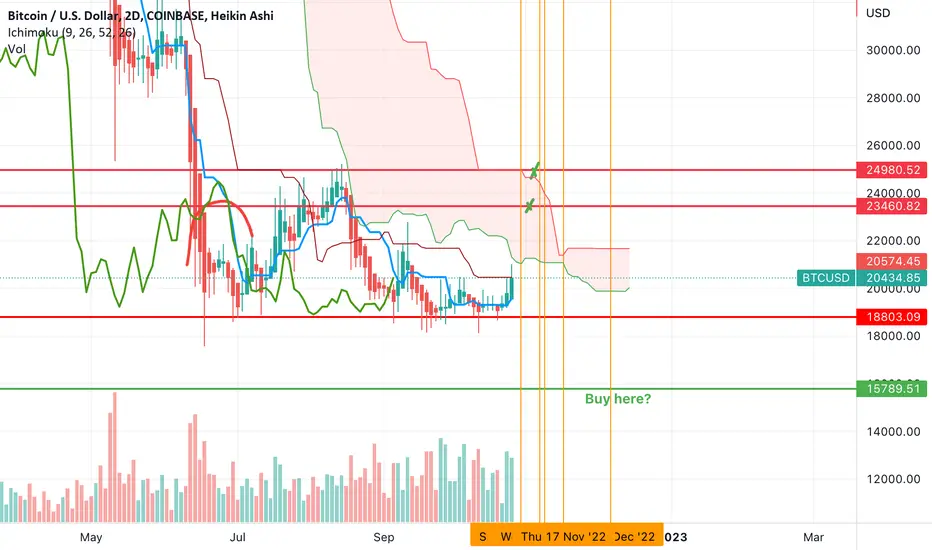
$BTC to $23-25k, then $15.8k? The ultimate bull trap?Alright, as many of you've seen, I've updated my previous chart in the comments and have become short term bullish. I do think that BTC heads higher in the next few weeks tagging the $23.5k mark or $25k mark. I was originally thinking that this would make the short term bottom of this move down, but now I'm questioning that thesis and I think that this is the more likely scenario that will play out... Let me explain.
Something never looked right to me when analyzing the Ichimoku cloud. Why is it trending down on the 2D chart? Also, if you analyze it from a 3D chart, the cloud is too thick with resistance to break through. So that leads me to believe we're not ready for the breakout higher yet.
From all of the charts I've seen people post, most people think we're going to $21k than instantly reversing lower. Then the other camp thinks that $23.5k is the line in the sand, and that if we break that, we've started a new bullish trend. This all leads me to believe that the most likely outcome is that we break both resistances and hit $25k, and only after we don't break that, we reverse lower. I think that would lure the most people into the market. I think most people at that point would think to buy the dip (because again, the new bull trend is starting). However, I think rejecting $25k, would just form a double top from the move back in August and setup a move lower (where we finally break the lows).
I think if this all plays out, and we can't surpass $25k to form a new high, it sets up the move down that I was expecting to around $15.8k. I think the move up plays out before the middle of November and I think the move down would play out towards the back half of November bottoming sometime in early to mid December. I've added pivot points to look for changes in price action.
Only after this plays out, would I expect a large bear market rally (one that takes us back up to the $30k region).
I am long BTC and a lot of alts at the moment (because I'm expecting 50-100% exit pumps before we head lower). On any significant moves higher, I'll be locking in profits because I don't want to risk staying in the market if this plays out like I'm expecting.
Good luck. Let's see how it all plays out over the coming 4-8 weeks.
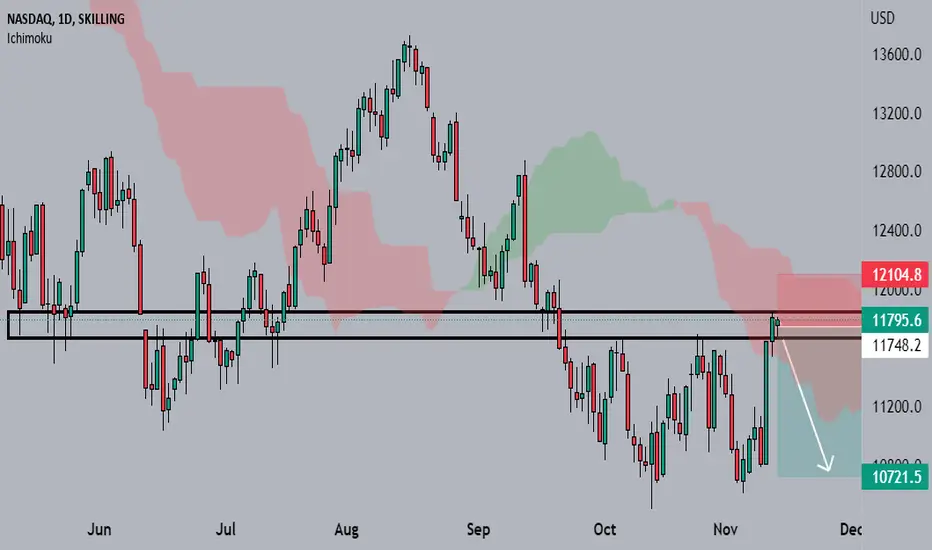
NASDAQ Hit ResistanceAfter extremely negative week for USD we have witnessed a spike of more than 1000 points for Nasdaq. Right now the asset reached the resistance and is ready to fall. We go with risk reward 1:3
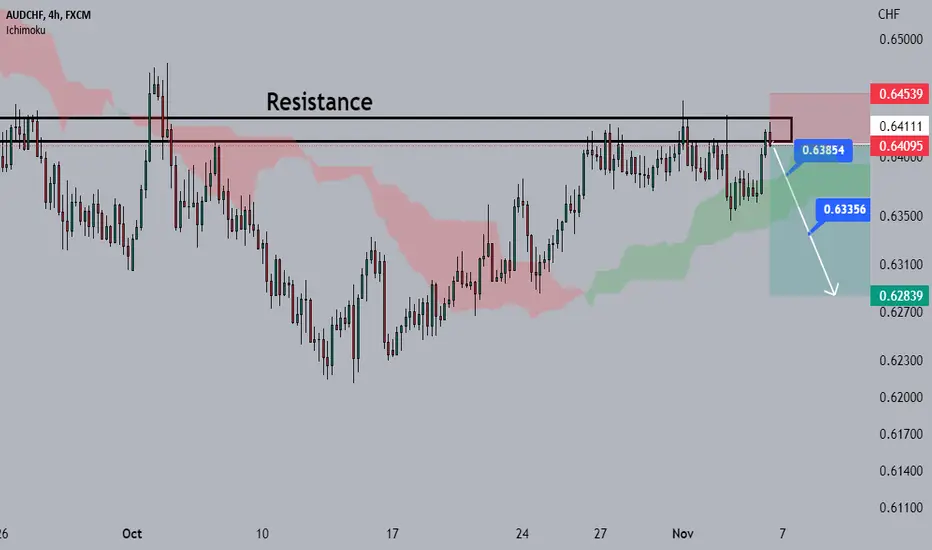
AUDCHF Reached ResistanceThe pair reached the resistance and is ready for the decline with multiple targets: 0.6385 / 0.6335 / 0.6283 with risk reward 1:3. Good luck to all
RAY - Short Term BreakoutRay has broken out the descending trendline with strong volume on the 1H timeframe and its trading in bullish pattern vs ichimoku cloud.
Possible long set-up here:
BUY CMP and $0.26
TP: $0.299-0.315-0.33-0.352
SL: $0.25
Use low balance

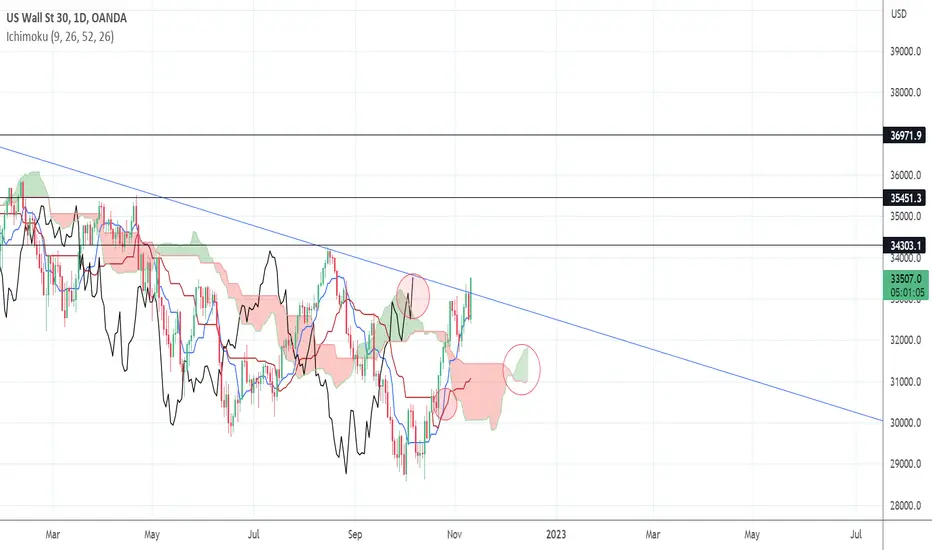
us30 bull move evening traders. Trading has been choppy recently with these current markets but is the us30 heading for a bull rally? We have 3 signals in the ichimoku trading strategy triggered, base line and conversion line crossover, green cloud and lagging span above the cloud. Price has also broken the downward trend line and if we close above then we could be seeing a bull rally. Rally targets we would be looking at I would say are 34300 and 35500.
We're still below the cloud on the weekly so it could be a false break and a trap, its hard to dictate in these market conditions.
Trade safe traders.
cheers
shaun.
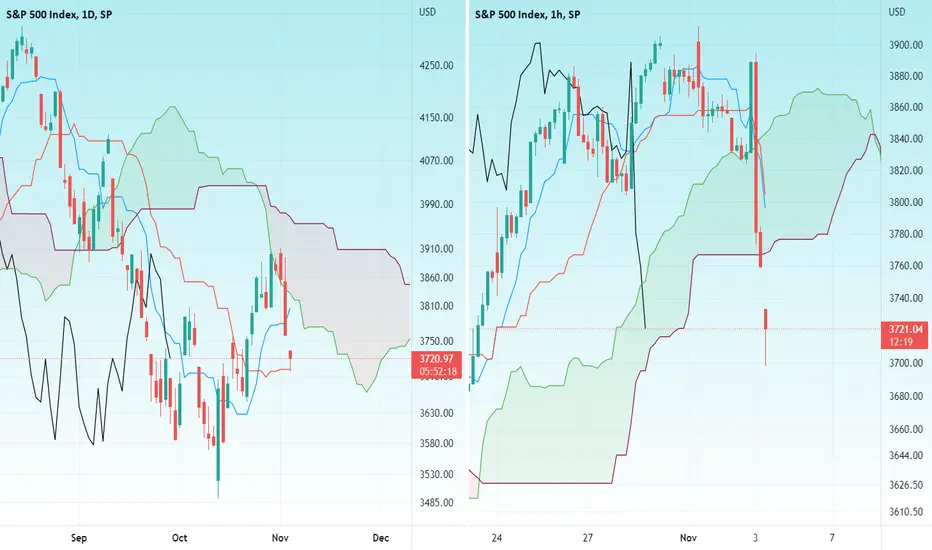
S&PHello and Welcome to this analysis
Post FED rate hike last night, S&P declined sharply and is now near a strong support in daily and hourly time frame.
This level of 3675-2725 could work as a good support for now.
Bounce for 3800-3850 or reversal till 4000-4050 likely if held
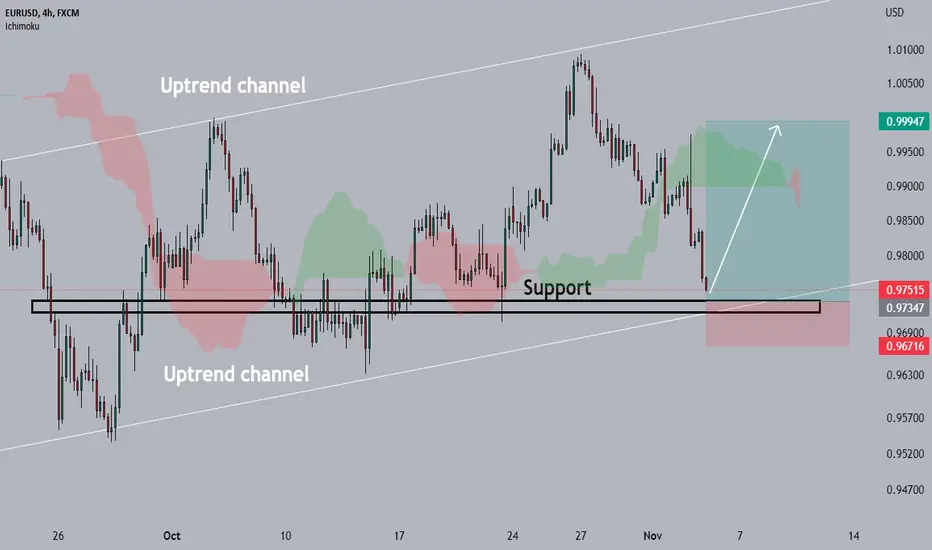
EURUSD Time to buy?We can see 6 consecutive bearish days of the pair in a total of 330 pips downtrend. But watching a bigger picture we can see the pair right now is in an uptrend and is located on the support level and is ready for the pivot point. We go with risk reward 1:4, good luck to all of you. Don't forget to help others and share it with them.
US Dollar Index HIT SupportNFP was extremely positive, but unfortunately, the market react the other way around. With the US Market opening, I expect the NFP data react positively to USDX.
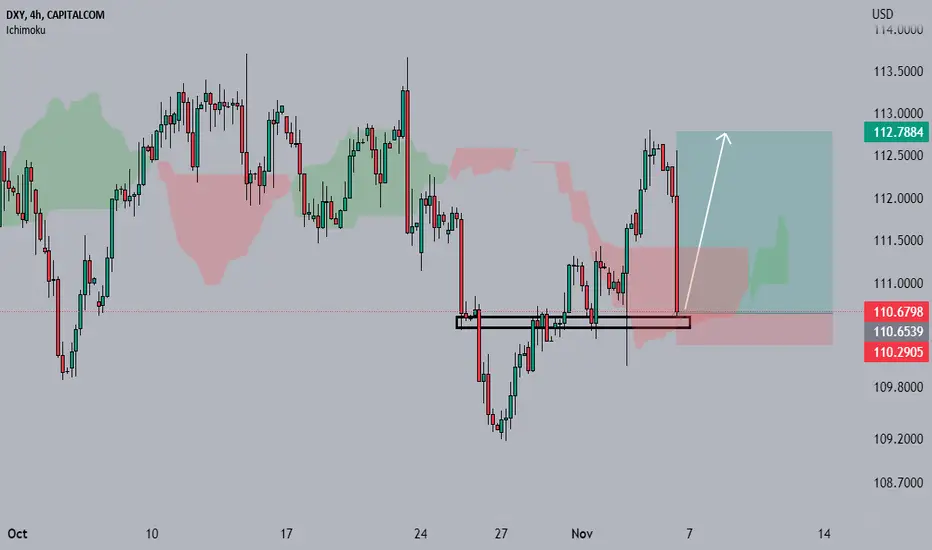
Breakout of US Dollar Index We can see a breakout of the resistance (Fibonacci level) Upcoming downtrend for US Indices & Gold is loading

Dow Jones - Time to sell ?Dow Jones (US30) reached the resistance and is ready to go down. We will go with Risk Reward - 1:6.
Based on my latest US Dollar Index analysis which is ready with the breakout and is waiting to go long.

BANK NIFTYHello and welcome to this analysis
Bank Nifty has activated a Bearish Harmonic Bat in daily time frame.
The anticipated retracement levels are 38-50-62% of the upmove. The view would be negated if it sustains above 41530.
As per Ichimoku Time and Wave Theory also we have a turn date activated. Until it sustains below 41530 it would remain weak. In case it breaks on the upside then the low of Friday October 28 would be considered as a stop loss for longs

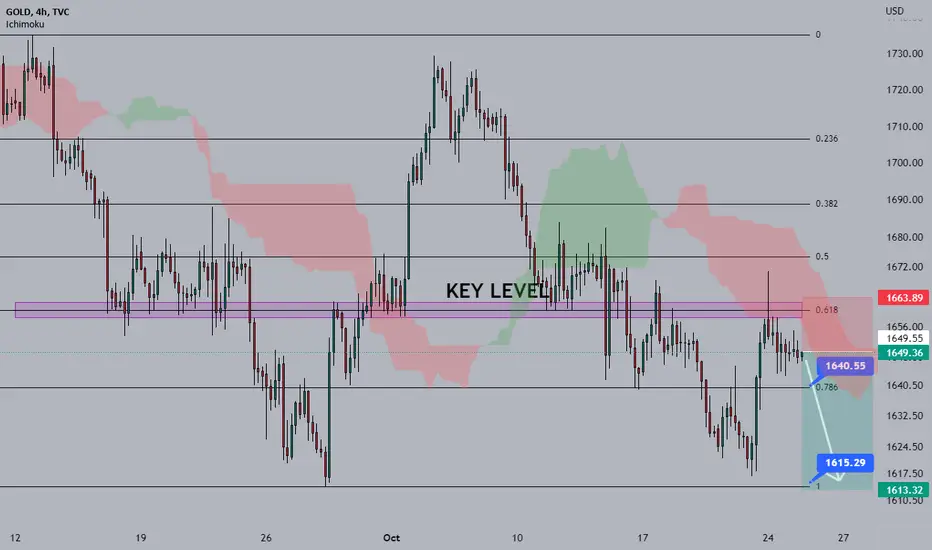
Gold bearish trend is ready againFrom my last analysis, we manage to catch the $55 Movement with risk reward 1:3. Now we will apply the same risk-reward ratio. Based on the Fibonacci & Ichimoku cloud we can clearly see the resistance level at $1660. Don't miss another golden opportunity. Share the idea with all your friends!
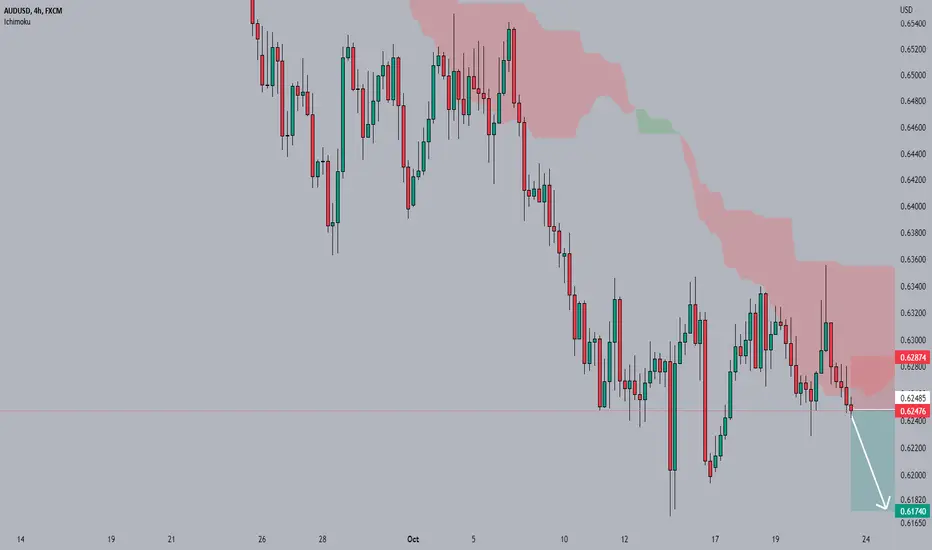
AUD/USD SELLBased on the latest bullish USDX analysis, on top of that, the price couldn't brake the Ichimoku cloud and we are witnessing a decline in price and another bearish trend.
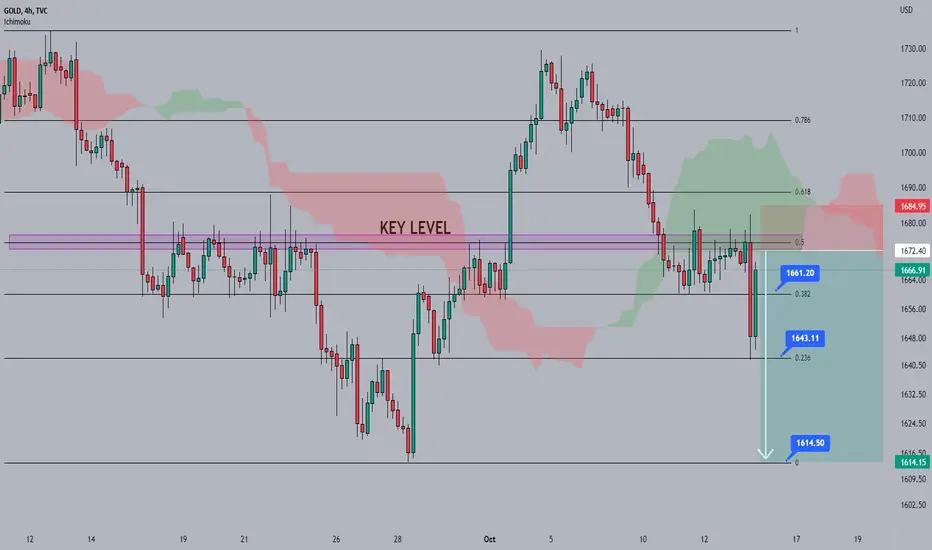
Gold continue the bearish trendAfter my latest analysis of the US Dollar Index, I expect the bearish GOLD trend to continue NOW! Once the gold reaches the key level (current resistance) trend will start. Risk - Reward 1:5, Good luck!
Ichimoku cloud won't break!We have only touched the bottom of this cloud 4 times now in almost 12 years. Everytime we do, it means something huge for ole' BTC. First two times it indicated approx. 30x gainz. Second time, 20x. Third time 10x?
We shall see folks. Buckle up cuz' either way I smell something big!
Stew

MICROSOFTHello and welcome to this analysis
Microsoft like TESLA (link below) is also a breakdown stock in the monthly time frame. However, in the short term its better placed.
In the weekly time frame its activated a bullish harmonic abcd that is suggesting a bounce back to $ 260-270 from there the next round of selling would like resume for $ 200-$175.
This one too is a short term buy, rather sell on rise

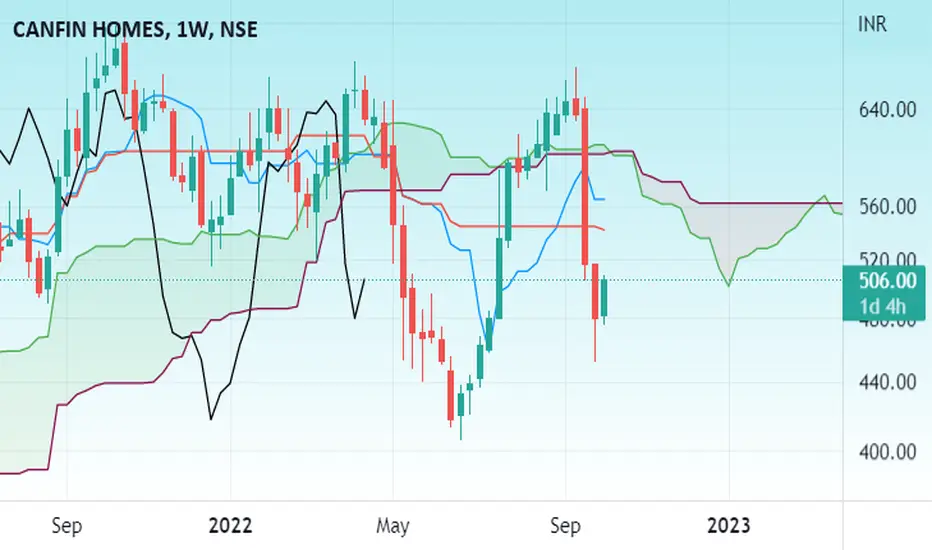
CANFIN HOMESHello and welcome to this analysis
The stock had a very sharp decline in September due to management reshuffle.
It is now showing a reversal from a strong base area.
Short term Ichimoku is indicating a possibility of 530 and 560 if it holds above 490
Good risk reward set up at current juncture.