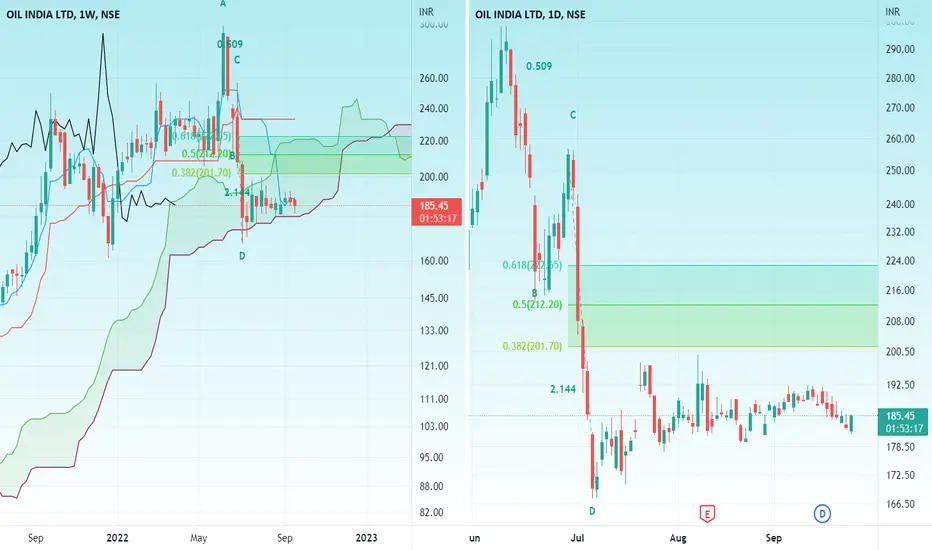
OIL INDIA LTDHello and welcome to this analysis
Oil India in the daily time frame after activating a Bullish Harmonic ABCD completed a 38% Fibonacci retracement. In the process it activated an Ichimoku C Clamp in the weekly time frame.
Stock could be accumulated between 180-190 for 210 (short term) 240 (medium term) and 350 (long term)
View would be invalid below 170
Happy Investing
Ichimoku_trader
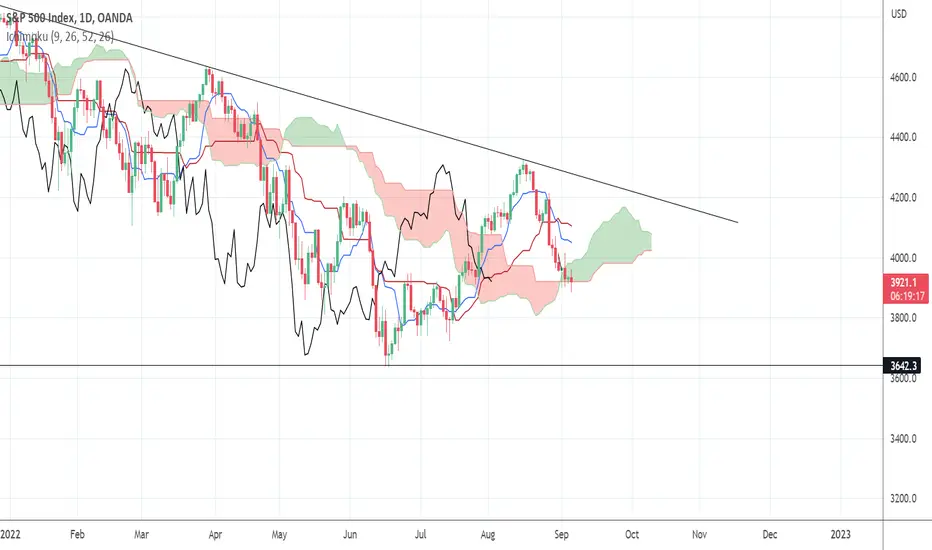
SPX500 ready for for new lows?Evening traders. Ive been watching the spx500 for quite sometime now. If you look and my chart the price has bounced off the trend line quite a few times. I was expecting to see price move in between both trendlines, squeeze and push either upwards or downwards.
As per my strategy my sell signals have triggered which are all highlighted in red. RED cloud formed. crossover. lagging span broke the cloud and price closed below cloud. However as you can see the highlighted yellow area the market has been volatile and could take an unsuspected upwards move. It could be a trap to trigger positions, push back to the lower trendline or even hit the cloud again and then hit lows at 3639 - 3548.
I am following my strategy though and I will be placing a trade in the next few days.
As always trade safe
cheers

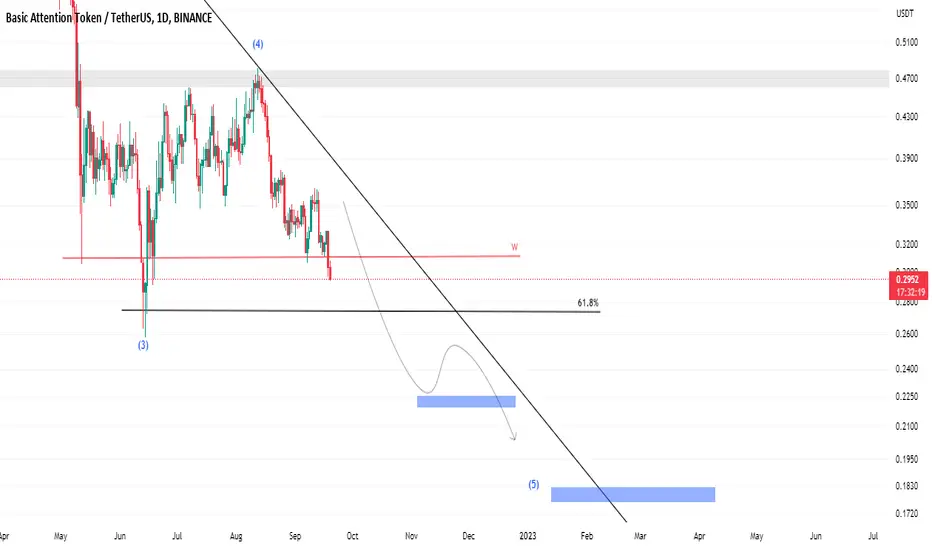
BATUSDTWill the trend continue?
Will it touch the wave 5 targets (blue boxes) in the medium term?
Just an analysis that can easily be wrong.
VEDANTAHello and welcome to this analysis
VEDL has given a Bullish Harmonic Sea Horse breakout indicating a target near 415-425 with a stop loss at 255. It could be accumulated between 325-285 with a stop loss at 255.
Medium term bullish structure with a good risk reward set up
Happy Investing

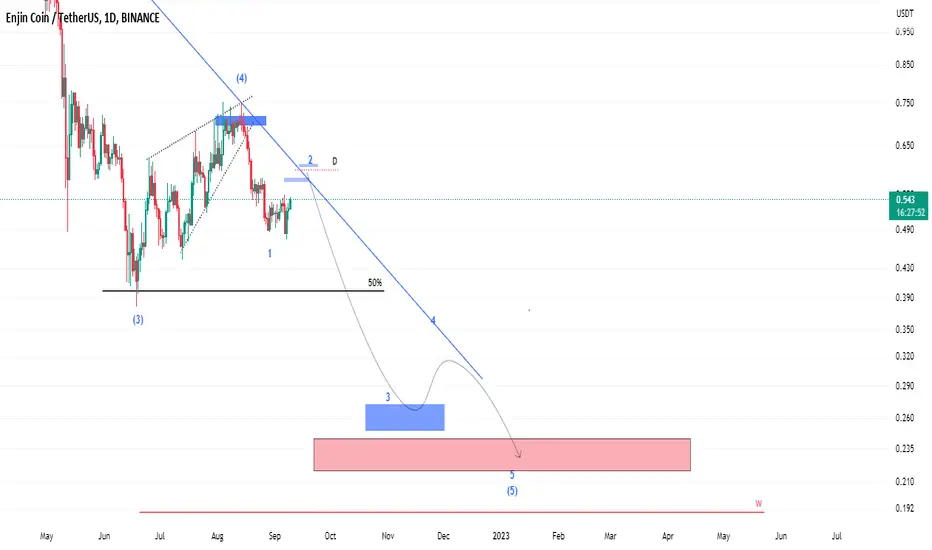
ENJUSDTIn a period of several months, we will see a further fall in the price in the form of wave 5
Just a personal analysis and opinion that can easily be wrong
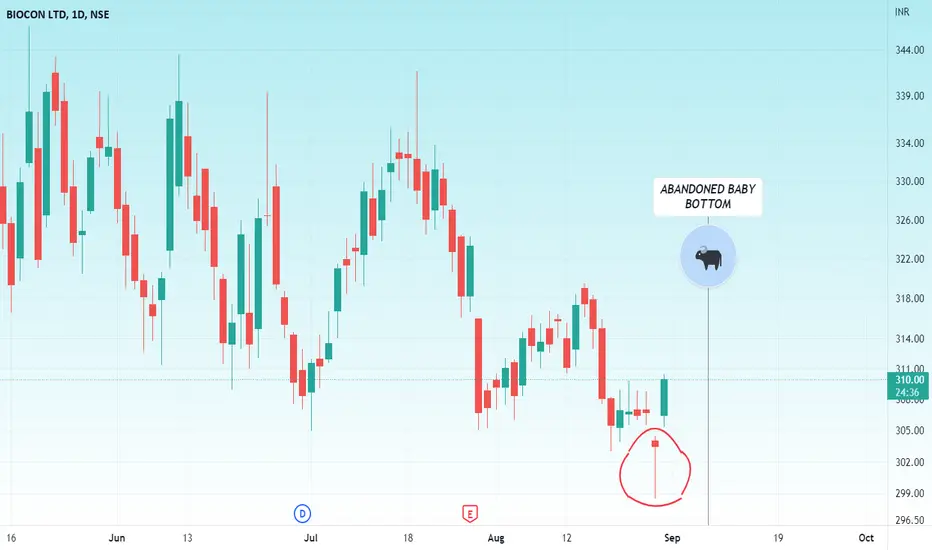
BIOCONHello and welcome to this analysis
BIOCON which has been in a downtrend for a very long time now has given a mega reversal signal via an ABANDONED BABY BOTTOM
Abandoned Baby Bottom reversal are similar to Island Reversals, where the isolated candle is formed with a gap down preceding it and a gap up succeeding it.
This could now rally till 320-340 where it meets falling trend line resistance. The structure would be considered wrong if it breaks 298
SPX500USD new lows? Evening folks. Ive been looking at these charts for a few weeks now and it looks like we are setting up to hit previous lows or possible new lows. As you can see we have bounced of the resistance trend line which seems to be a pretty strong resistance.
We've had price break below the cloud which is part of my ichimoku strategy. What im waiting for are the red cloud to appear and the lagging span to break the cloud and we have a trade on our hands.
You can also see we have long wicks above the bodies of the previous daily candles which suggests that the buyers are losing control and bears are gaining strength.
I think we could see prices reach 3650 or break just below it, have a small reversal then head lower to perhaps 3500 area.
Its been a pretty volatile market though so trade safe and trade smart.
cheers
shaun
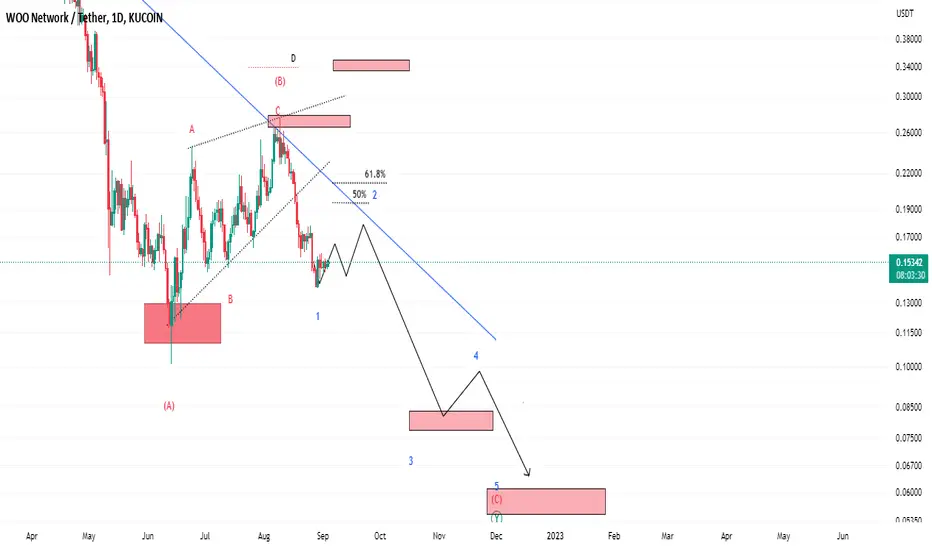
WOOUSDTIt seems to be completing wave 2 of C from the second phase of the double correction
After the completion of wave 2, we can expect a heavy drop in the price of this cryptocurrency
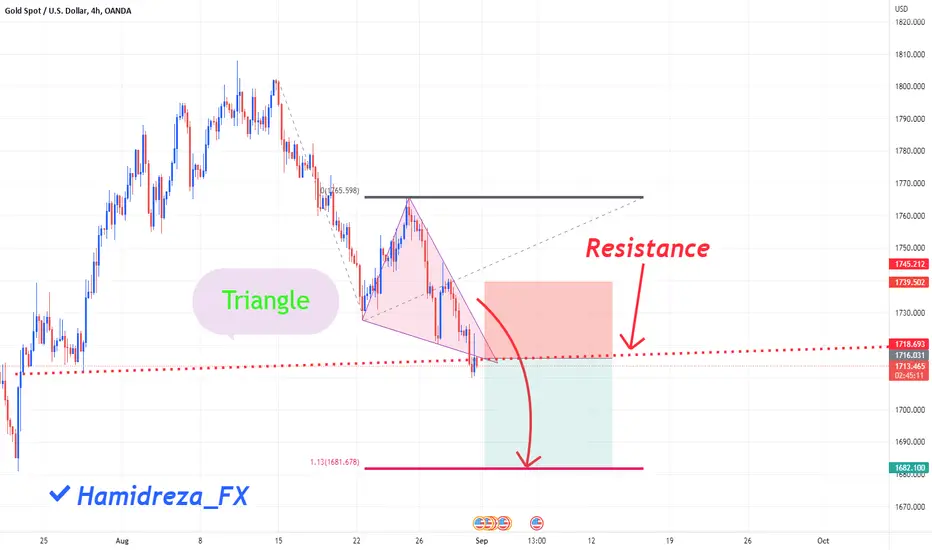
💡Don't miss the great Sell opportunity in XAUUSDHi Dears
The monthly and weekly trend of gold tells us that we are currently in a downward trend. In the 4-hour chart, we have a big resistance that gold has not been able to break, so we expect it to continue falling. I calculated the gold target from the monthly trend line, which of course is confirmed by the 1.13 Fibonacci area.
If you like my analysis, please support me with your likes and comments.
Don't forget to follow, friend
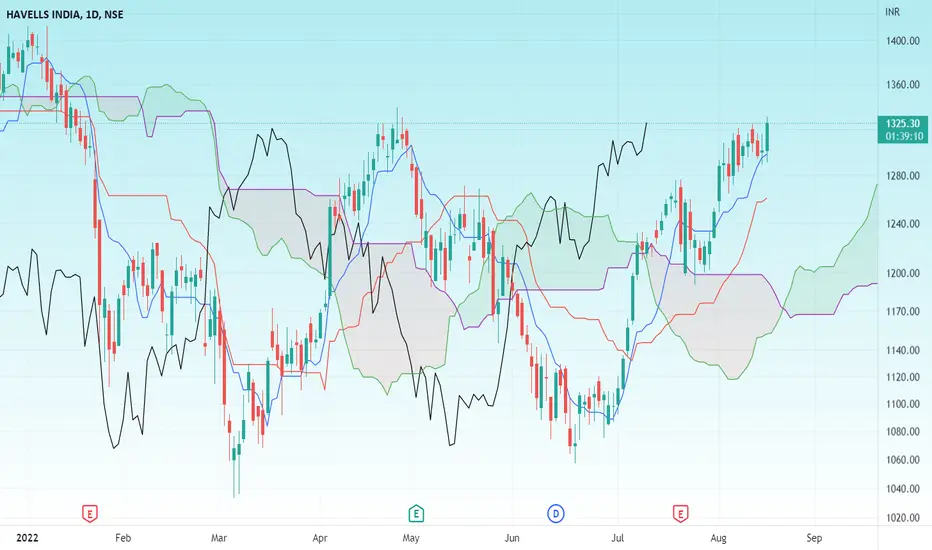
HAVELLSHello and welcome to this analysis
Havells has given a fresh breakout today after consolidating between 1290-1320.
It could rally till 1375/1425 as long as it does not break below 1310.
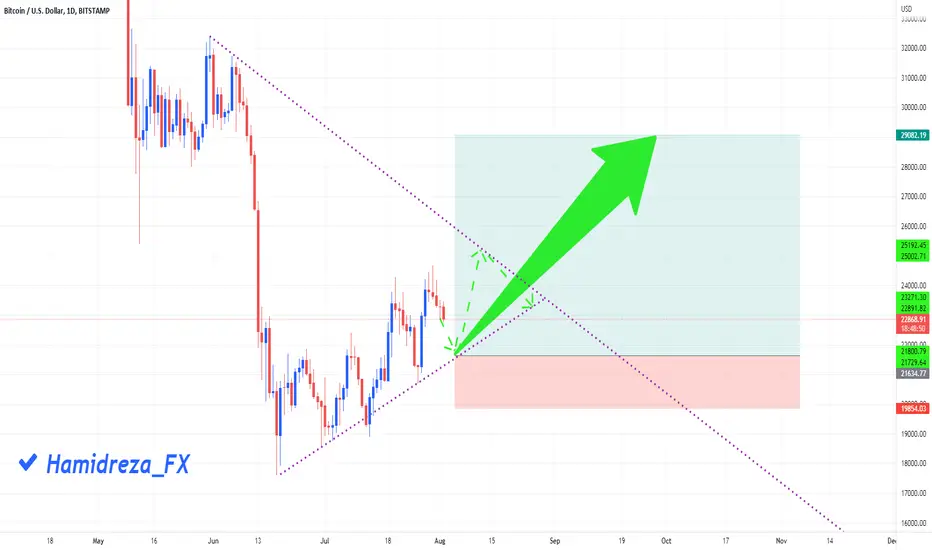
💡Don't miss the great BUY opportunity in BTCUSD!Hi dears
I think Bitcoin still has the ability to grow, and for now it has to be traded. There is a rising trend line that each time Bitcoin reacted to it, so I put the loss limit under the previous valley of that process.
Be sure to comment on my analysis and support me with my likes.
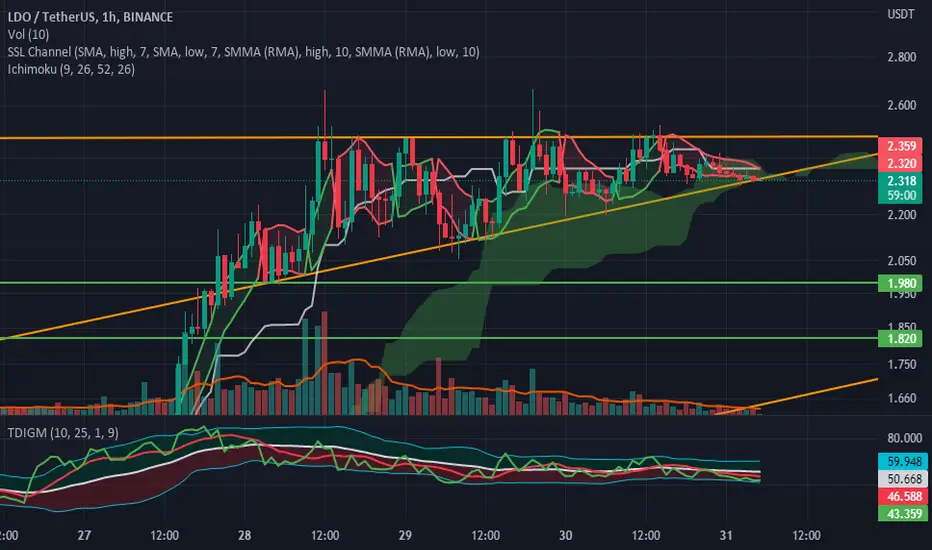
LDO : uptrend breaking out?If the triangle is broken from the bottom, because the cloud also breaks , there is a possibility that the price will fall to the 0.5 and 0.618 Fibonacci levels, which are the prices of 1.98 and 1.82, respectively.
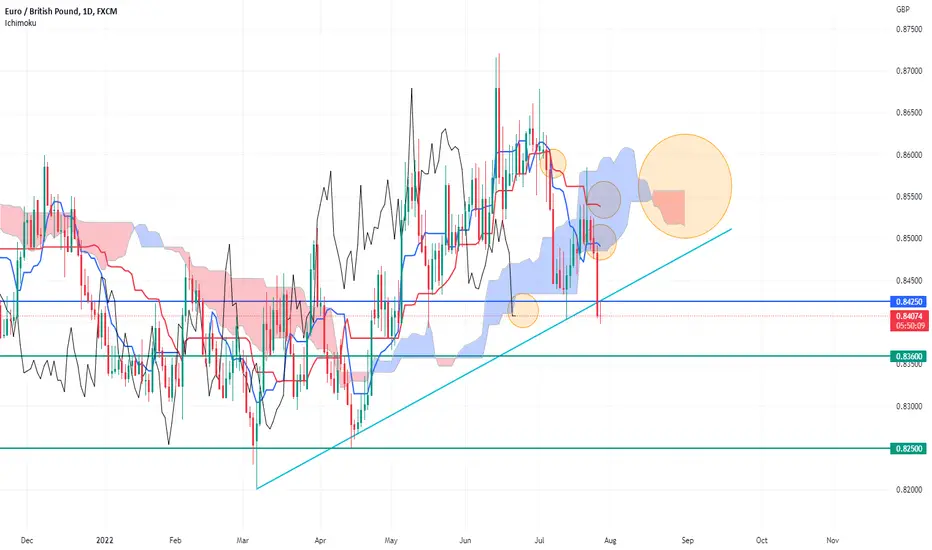
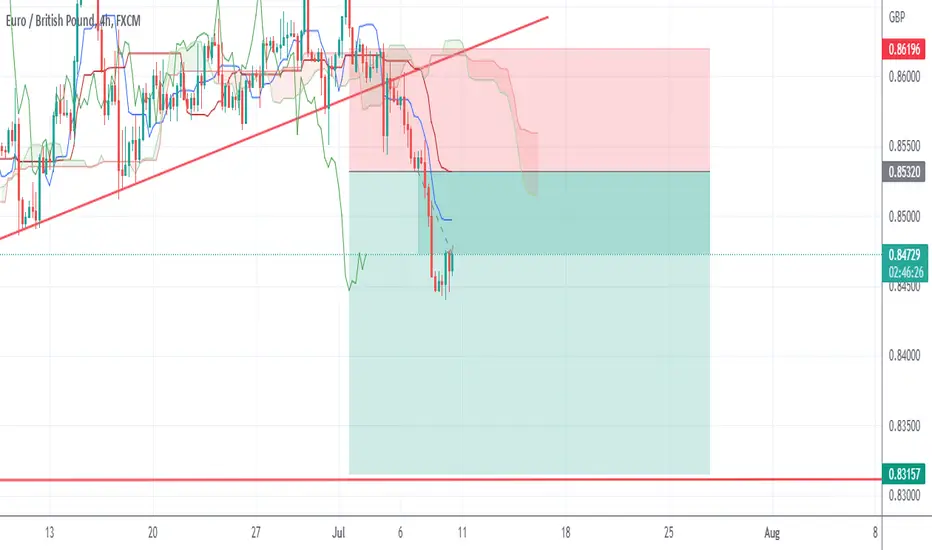
EUR/GBP Ichimoku Cloud AnalysisNOT A FINANCIAL ADVICE, FOR EDUCATIONAL PURPOSES ONLY
Short positions below 0.84250 with targets at 0.83600 & 0.82500 in extension. Pivot: 0.84250
Comments: Chikou breakout, Tenkan sen kijun sen crossover, Tenkan and kijun pointing down, Kumo cloud twist, trendline break.
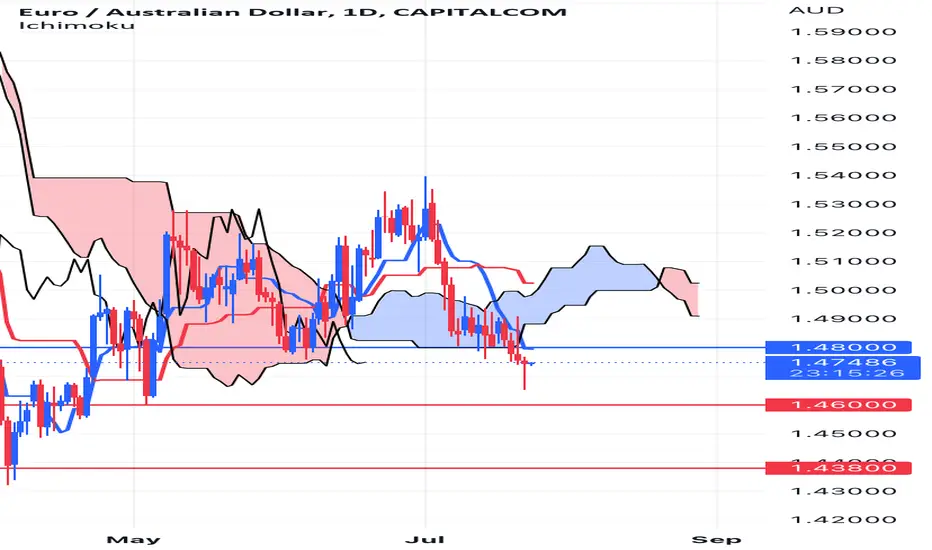
EUR/AUD Ichimoku Cloud Analysis‼️Not a financial advice, for educational purposes only‼️
Short positions below 1.4800 with targets at 1.4600 & 1.43800 in extension. I’m placing sell limit orders at 1.4800.
Comments: chikou breakout, tenkan kijun cross, kumo cloud twist, double top
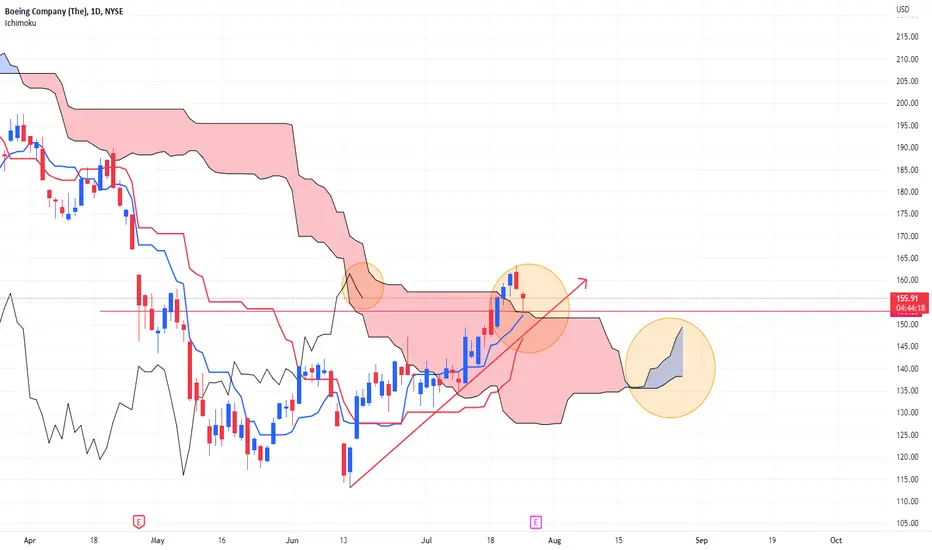
BA Ichimoku Cloud AnalysisNot a financial advice, for educational purposes only!
Bullish sentiment above 153.00.
Lesson: When using Ichimoku Cloud, it is important to look where is the chikou span. In this case, it is currently sitting inside the cloud so no trades. To avoid fake setups, the chikou span is your friend. It is also good as s/r tool!
comments: EARNINGS COMING in 27 JULY 22. Estimated -0.13. Awaiting for the further details.

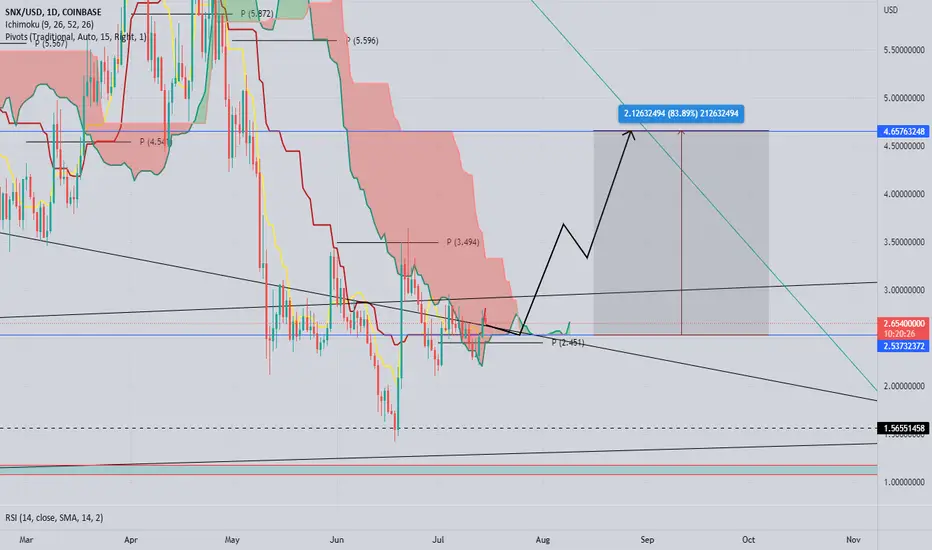
It seems to be inclining There are some symptoms for increase the price.
Because of the same shapes in MACD that increase about40%, I think it will take again.
The Ichimoku Resistance will block the price and I think it will Return back for accumulation.

BandHello dear traders
Based on the 4-hour areas, the probability of a jump in the Band price is high
Entry:1.40_1.48
Stop:1.38
Tp:1.97
Please write your comments.

So far my outlook for Eur/Gbp is still going down.I would shift the current position of the SL at the break-even point. So far my outlook for Eur/Gbp is still going down.
I'm just trying to reduce the potential loss if there is an extreme movement that can change the direction of the market. It is better to secure funds by moving at the break-even point.
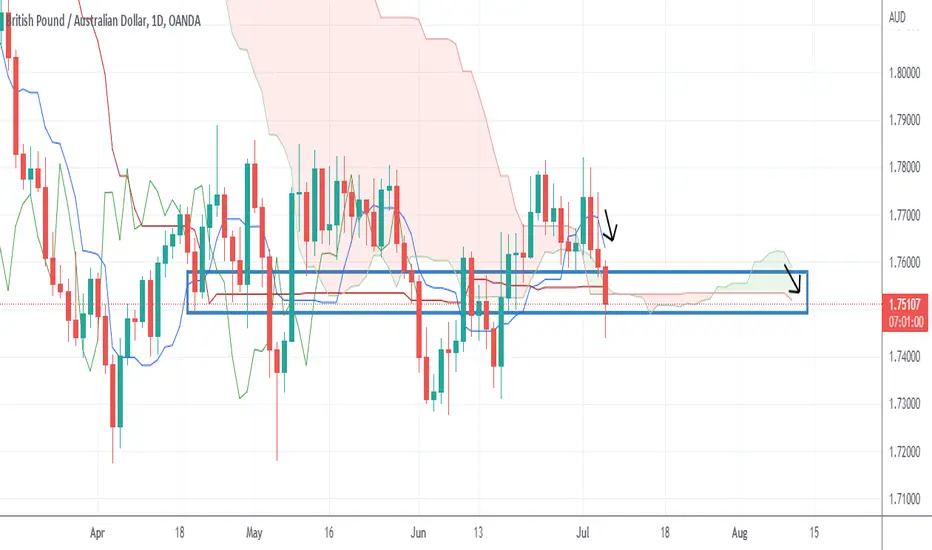
There are significant changes to Gbp/Aud today.There are significant changes to Gbp/Aud today. if yesterday's analysis showed that there was an indication that the price was at strong support, the added kumo cloud indicated an indication of increased buying volume, but today the kumo cloud indicates a significant selling movement and the price is possible to break through the support (blue box area) we will wait until the end of today to see the end of the candle whether it can go through support.
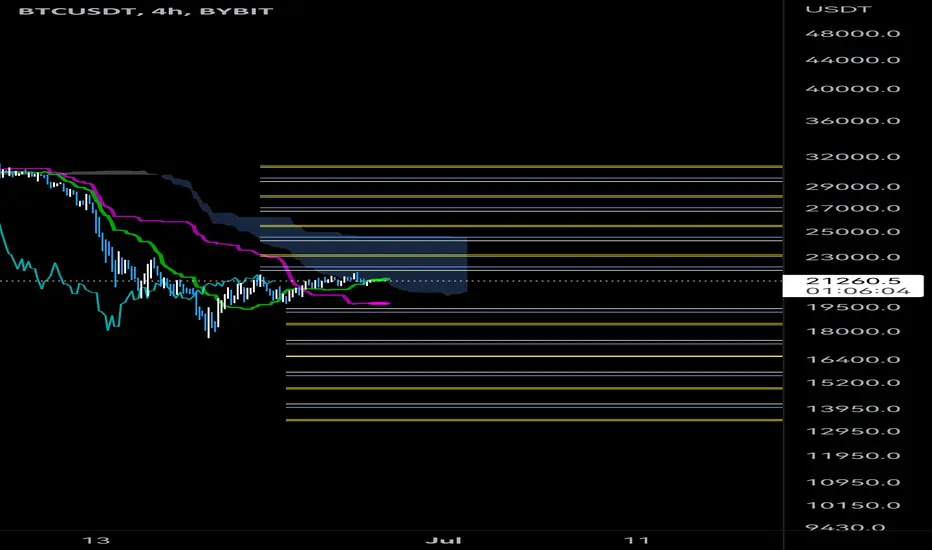
Swing Trader BTC for July 2022This would be good buy/sell zones for BTC
Either to accumulate more BTC or sell for a small profit.
On 4h we have TK Cross Up (Bullish sign) , but cloud is still bearish.
TenkenSen Sideway Strategyin Sideways if price reach Previous Tenkensen High or Low and Tenkensen it self Didnt reach there you can buy or sell to previous High or Low!!!
in Other Word if Price touch previous high and tenkensen not You can sell until price hit last low and contrary if price reach the last low and tenkensen not you can buy until last high in market
Enjoy it 100%
