EURCHF continuously downtrending by IchimokuComment:
EURCHF continuously downtrending as per Daily Ichimoku Analysis.
Ichimoku Trend Analysis:
- Kumo ( Senko span A and B) down
- Kijun sen down
- Tenkan Sen down
- Chiko Span below candles
Next Scenario:
Market is initially heading towards a reversal level of 1.0892 level. Once it breaks, it could be down to 1.07825 level.
Ichimoku Cloud

EURCHF downtrend after P wave breakoutComment:
EURCHF broke the P wave as well as Daily support. Market is on downtrend based on below Ichimoku trend confirmation.
Ichimoku Trend Analysis:
- Kumo (Senko span A and B) down
- Kijun sen down
- Tenkan Sen down
- Chiko Span below candles
Next Scenario:
Market can reach down to 1.08925.

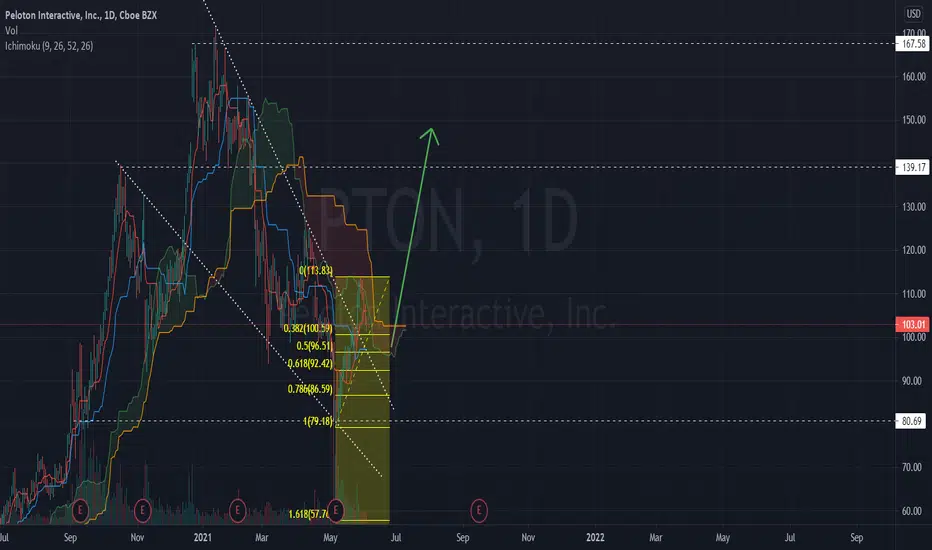
peloton interactive In the Fibonacci retracement areas (0.38 / 0.5 / 0.618) we are waiting for the reaction to enter the long trade. Of course, before entering the trade, take a look at the fundamental data of this stock . If the area of 0.786 is touched, we have to wait for the previous highest high to break to enter the trade! NASDAQ:PTON
Bitcoin 10 Hour ChartThe 10 hour chart on Bitcoin looks super bearish in my opinion. Price is below the cloud. The 50 SMA is pointing down and bitcoin hasn't been able to get back above the 50 SMA on hardly any of the hourly time frames.

Bitcoin Edge to EdgeBitcoin has closed within the 8 hour Ichimoku Cloud and could be looking at an edge to edge move inside of the cloud.
The Tenkan (blue) has crossed over the Kijun (orange) which suggests a bullish continuation.

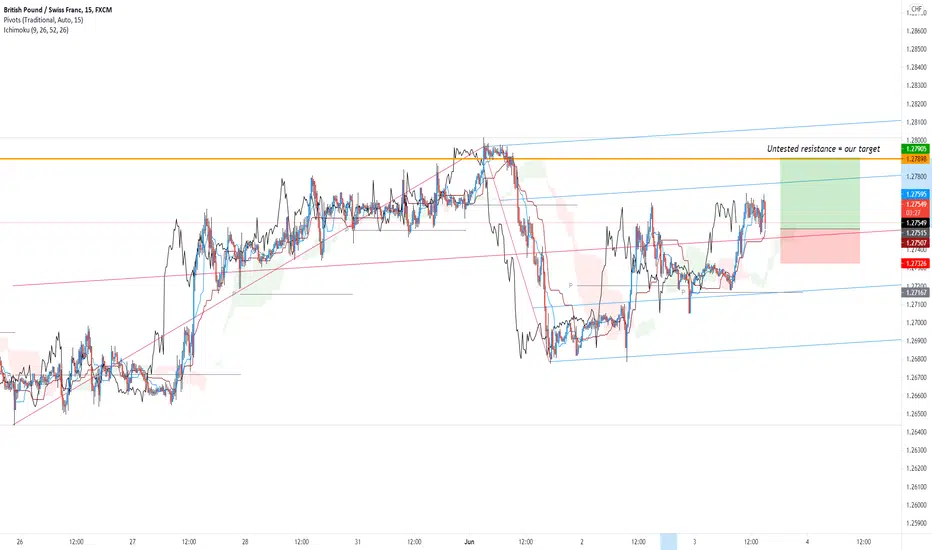
GBP/CHF: Bought at market price (nearly 40-pip trade)Hi guys,
The pair is showing some bullish momentum since this morning.
According to the ICHIMOKU CLOUD, it could potentially reach the next untested resistance in the next hours.
The Lagging Span on the hourly chart has no real obstacle and the 15-min chart is showing bullish signs as well (price above the cloud, Lagging Span above the price, future KUMO green = bullish).
The R/R is slightly above 2 for this trade.
Trade with care,
Jesse
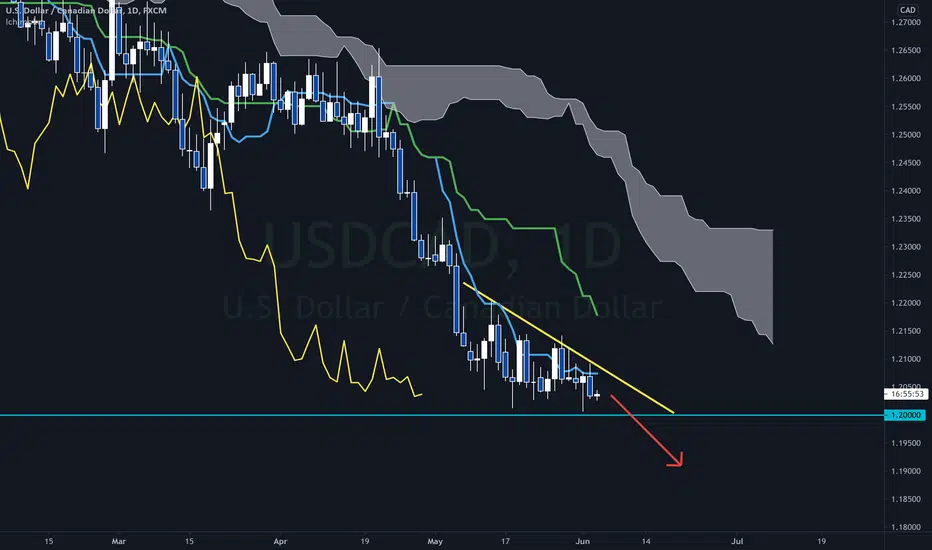
USDCAD descending triangle in Daily timeframeComment:
After previous analysis on 18 May market has been in descending P wave, potential support breakout as per below Ichimoku confirmation.
Ichimoku Breakout Analysis:
- Kumo (Senko span A) down and getting thicker
- Kijun sen down
- Chiko Span below candles
Next Scenario:
Price itself is below Tenkan Sen, showing bearishness. Market could be resisted by Tenkan Sen and descending trend line, and possibly break the support level as well as round number of 1.20000.
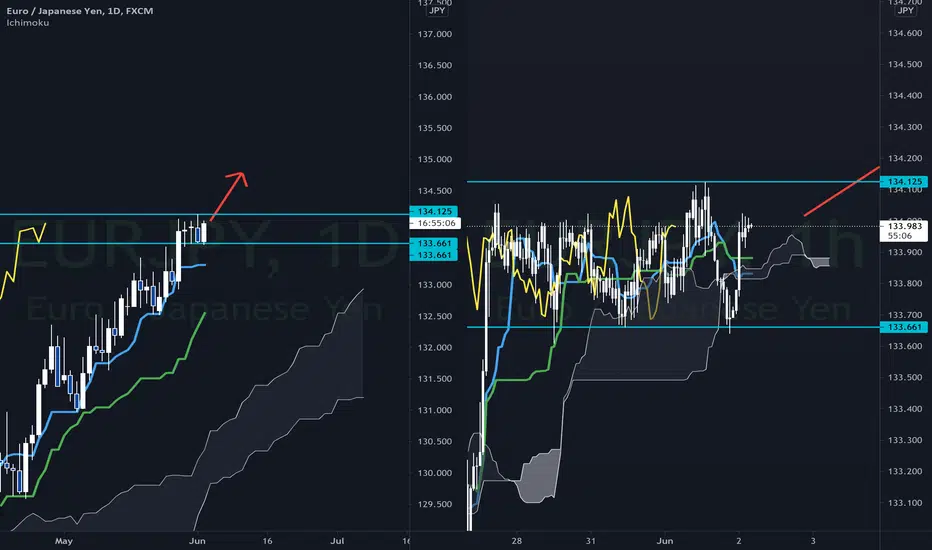
EURJPY in continuously bullish trendComment:
EURJPY continuously bullish by Daily timeframe as per below Ichimoku confirmations. Now H1 shows box range (yesterday was P wave). Please refer to below scenario.
Ichimoku Trend Analysis:
- Kumo (Senko span A) up. Kumo itself is getting thicker.
- Kijun sen up
- Chiko Span above candles
Next Scenario:
After P wave yesterday on H1, now market is forming Y wave as well as box range for the last 2 days. There still is a potential breakout of a new resistance from yesterday at 134.125. Better wait for Tenkan Sen and Kijun sen gold cross to confirm a potential breakout in H1.
GBPJPY Daily bouncing by Tenkan SenComment:
GBPJPY Daily timeframe showing a bounce by Tenkan Sen today. Below is Ichimoku Trend Analysis as well as next possible scenario.
Ichimoku Trend Analysis:
- Kumo (Senko span A) up
- Kijun sen up
- Tenkan Sen up
- Chiko Span above candles
Next Scenario:
The market has been bounced by Tenkan Sen as well as a trend line.
Market is continuously bullish and heading towards a resistance level of Feb 2018 at 156.610 level.

Bitcoin Daily Ichimoku ForecastFuture forecast for the Tenkan (blue - short term moving average), Kijun (orange - long term moving average), & Senkou Spans (cloud - red resistance & green support) is provided on the chart for the daily timeframe.

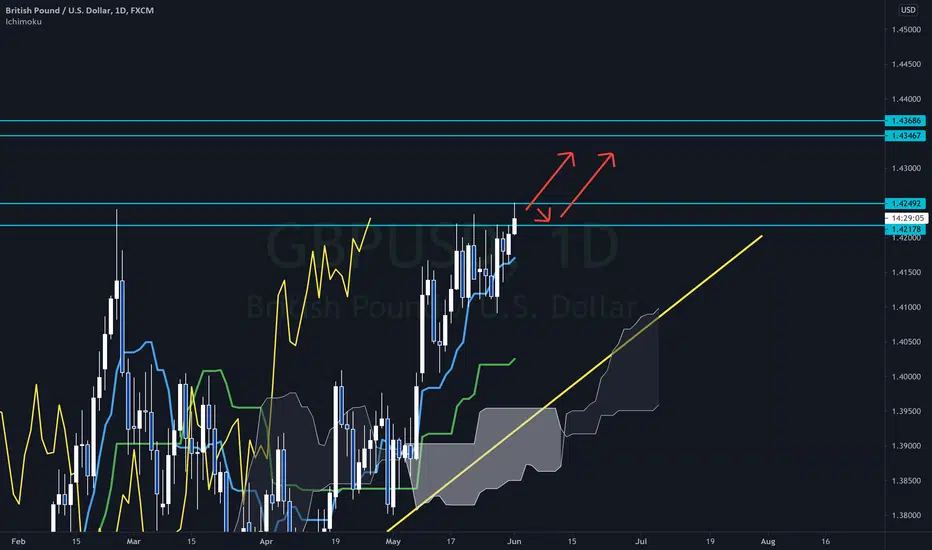
GBPUSD bullish by IchimokuComment:
GBPUSD shows a potential bullish trend as per below Ichimoku confirmations.
Ichimoku Trend Analysis in Daily timeframe:
- Kumo (Senko span A and B) up
- Kijun sen up
- Tenkan Sen up
- Chiko Span above candles
Next Scenario:
The market is currently at the Daily resistance level. Better to wait for a clear breakout based on Daily timeframe candlestick close. Or wait for a bounce at 1.42178 reversal level in H1 and look for a buying edge.
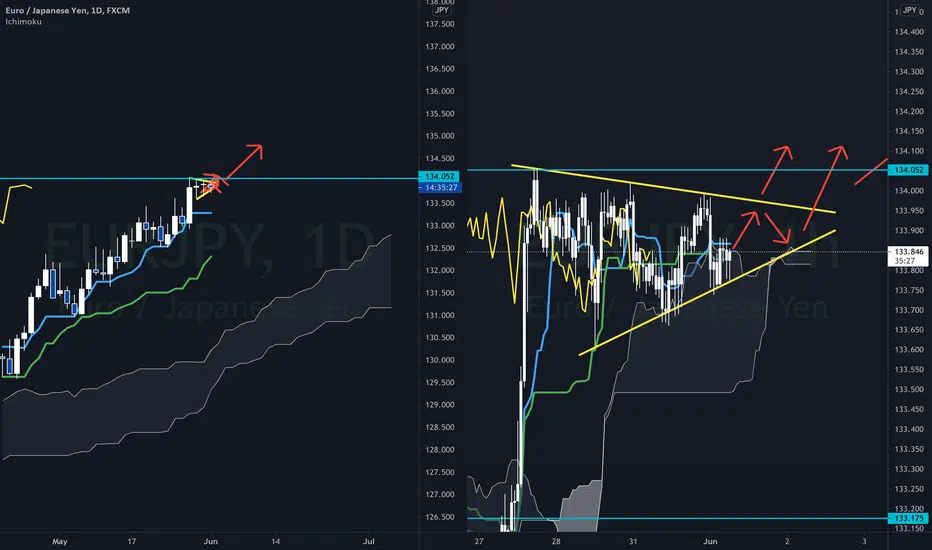
EURJPY continuously bullish by IchimokuComment:
EURJPY continuously shows bullish trend as per below Ichimoku confirmations.
Ichimoku Trend Analysis in Daily timeframe:
- Kumo (Senko span A) up
- Kijun sen up
- Chiko Span above candles
Next Scenario:
H1 shows P wave with Ichimoku range confirmation. Expecting the breakout upwards.
BTC seems to be find support at $34k -$35k1h Chart
The 1h chart is starting to show bullish signals:
(1) Laggard line uptrend from price action
(2) Golden cross with 13EMA and 21MA
(3) Price trying to break at 36,000
(4) Starting of green cloud
4h Cart
The 4h Chart shows similar action
Laggard line shows uptrend
13EMA and 21MA about to form golden cross
Still lacking volume
Daily Cart
The Daily Chart is still in the bearish arena
Laggard line shows consolidation with support at 35,000
13EMA below 21MA
Weakvolume

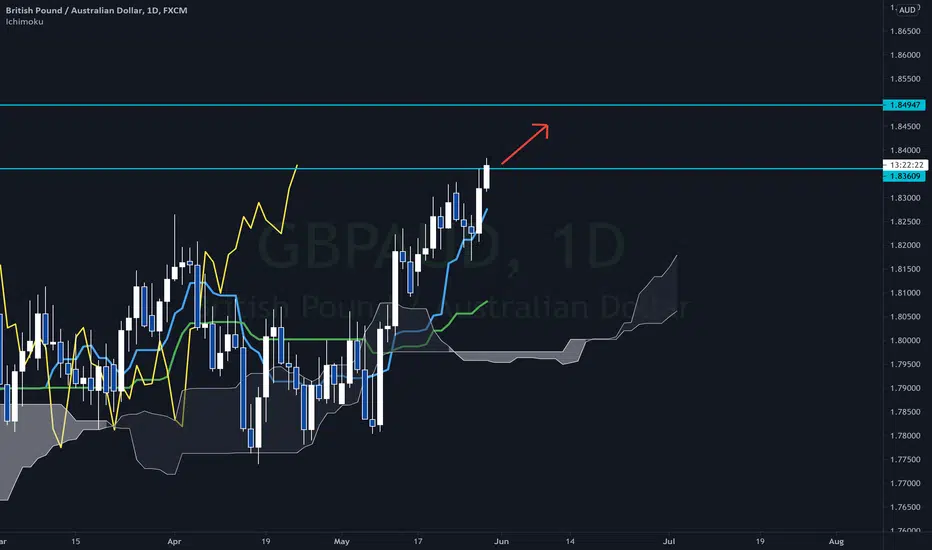
GBPAUD continuously bullish by IchimokuComment:
GBPAUD Daily timeframe shows bullish market as per below Ichimoku confirmations.
Ichimoku Trend Analysis:
- Kumo (Senko span A and B) up
- Kijun sen up
- Tenkan sen up
- Chiko Span above candles
Next Scenario:
Lower timeframes are also bullish down to H1. Currently market is retracing in M15, could be bouncing at 1.83609 level. Once the market turns bullish, the next target is at 1.84947 resistance on 29 Oct 2020.
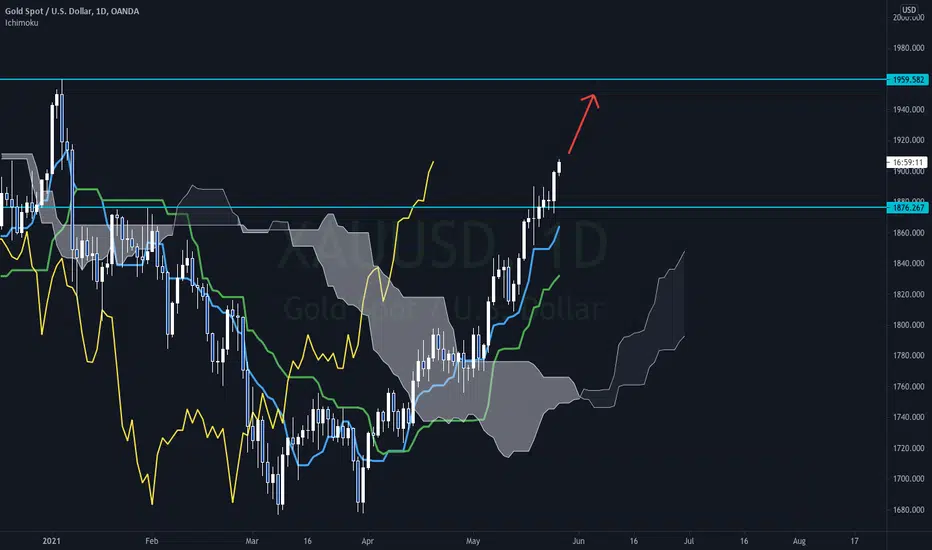
Gold is continuously bullish by IchimokuComment:
Gold (XAUUSD) is continuously bullish as per below Ichimoku confirmations.
Ichimoku Trend Analysis (Daily timeframe):
- Kumo (Senko span A and B) up
- Kijun sen up
- Tenkan sen up
- Chiko Span above candles
Next Scenario:
After market broke the resistance of 1876.26 level it's continuously bullish as above Ichimoku confirmations. Lower timeframes are also showing bullishness, therefore, market is stably up trending.
The ultimate target is at 1959.582 level.
USDCHF continuously bearish by IchimokuComment:
USDCHF shows stably bearish by Ichimoku trend analysis.
Ichimoku Trend Analysis (Daily timeframe):
- Kumo (Senko span A and B) down
- Kijun sen down
- Tenkan sen down
- Chiko Span below candles
Next Scenario:
Market shows downtrend through Daily down to M30 as per Ichimoku trend analysis. I could continuously be bearish as long as market is below Tenkan sen and Kijun sen.

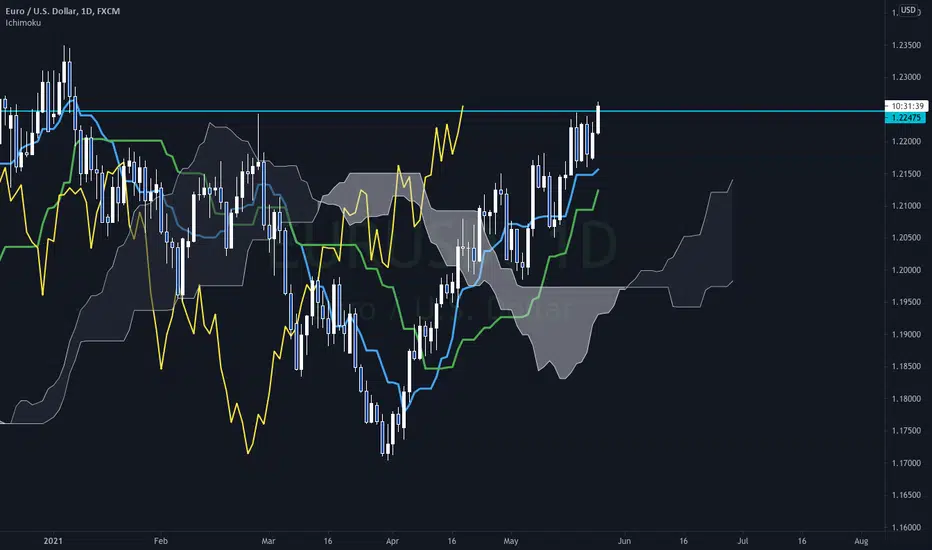
EURUSD Daily bullish by IchimokuComment:
EURUSD Daily timeframe shows continuously bullish market by Ichimoku.
Ichimoku Trend Analysis:
- Kumo (Senko span A and B) up
- Kijun sen up
- Tenkan sen up
- Chiko Span above candles
Next Scenario:
Market is about to break the previous resistance of 1.2247. If today's candle closes above the resistance level, market can continuously be bullish.
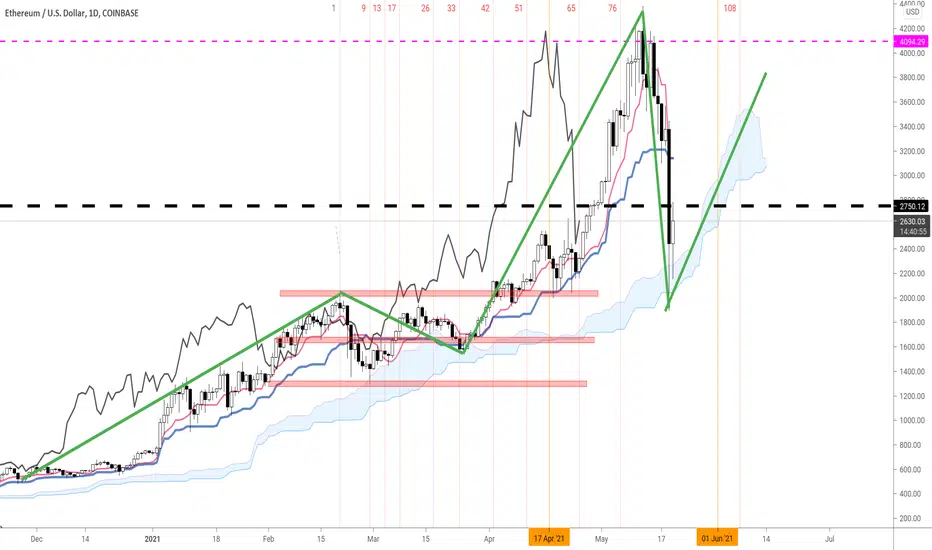
#ETHUSD Le pattern S #ichimokuLa crypto a pu réaliser une 2E mais n'est pas allée plus loin.
Le pullback sur le sommet de la première vague d'impulsion a abouti à un pattern S.
Que peut on faire maintenant ?
Le début du pattern S nous indique un retour vers le dernier sommet puisque le sommet de la première vague d'impulsion figure parmi les point d'équilibre du marché. Il n'y a rien à faire avant 8 jours de bourse au dessus de ce niveau d'équilibre (Le marché devra construire une base de départ sur ce seuil pendant ce temps là) car le marché peut rechuter à tout moment.
Rendez-vous donc dans 8 jours ou plus.
Pour le moment, rien n'est sûr.
Excellente journée à toutes et tous.
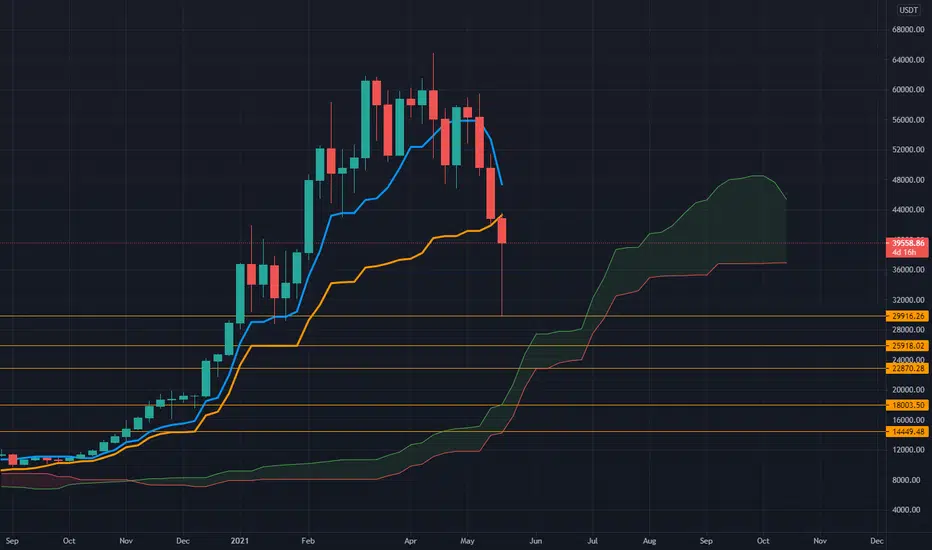
Will Bitcoin Continue To Drop?Looking at the 6D chart with Ichimoku cloud, it definitely seems possible that bitcoin may continue to drop. The way the current candle is hanging from the Kijun does not look very good. There are more support levels that could be tested such as 26k, 18k, 15k.
We should play close attention to the bitcoin price action today along with watching the 4D and 5D charts which have a candle that completes today.
Gold is at Daily resistance, still showing bullish by IchimokuComment:
Gold reached Daily resistance at 1875.28 level. Ichimoku is still showing uptrend as per below confirmations.
Ichimoku Trend Analysis:
- Kumo (Senko span A and B) up
- Kijun sen up
- Tenkan sen up
- Chiko Span above candles
Next Scenario:
There is a potential breakout as per above Ichimoku trend analysis, however, better to wait for a Daily resistance break. Otherwise price may retrace back to Tenkan sen.

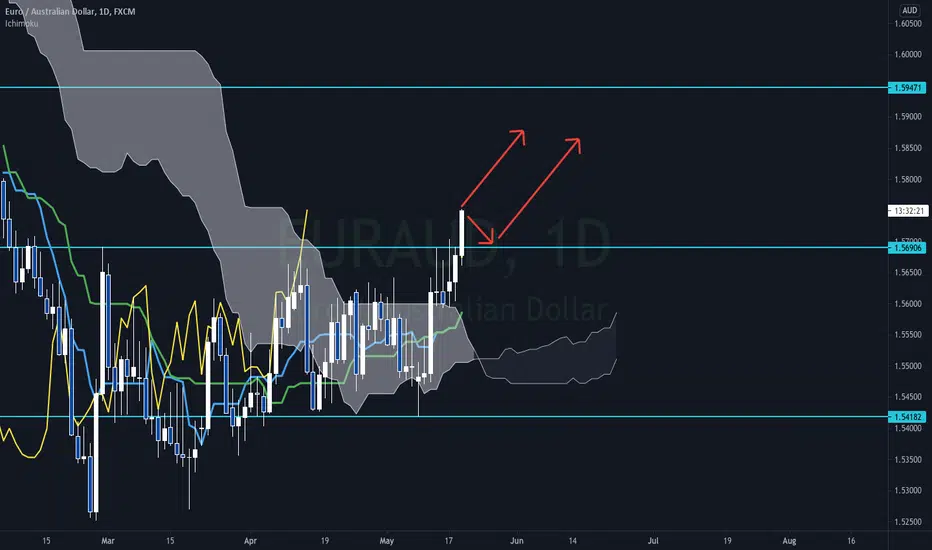
EURAUD broke resistance and continues uptrendComment:
EURAUD Daily chart shows market broke the resistance level of 1.5690 and continuously uptrend as per below Ichimoku confirmations.
Ichimoku Trend Analysis:
- Kumo (Senko span A and B) up
- Kijun sen up
- Tenkan sen up
- Chiko Span above candles
Next Scenario:
All the lower timeframes showing bullish trend, including Daily timeframe. This is very stable and strong bull market. Could test the previous resistance at 1.5690 level but long term target is at 1.5947.