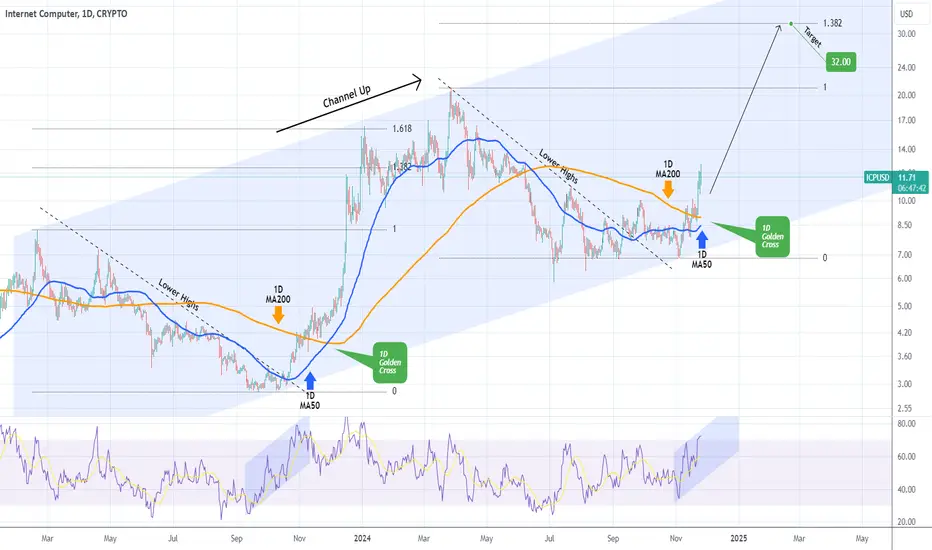
ICPUSD 1D Golden Cross can kickstart an amazing +250% rally!Internet Computer (ICPUSD) is about to form a Golden Cross on the 1D time-frame. The long-term prevailing pattern seems to be a Channel Up since the February 19 2023 High and November 04 2024 is a technical Higher Low.
The previous one was also formed a few weeks before a 1D Golden Cross, which kickstarted a non-stop rally to the 1.618 Fibonacci extension. The 1.382 Fib is at +250% from the current level at $32.00 and that is our current long-term Target.
-------------------------------------------------------------------------------
** Please LIKE 👍, FOLLOW ✅, SHARE 🙌 and COMMENT ✍ if you enjoy this idea! Also share your ideas and charts in the comments section below! This is best way to keep it relevant, support us, keep the content here free and allow the idea to reach as many people as possible. **
-------------------------------------------------------------------------------
💸💸💸💸💸💸
👇 👇 👇 👇 👇 👇
Icpusdsignals
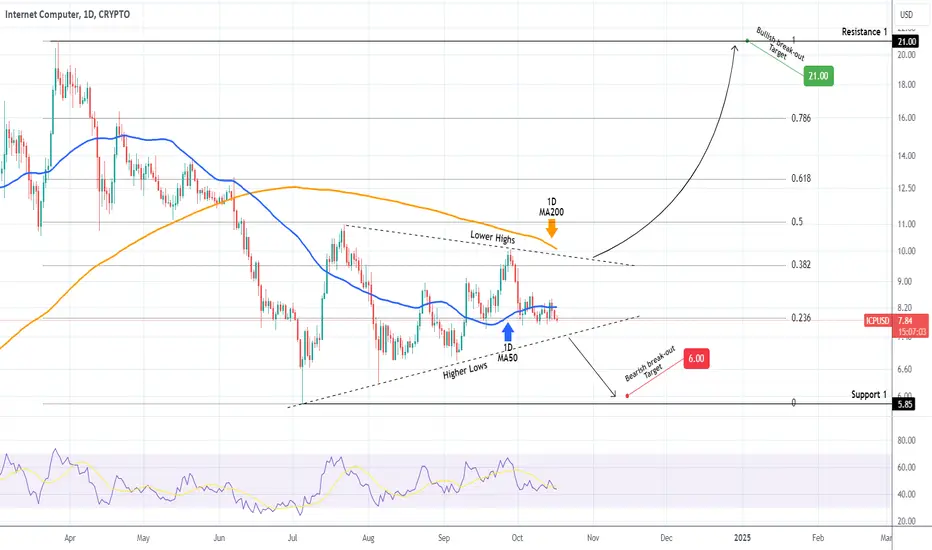
ICPUSD Trade the break-out of this Triangle.Internet Computer (ICPUSD) is trading within a Triangle pattern since the July 05 bottom, with the 1D MA50 (blue trend-line) acting as its pivot. The 1D MA200 (orange trend-line) is almost right on its top (Lower Highs trend-line).
Our approach on such patterns is to trade to the direction of the first break-out. A break above the 1D MA200 would be a bullish break-out signal, targeting 21.00 (Resistance 1), while a break below the Higher Lows trend-line would be a bearish break-out signal, targeting 6.00 (Support 1).
-------------------------------------------------------------------------------
** Please LIKE 👍, FOLLOW ✅, SHARE 🙌 and COMMENT ✍ if you enjoy this idea! Also share your ideas and charts in the comments section below! This is best way to keep it relevant, support us, keep the content here free and allow the idea to reach as many people as possible. **
-------------------------------------------------------------------------------
💸💸💸💸💸💸
👇 👇 👇 👇 👇 👇
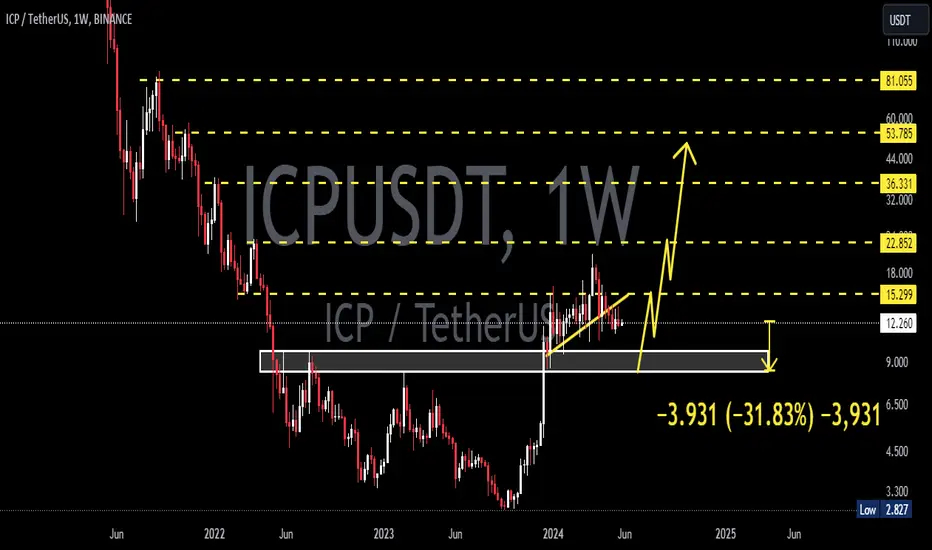
ICPUSD 1WICP ~ 1W
#ICP It looks like we need to retest this support block. We will place the first purchase order here, with a minimum target of 15%+
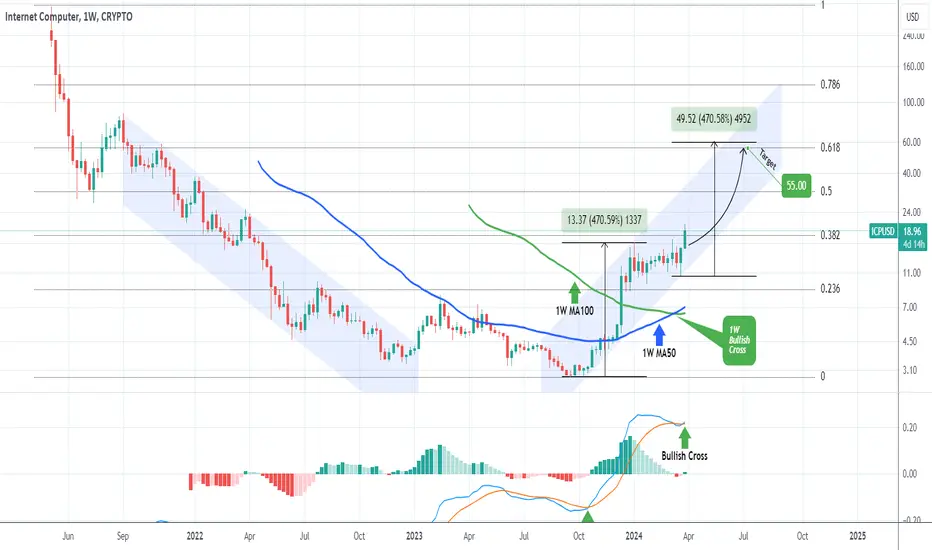
ICPUSD targeting $55.00Internet Computer (ICPUSD) is on the 2nd straight green 1W candle following the Higher Low pricing at the bottom of the September 2023 Channel Up. As the 1W MACD posted a Bearish Cross into Bullish Cross, we treat this as the start of the Channel's new Bullish Leg.
The previous Bullish Leg recorded +470% gains. Assuming a similar rise from the Higher Low, we are turning long again on ICP, targeting the 0.618 Fibonacci retracement level at $55.00.
-------------------------------------------------------------------------------
** Please LIKE 👍, FOLLOW ✅, SHARE 🙌 and COMMENT ✍ if you enjoy this idea! Also share your ideas and charts in the comments section below! This is best way to keep it relevant, support us, keep the content here free and allow the idea to reach as many people as possible. **
-------------------------------------------------------------------------------
💸💸💸💸💸💸
👇 👇 👇 👇 👇 👇
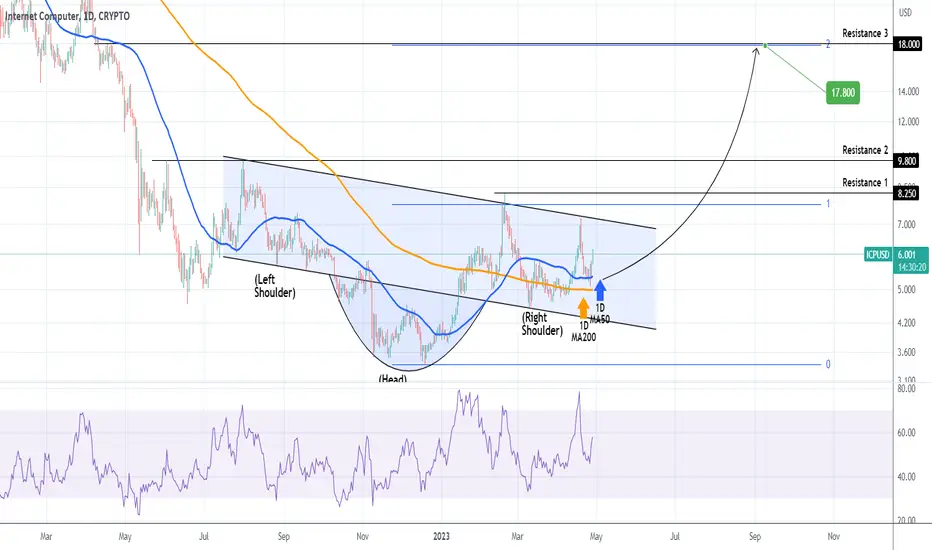
ICPUSD Inverse Head and Shoulders targeting 17.800Internet Computer (ICPUSD) is rebounding aggressively for the second straight day on the 1D MA50 (blue trend-line). The price is about to complete an Inverse Head and Shoulders (IH&S) pattern. The technical target for such patterns, that are typically formed on market bottoms, is the 2.0 Fibonacci extension from the neckline's Resistance. That is at 17.800, just shy off Resistance 3 and that is our long-term target.
-------------------------------------------------------------------------------
** Please LIKE 👍, FOLLOW ✅, SHARE 🙌 and COMMENT ✍ if you enjoy this idea! Also share your ideas and charts in the comments section below! **
-------------------------------------------------------------------------------
💸💸💸💸💸💸
👇 👇 👇 👇 👇 👇
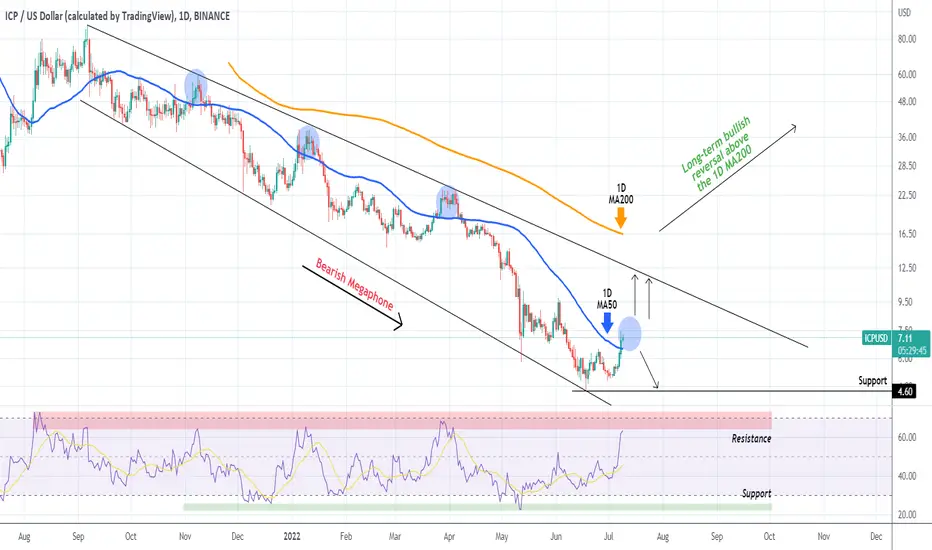
ICPUSD No overexcitement about rise. Observe this potential top.The Internet Computer Protocol (ICPUSD) broke yesterday above its 1D MA50 (blue trend-line) for the first time since April 08 (completing 3 months below it, the most during this Bear Market). With the 1D RSI just below its 11 month Resistance Zone that has priced all Lower Highs within this Bearish Megaphone pattern that started in September 2021, we should be concerned of this 1 week trend and a potential continuation.
As you see on this chart, every time the price broke above the 1D MA50 since November 2021, it didn't stay there for long and resumed the long-term bearish trend. This time period is depicted by the blue circle. As a result, if the price exceeds this limit and hasn't made a Higher High, best to sell ICP back towards its 4.60 Support. If on the other hand it breaks above the circle, buy the break-out targeting the top (Lower Highs) trend-line of the Megaphone. On the long-term, only a break above the 1D MA200 (orange trend-line), is technically capable of reversing the sentiment to bullish.
--------------------------------------------------------------------------------------------------------
Please like, subscribe and share your ideas and charts with the community!
--------------------------------------------------------------------------------------------------------