EUR-USD Bullish Bias! Buy!
Hello,Traders!
EUR-USD is trading in an
Uptrend and the pair is
Making a local bearish correction
But we are bullish biased and
After the retest of the horizontal
Support of 1.1640
We will be expecting a further
Bullish move up
Buy!
Comment and subscribe to help us grow!
Check out other forecasts below too!
Disclosure: I am part of Trade Nation's Influencer program and receive a monthly fee for using their TradingView charts in my analysis.
Ict

RETRACEMENT AND CONTINUATION FOR FRIDAYS TRADEI anticipate that Friday's trade will either retrace to 1.17151 or break through the high, liquidating the 1.17495 level, and then move further below.

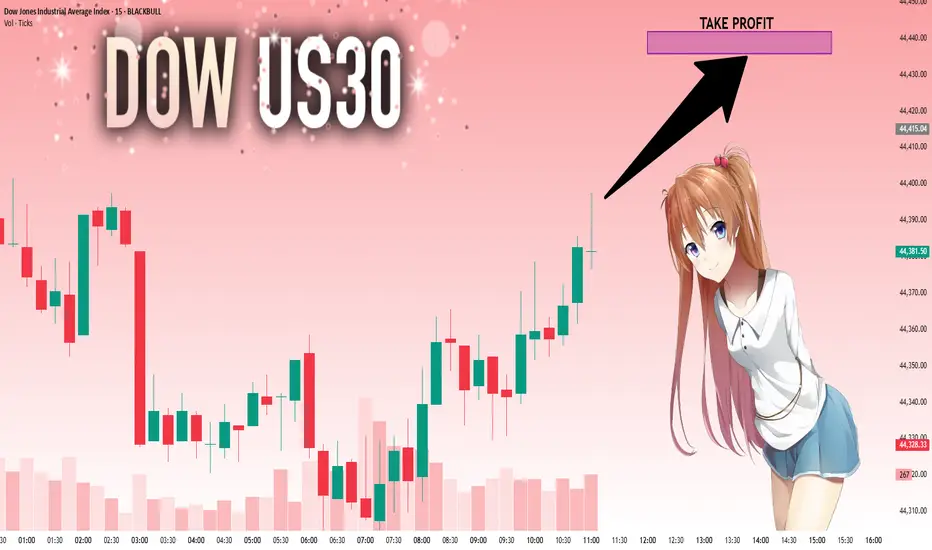
US30: Move Up Expected! Long!
My dear friends,
Today we will analyse US30 together☺️
The in-trend continuation seems likely as the current long-term trend appears to be strong, and price is holding above a key level of 44,393.91 So a bullish continuation seems plausible, targeting the next high. We should enter on confirmation, and place a stop-loss beyond the recent swing level.
❤️Sending you lots of Love and Hugs❤️
GOLD: Local Bullish Bias! Long!
My dear friends,
Today we will analyse GOLD together☺️
The market is at an inflection zone and price has now reached an area around 3,324.79 where previous reversals or breakouts have occurred.And a price reaction that we are seeing on multiple timeframes here could signal the next move up so we can enter on confirmation, and target the next key level of 3,330.13.Stop-loss is recommended beyond the inflection zone.
❤️Sending you lots of Love and Hugs❤️

EURUSD: Absolute Price Collapse Ahead! Short!
My dear friends,
Today we will analyse EURUSD together☺️
The price is near a wide key level
and the pair is approaching a significant decision level of 1.17309 Therefore, a strong bearish reaction here could determine the next move down.We will watch for a confirmation candle, and then target the next key level of 1.17241..Recommend Stop-loss is beyond the current level.
❤️Sending you lots of Love and Hugs❤️

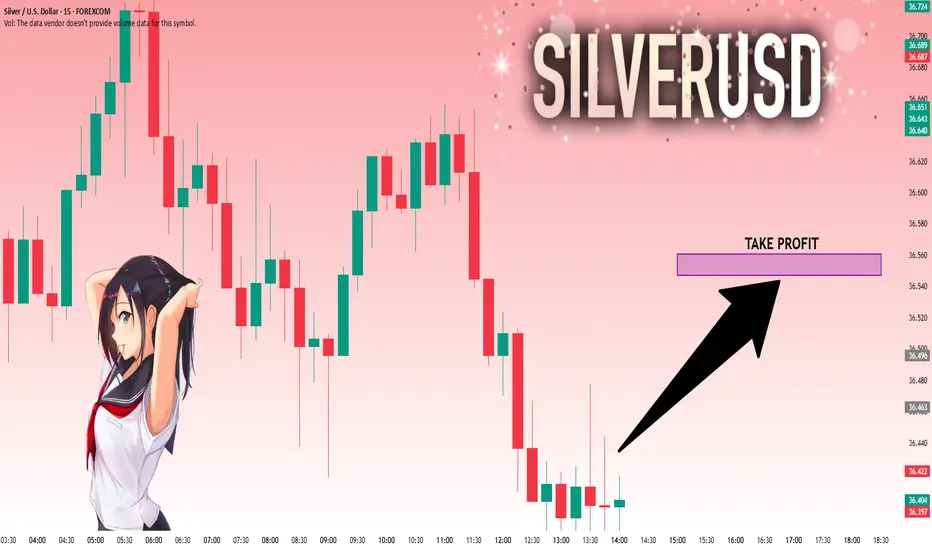
SILVER: Will Go Down! Short!
My dear friends,
Today we will analyse SILVER together☺️
The recent price action suggests a shift in mid-term momentum. A break below the current local range around 36.619 will confirm the new direction downwards with the target being the next key level of 36.530 .and a reconvened placement of a stop-loss beyond the range.
❤️Sending you lots of Love and Hugs❤️

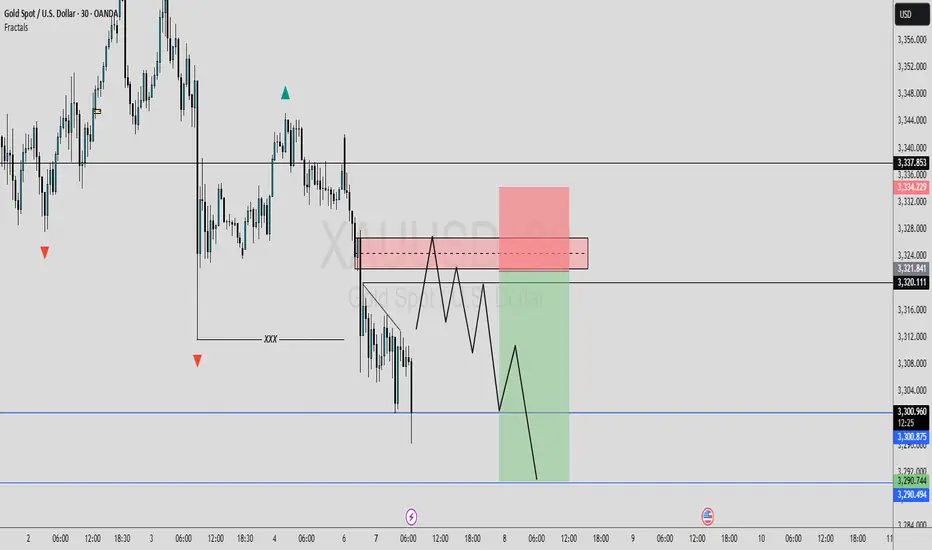
POSSIBLE BEARISH MOVE SCENERIO Currently we're monitoring 30M time frame chart. I’m expecting a sell move from the P.O.I zone marked on the chart. Since today is the first day of the week, the market volume is a bit low. Now let's see when the price reaches our P.O.I zone, and once it does, how the price behaves. We'll be watching for any bearish signs or confirmations. We’ll only enter the trade after getting a proper bearish confirmation. We'll also wait for the NY session to open before making any decisions. Let's see how this trade setup plays out.
Let's delve deeper into these levels and potential outcomes.
Always use stoploss for your trade.
Always use proper money management and proper risk to reward ratio.
#GOLD 30M Technical Analysis Expected Move.
EUR_USD LOCAL REBOUND|LONG|
✅EUR_USD has retested a key support level of 1.1690
And as the pair is already making a bullish rebound
A move up to retest the supply level above at 1.1744 is likely
LONG🚀
✅Like and subscribe to never miss a new idea!✅
Disclosure: I am part of Trade Nation's Influencer program and receive a monthly fee for using their TradingView charts in my analysis.

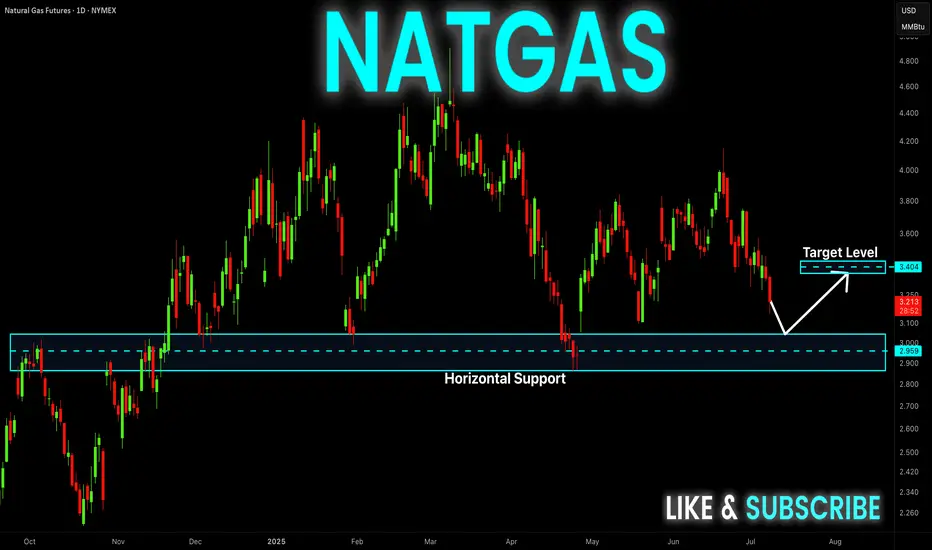
NATGAS Support Ahead! Buy!
Hello,Traders!
NATGAS keeps falling but
The price will soon hit a
Horizontal support of 2.90$
From where we will be expecting
A local bullish rebound
Buy!
Comment and subscribe to help us grow!
Check out other forecasts below too!
Disclosure: I am part of Trade Nation's Influencer program and receive a monthly fee for using their TradingView charts in my analysis.
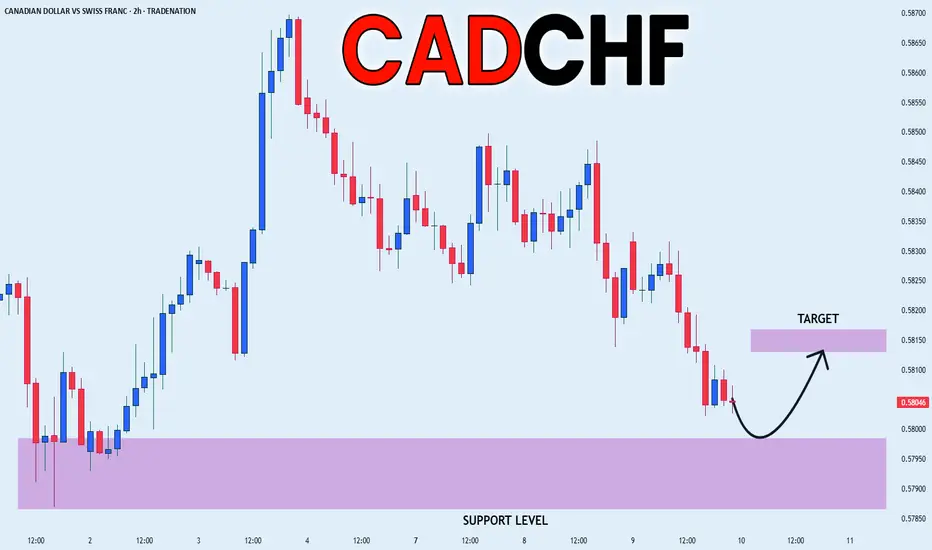
CAD_CHF STRONG SUPPORT|LONG|
✅CAD_CHF has been falling recently
And the pair seems locally oversold
So as the pair is approaching a
Horizontal support of 0.5790
Price growth is to be expected
LONG🚀
✅Like and subscribe to never miss a new idea!✅
Disclosure: I am part of Trade Nation's Influencer program and receive a monthly fee for using their TradingView charts in my analysis.
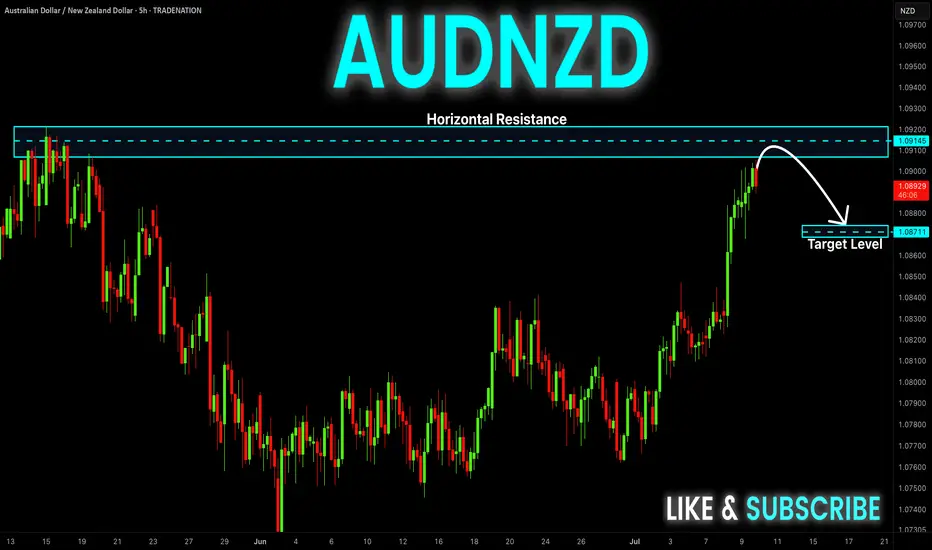
AUD-NZD Short From Resistance! Sell!
Hello,Traders!
AUD-NZD keeps growing
And the pair is overbought
So after it hits the horizontal
Resistance of 1.0921 from
Where we will be expecting
A local bearish correction
Sell!
Comment and subscribe to help us grow!
Check out other forecasts below too!
Disclosure: I am part of Trade Nation's Influencer program and receive a monthly fee for using their TradingView charts in my analysis.
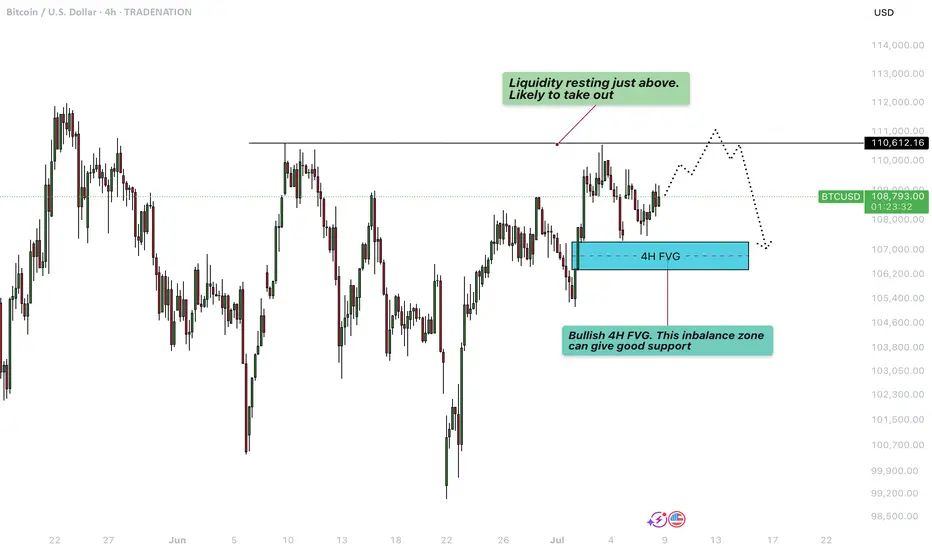
Bitcoin - Liquidity grab at $111.000?This 4-hour BTCUSD chart illustrates a potential short-term bullish continuation scenario followed by a deeper retracement, highlighting key liquidity levels and an important Fair Value Gap (FVG) support zone.
Liquidity sweep
At the top of the current price action, just above the $110,612.16 level, there is a clear area of resting liquidity. This zone has likely accumulated a significant number of stop-loss orders from traders who are shorting the market or who went long earlier and are protecting profits below previous highs. The market tends to seek liquidity to fill institutional orders, making this zone a high-probability target for a sweep. As a result, price is likely to take out these resting stop orders in a quick upward move, often referred to as a "liquidity grab" or "stop hunt", before potentially reversing or consolidating.
Bullish 4H FVG
Following this liquidity sweep, the chart suggests a retracement into a bullish 4-hour Fair Value Gap (FVG) located around the $106,600 to $107,400 region. This imbalance zone was formed during an impulsive move up, leaving behind a gap between the wicks of consecutive candles. Such gaps represent areas where demand previously overwhelmed supply, and they often act as strong support on a retest. If price revisits this zone, it is expected to offer support and could serve as a base for another upward push, assuming bullish momentum remains intact.
Downside risk
However, if the bullish FVG fails to hold as support and price breaks down through this imbalance zone, it would signal a weakening of bullish structure. In that case, the breakdown would likely lead to a deeper correction or even a trend reversal, with price seeking lower levels of support further down the chart. This would invalidate the short-term bullish scenario and suggest that sellers are gaining control, possibly triggering further liquidations and more aggressive selling pressure.
Conclusion
Overall, the chart is currently leaning bullish, anticipating a liquidity sweep to the upside followed by a potential pullback into the FVG. The reaction at the FVG will be critical in determining whether the market can continue higher or if it shifts into a deeper bearish correction.
Disclosure: I am part of Trade Nation's Influencer program and receive a monthly fee for using their TradingView charts in my analysis.
Thanks for your support.
- Make sure to follow me so you don't miss out on the next analysis!
- Drop a like and leave a comment!
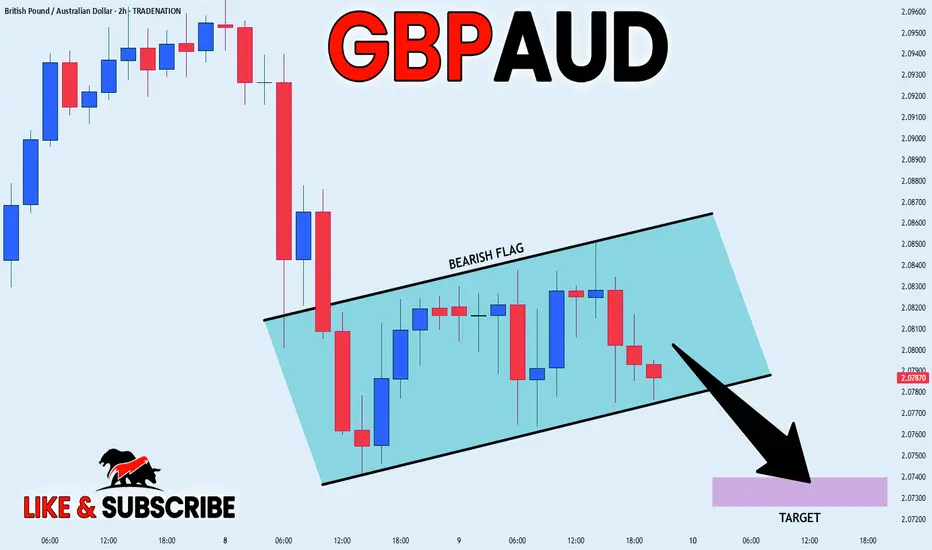
GBP_AUD BEARISH FLAG|SHORT|
✅GBP_AUD is going down now
And the pair has formed
A bearish flag pattern
Which makes me bearish biased
And after the breakout
I believe we will see bearish continuation
SHORT🔥
✅Like and subscribe to never miss a new idea!✅
Disclosure: I am part of Trade Nation's Influencer program and receive a monthly fee for using their TradingView charts in my analysis.
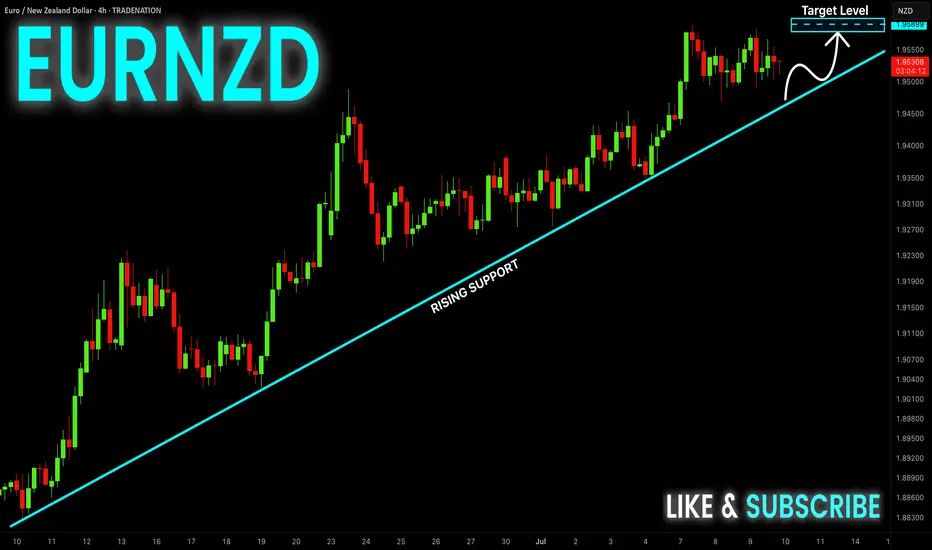
EUR-NZD Strong Uptrend! Buy!
Hello,Traders!
EUR-NZD is trading in a
Strong uptrend along the
Rising support so we are
Bullish biased and we will
Be expecting a further
Bullish move up
Buy!
Comment and subscribe to help us grow!
Check out other forecasts below too!
Disclosure: I am part of Trade Nation's Influencer program and receive a monthly fee for using their TradingView charts in my analysis.
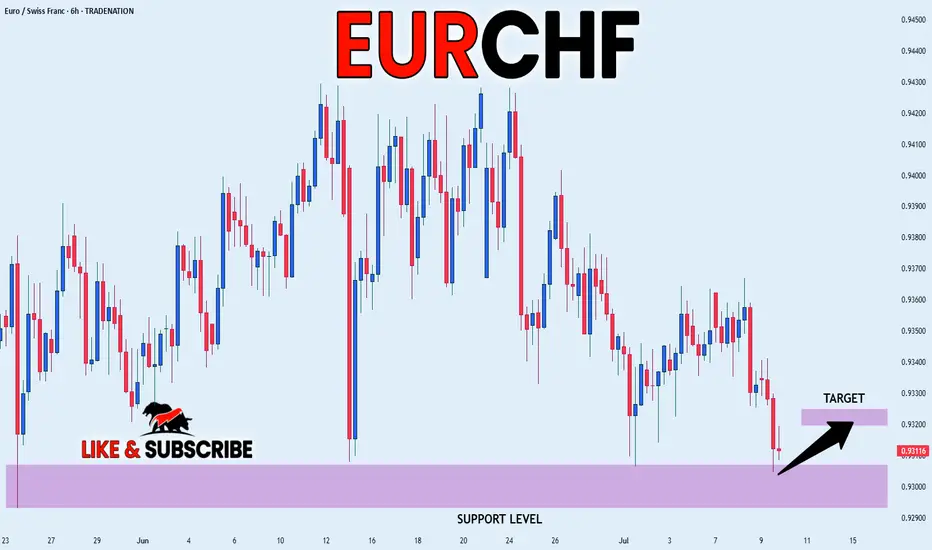
EUR_CHF SUPPORT AHEAD|LONG|
✅EUR_CHF is going down now
But a strong support level is ahead at 0.9293
Thus I am expecting a rebound
And a move up towards the target of 0.9320
LONG🚀
✅Like and subscribe to never miss a new idea!✅
Disclosure: I am part of Trade Nation's Influencer program and receive a monthly fee for using their TradingView charts in my analysis.
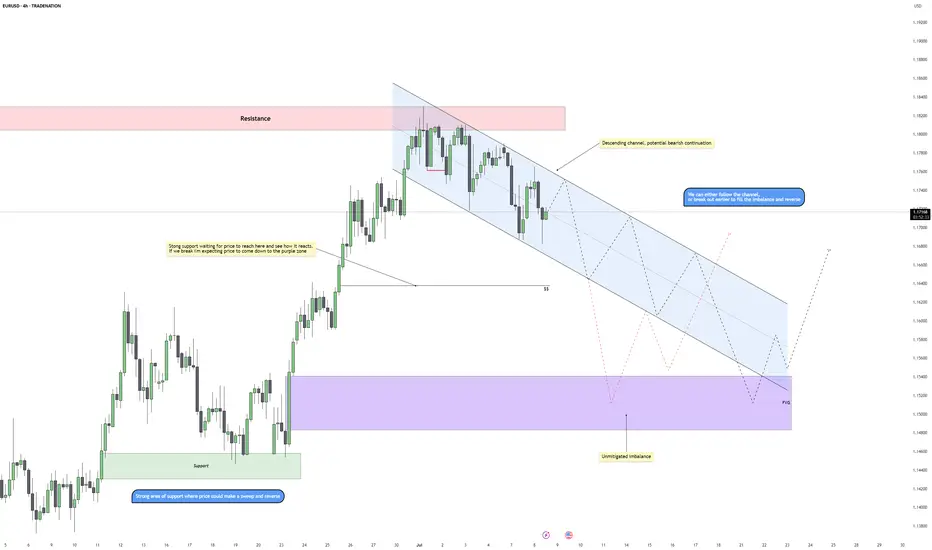
EURUSD - Compression Before Expansion? Key Reversal ZoneEURUSD is currently trading within a clear descending channel after rejecting a key resistance area. This move signals a shift in short-term sentiment, with bearish momentum guiding price action lower. The channel structure is intact, and as long as price respects this slope, lower levels remain in play.
Rejection From Resistance
After tapping into the major resistance zone, price failed to break higher and began forming lower highs and lower lows, confirming seller control. The rejection was clean and initiated the current bearish structure, which now serves as a roadmap for potential continuation lower.
Imbalance and Downside Targets
Below current price, there’s a visible imbalance that remains unfilled within the highlighted purple zone. This area acts as a magnet for price, especially if the bearish structure continues. A drop into this zone would align with a textbook move to fill inefficiency before a potential reversal can occur.
Support Structure and Liquidity Zone
There’s a strong support level marked just above the imbalance, which may offer a temporary reaction or even serve as a springboard for a reversal. This is also a likely liquidity pool, and a sweep of these lows could generate the fuel needed for a bullish move back toward mid-channel or even higher.
Projection and Scenarios
Price may either continue respecting the channel boundaries with stair-step retracements down into the imbalance, or break structure early with a more aggressive reversal once the inefficiency is filled. A deeper move into the purple zone followed by a reaction would suggest a potential shift in momentum.
Conclusion
The pair remains in a bearish corrective phase for now, with room to dip further into the unmitigated imbalance. Watch for how price reacts at support and whether a clean sweep and reversal setup presents itself. Until then, the channel remains the dominant structure guiding this move.
Disclosure: I am part of Trade Nation's Influencer program and receive a monthly fee for using their TradingView charts in my analysis.
___________________________________
Thanks for your support!
If you found this idea helpful or learned something new, drop a like 👍 and leave a comment, I’d love to hear your thoughts! 🚀
DXY: The Market Is Looking Down! Short!
My dear friends,
Today we will analyse DXY together☺️
The in-trend continuation seems likely as the current long-term trend appears to be strong, and price is holding below a key level of 97.054 So a bearish continuation seems plausible, targeting the next low. We should enter on confirmation, and place a stop-loss beyond the recent swing level.
❤️Sending you lots of Love and Hugs❤️

GOLD: Strong Bearish Sentiment! Short!
My dear friends,
Today we will analyse GOLD together☺️
The market is at an inflection zone and price has now reached an area around 3,311.90 where previous reversals or breakouts have occurred.And a price reaction that we are seeing on multiple timeframes here could signal the next move down so we can enter on confirmation, and target the next key level of 3,301.31..Stop-loss is recommended beyond the inflection zone.
❤️Sending you lots of Love and Hugs❤️
SILVER: Bulls Are Winning! Long!
My dear friends,
Today we will analyse SILVER together☺️
The price is near a wide key level
and the pair is approaching a significant decision level of 36.433 Therefore, a strong bullish reaction here could determine the next move up.We will watch for a confirmation candle, and then target the next key level of 36.547.Recommend Stop-loss is beyond the current level.
❤️Sending you lots of Love and Hugs❤️
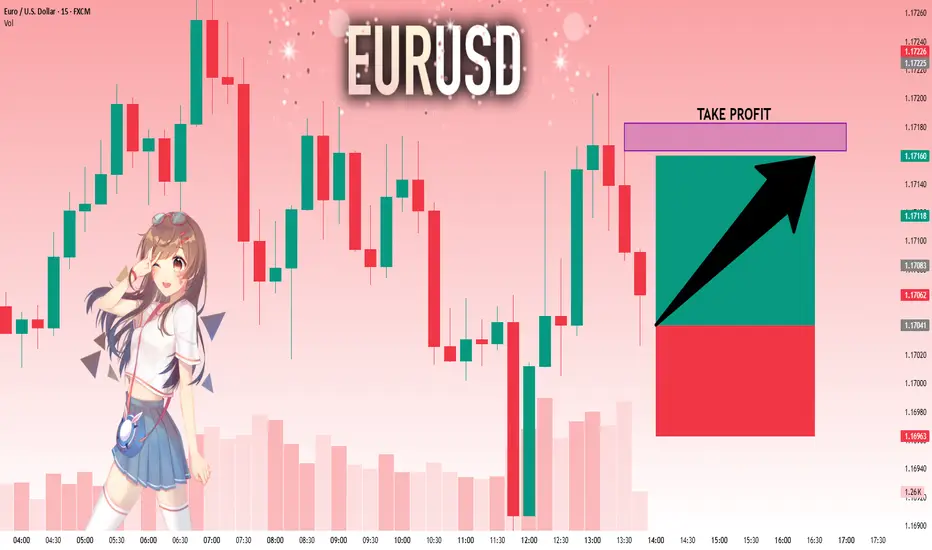
EURUSD: Next Move Is Up! Long!
My dear friends,
Today we will analyse EURUSD together☺️
The recent price action suggests a shift in mid-term momentum. A break above the current local range around 1.17041 will confirm the new direction upwards with the target being the next key level of 1.17163 and a reconvened placement of a stop-loss beyond the range.
❤️Sending you lots of Love and Hugs❤️
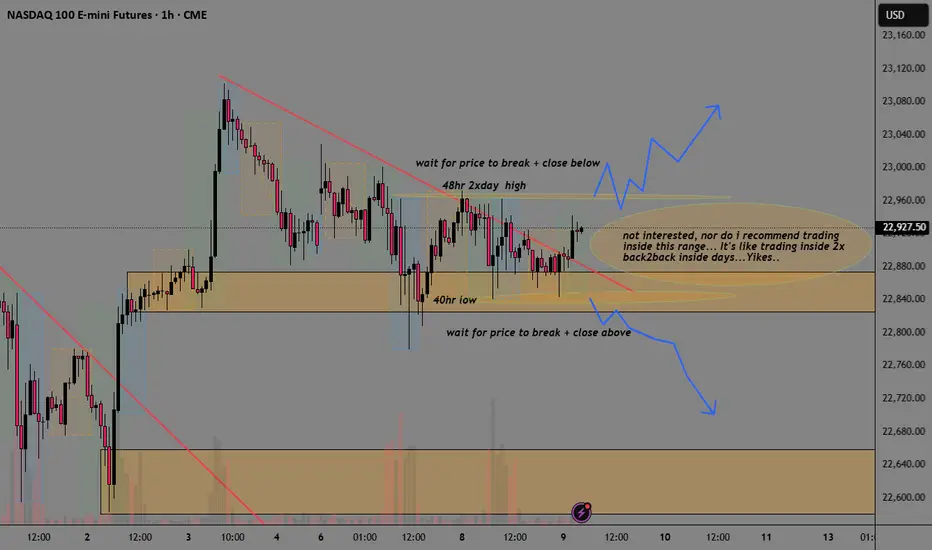
NQ Analysis ICT Liquidity Search Break-Out TradePrice is expected to open not just 1, but inside 2 previous days.
We have 2 options:
1) ICT silver bullet up my bum trader strategy traders are waiting
for liquidity search breaking highs or lows then reversing.
2) Break-out trades waiting for price to break and close above or below
24hour range and trade in direction of break-out.
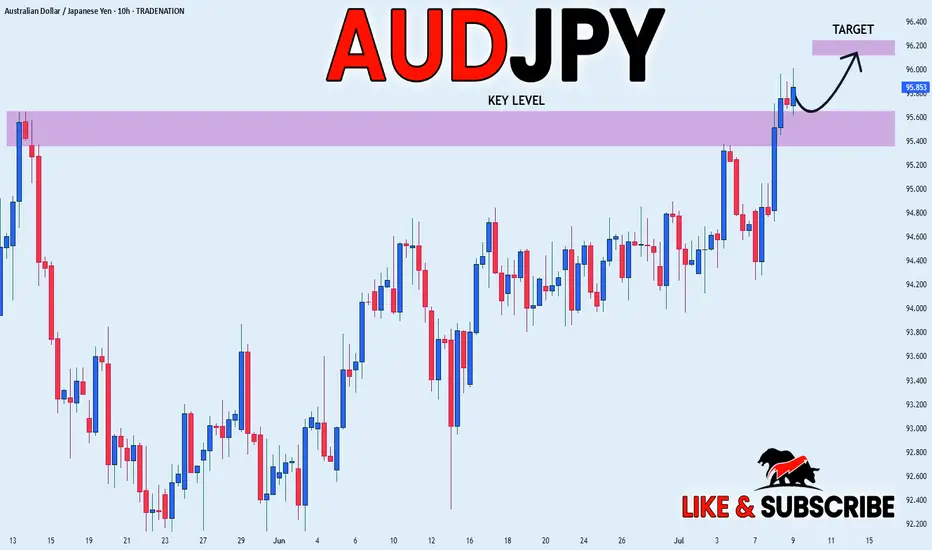
AUD_JPY WILL KEEP GROWING|LONG|
✅AUD_JPY is going up
Now and the pair made a bullish
Breakout of the key horizontal
Level of 95.600 and the breakout
Is confirmed so we are bullish
Biased and further growth
Is to be expected
LONG🚀
✅Like and subscribe to never miss a new idea!✅
Disclosure: I am part of Trade Nation's Influencer program and receive a monthly fee for using their TradingView charts in my analysis.
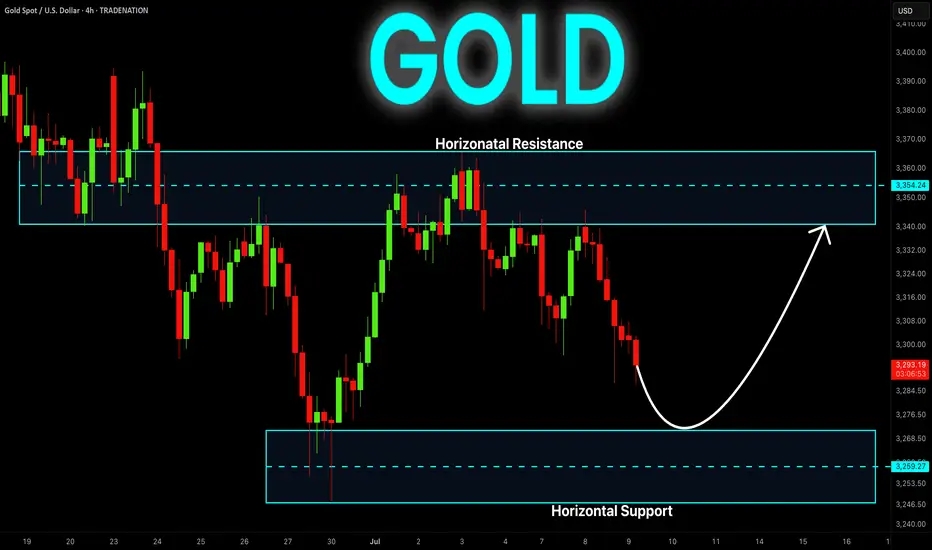
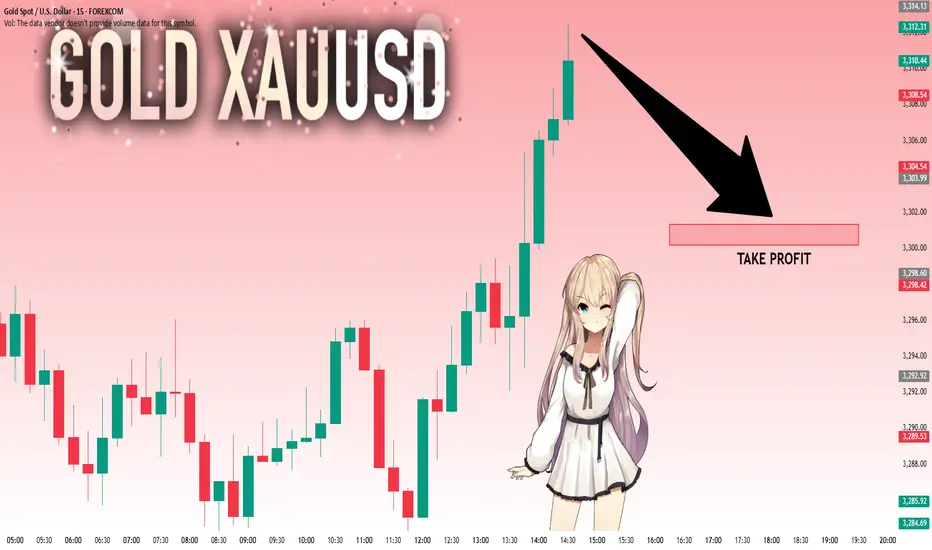
GOLD Long Inside The Range! Buy!
Hello,Traders!
GOLD is stuck in a local
Range while still trading
In a strong long-term uptrend
So we think that this is an
Accumulation before the
Next leg up and as we are
Bullish biased we will be
Expecting a retest and a
Rebound from the horizontal
Support below around 3259$
With the target of retesting
The horizontal resistance
Above around 3354$
Buy!
Comment and subscribe to help us grow!
Check out other forecasts below too!
Disclosure: I am part of Trade Nation's Influencer program and receive a monthly fee for using their TradingView charts in my analysis.