DXY LOCAL SHORT|
✅DXY is about to retest a key structure level of 98.000
Which implies a high likelihood of a move down
As some market participants will be taking profit from long positions
While others will find this price level to be good for selling
So as usual we will have a chance to ride the wave of a bearish correction
SHORT🔥
✅Like and subscribe to never miss a new idea!✅
Disclosure: I am part of Trade Nation's Influencer program and receive a monthly fee for using their TradingView charts in my analysis.
Ict
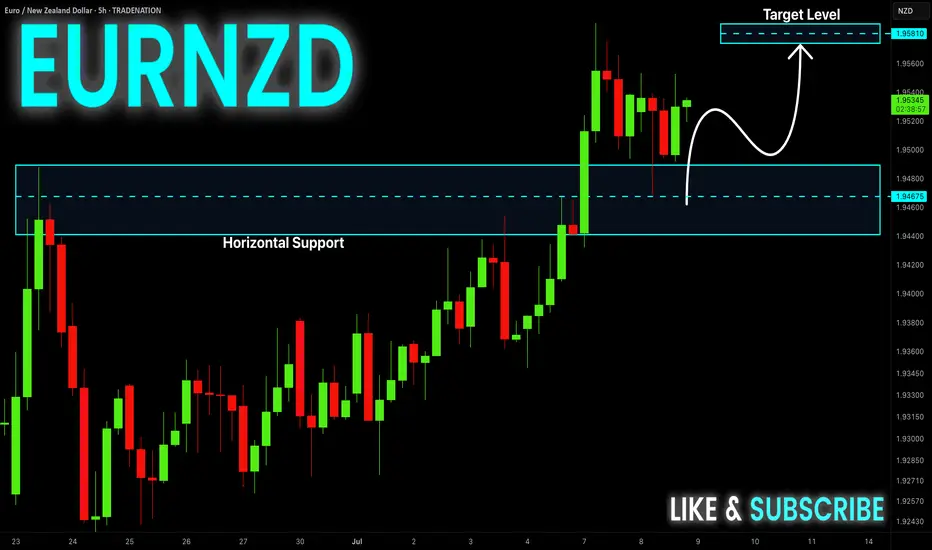
EUR-NZD Will Keep Growing! Buy!
Hello,Traders!
EUR-NZD keeps growing in a
Strong uptrend and the pair
Made a retest and a rebound
From the horizontal support
Of 1.9480 so we are bullish
Biased and we will be expecting
A further bullish move up
Buy!
Comment and subscribe to help us grow!
Check out other forecasts below too!
Disclosure: I am part of Trade Nation's Influencer program and receive a monthly fee for using their TradingView charts in my analysis.
DAX: Target Is Up! Long!
My dear friends,
Today we will analyse DAX together☺️
The in-trend continuation seems likely as the current long-term trend appears to be strong, and price is holding above a key level of 24,193.11 So a bullish continuation seems plausible, targeting the next high. We should enter on confirmation, and place a stop-loss beyond the recent swing level.
❤️Sending you lots of Love and Hugs❤️

GOLD: Move Up Expected! Long!
My dear friends,
Today we will analyse GOLD together☺️
The market is at an inflection zone and price has now reached an area around 3,298.60 where previous reversals or breakouts have occurred.And a price reaction that we are seeing on multiple timeframes here could signal the next move up so we can enter on confirmation, and target the next key level of 3,312.65.Stop-loss is recommended beyond the inflection zone.
❤️Sending you lots of Love and Hugs❤️
SILVER: Local Bearish Bias! Short!
My dear friends,
Today we will analyse SILVER together☺️
The price is near a wide key level
and the pair is approaching a significant decision level of 36.435 Therefore, a strong bearish reaction here could determine the next move down.We will watch for a confirmation candle, and then target the next key level of 36.336..Recommend Stop-loss is beyond the current level.
❤️Sending you lots of Love and Hugs❤️

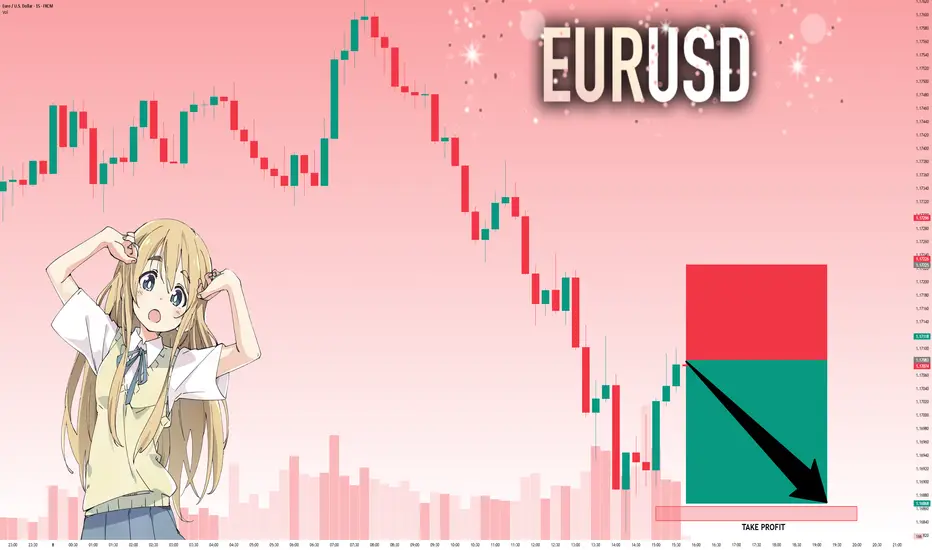
EURUSD: Absolute Price Collapse Ahead! Short!
My dear friends,
Today we will analyse EURUSD together☺️
The recent price action suggests a shift in mid-term momentum. A break below the current local range around 1.17083 will confirm the new direction downwards with the target being the next key level of 1.16863.and a reconvened placement of a stop-loss beyond the range.
❤️Sending you lots of Love and Hugs❤️
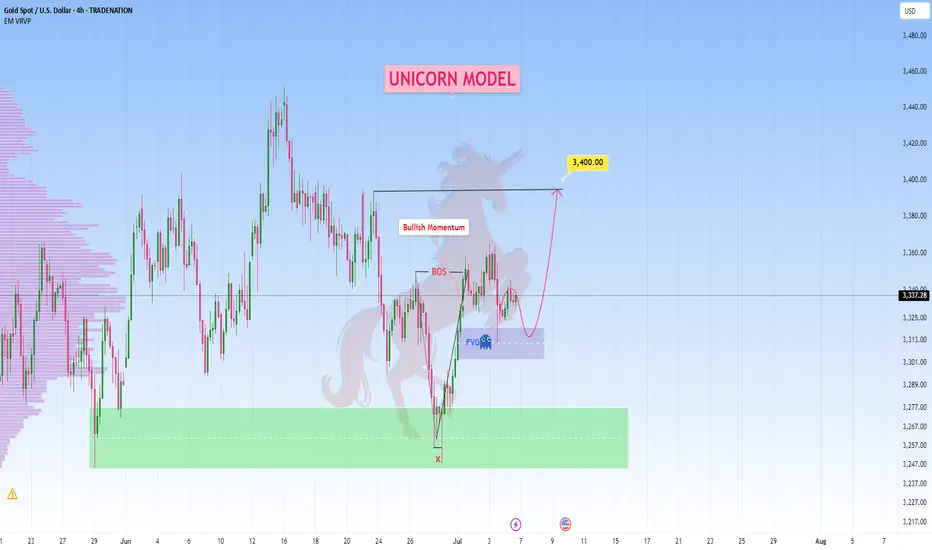
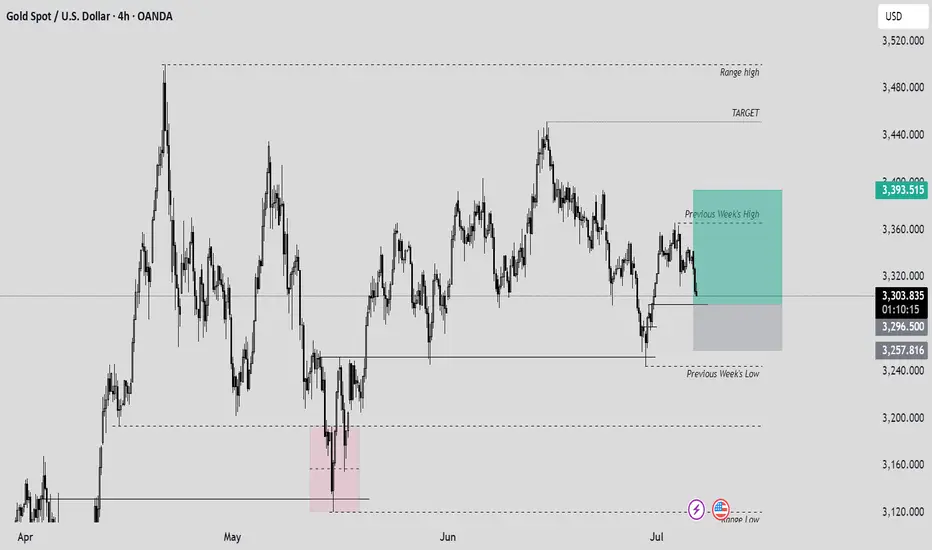
| ICT Unicorn model | The most potent concept spotted on GoldThe Unicorn model is considered by many traders to be one of the most refined and effective concepts within the ICT framework concepts because it brings together several core ideas into one powerful, repeatable setup. But what makes it so highly regarded as one of the best?
It’s the ability to stack multiple high-probability conditions: liquidity grabs, market structure shifts, fair value gaps, and optimal trade entry zones.
Unlike isolated concepts, the Unicorn model doesn’t rely on just one factor. It uses the synergy between time and price → waiting for manipulation first, then entering during the retracement into a fair value gap or order block.
This not only increases accuracy but allows for tight stops and high reward-to-risk ratios. Many traders rely on it exclusively because it’s both structured and versatile, making it easier to apply consistently across various market conditions.
How does this work:
You’ll see the price breaks a swing high, reverses, and creates a Breaker Block (failed order block) with a Fair Value Gap. These overlap to form the “Unicorn zone” → After that, price drops sharply, breaking the previous structure, indicating a shift in market direction → Price retraces, entering the overlapping zone → Traders look for rejections (candlestick patterns, wick spikes) as the entry signal→ With entry near the zone, the stop-loss is placed just beyond the Breaker Block or FVG.
Targets can be the next liquidity levels (e.g., recent lows). Many traders use 2:1 or 3:1 R:R, though targets can be higher.
In other words as a standalone strategy, the Unicorn model is highly effective , if, and only if, you have the correct daily bias. With a clear directional outlook, it becomes a complete and reliable setup.
Which in our case, on Gold it aligns perfectly.
Just sharing my thoughts for the charts, this isn’t financial advice. Always confirm your setups and manage your risk properly.
Disclosure: I am part of Trade Nation's Influencer program and receive a monthly fee for using their TradingView charts in my analysis.
EURO/USD SELL SETUP "Euro/USD Potential Sell Zone: Price approaching key resistance at 1.17634,to 1.17735 with a potential reversal in sight. Selling opportunity on the horizon? Target 1ratio 3 . Let's short the Euro! 📉💡 #EuroUSD #SellZone #ForexTrading"

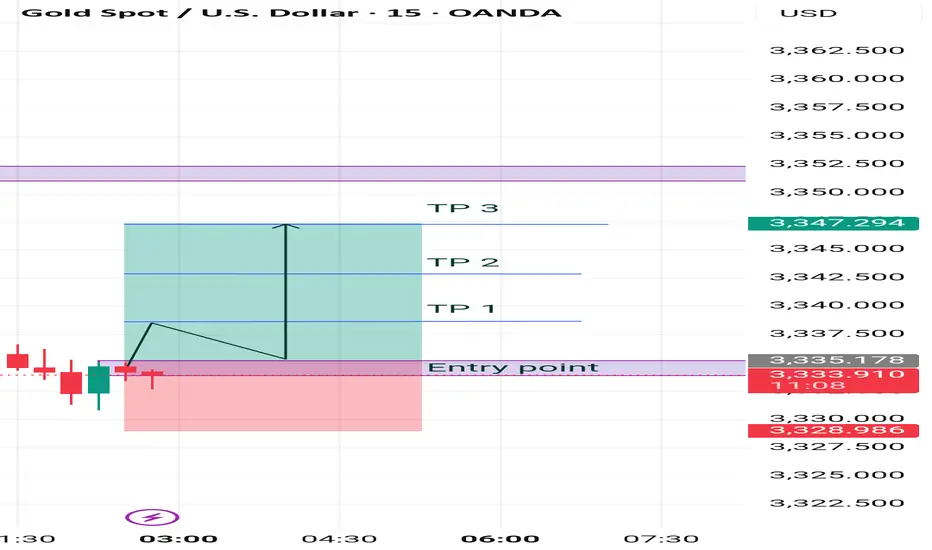
Gold bullish setup "Gold Buy Setup: Price is bouncing off key support at ,3333/3335 with a potential bullish reversal in play. Buying opportunity on the horizon
Gold buy level 3333/35
First target 🎯. 3338
Second target🎯 3342
Third target 🎯 3347
Guys leave comment what you think about this setup
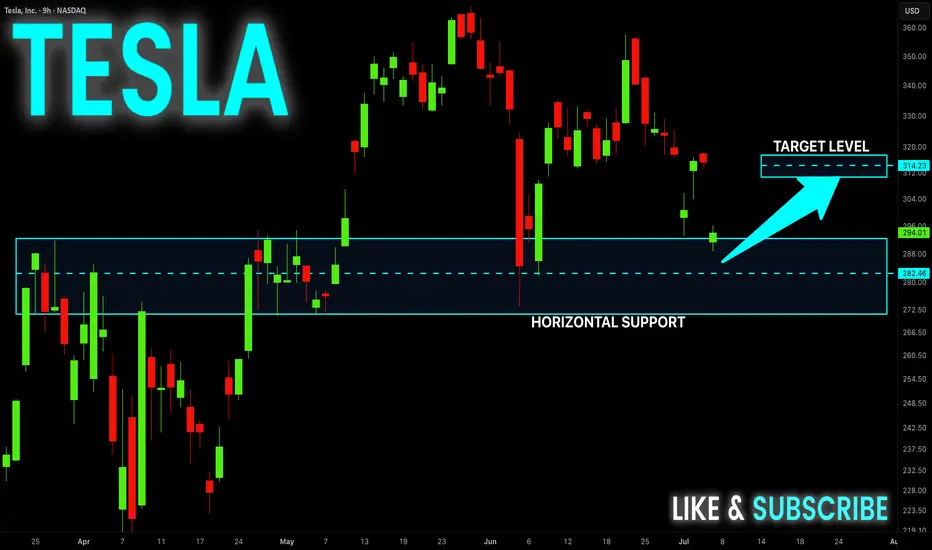
TESLA Reached The Support! Buy!
Hello,Traders!
TESLA gaped down on
Monday but the move was
Held up by a massive support
Area ending around 272$ and
As the support is strong we
Will be expecting a rebound and
A move up from the level
Buy!
Comment and subscribe to help us grow!
Check out other forecasts below too!
Disclosure: I am part of Trade Nation's Influencer program and receive a monthly fee for using their TradingView charts in my analysis.
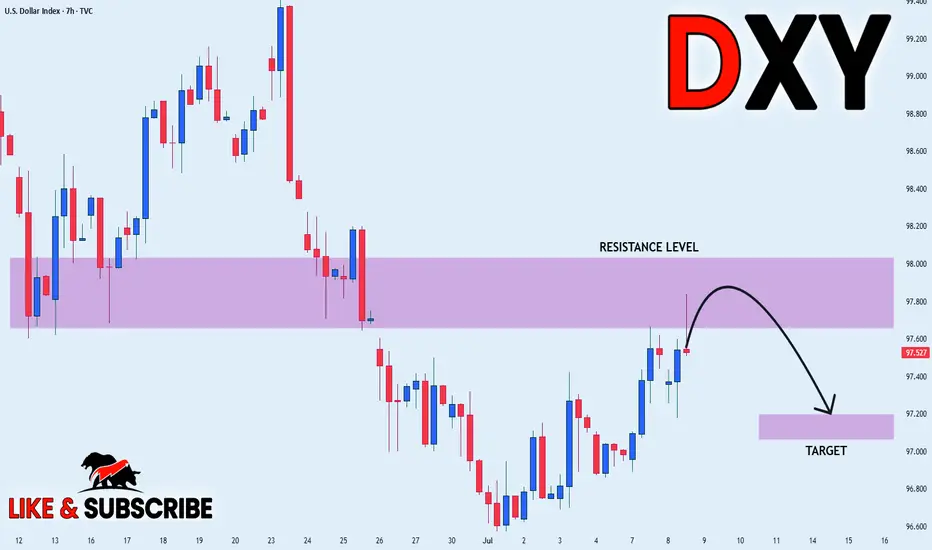
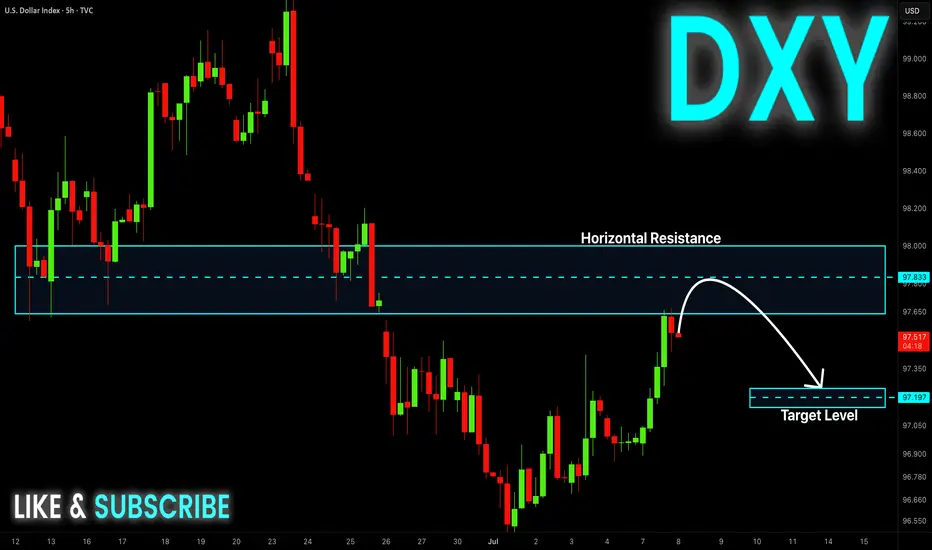
DXY Short From Resistance! Sell!
Hello,Traders!
DXY made a nice rebound
From the lows but will soon
Hit a horizontal resistance
Around 97.900 from where
We will be expecting a
Local bearish correction
Sell!
Comment and subscribe to help us grow!
Check out other forecasts below too!
Disclosure: I am part of Trade Nation's Influencer program and receive a monthly fee for using their TradingView charts in my analysis.
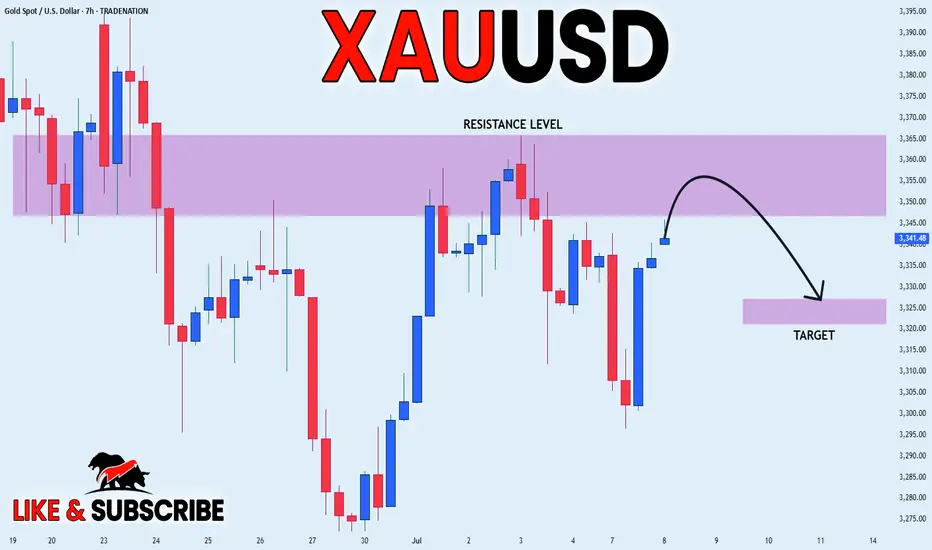
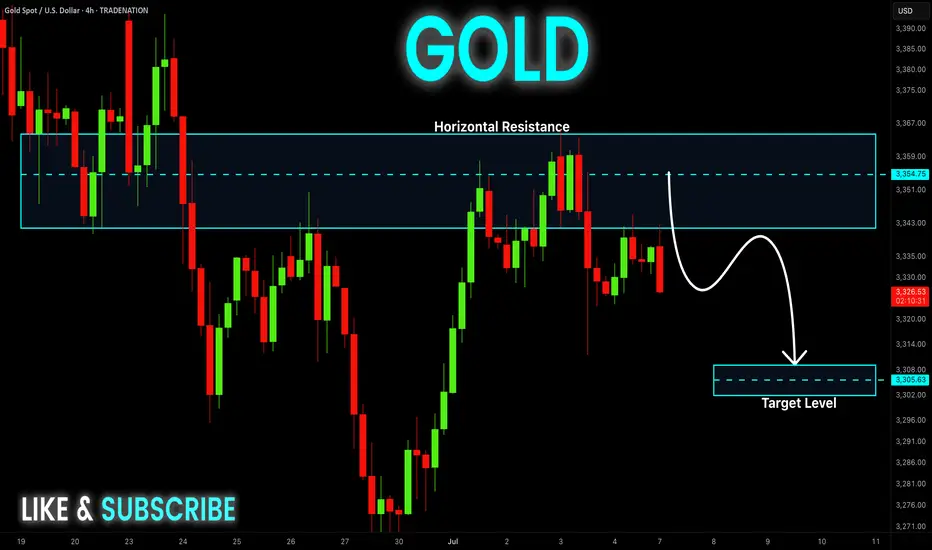
GOLD RESISTANCE AHEAD|SHORT|
✅GOLD is going up now
But a strong resistance level is ahead at 3360$
Thus I am expecting a pullback
And a move down towards the target of 3325$
SHORT🔥
✅Like and subscribe to never miss a new idea!✅
Disclosure: I am part of Trade Nation's Influencer program and receive a monthly fee for using their TradingView charts in my analysis.
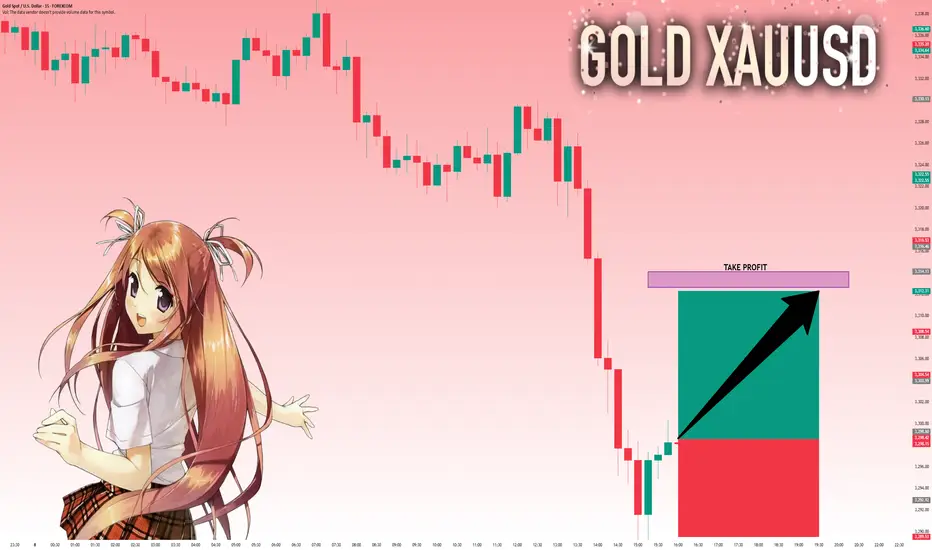
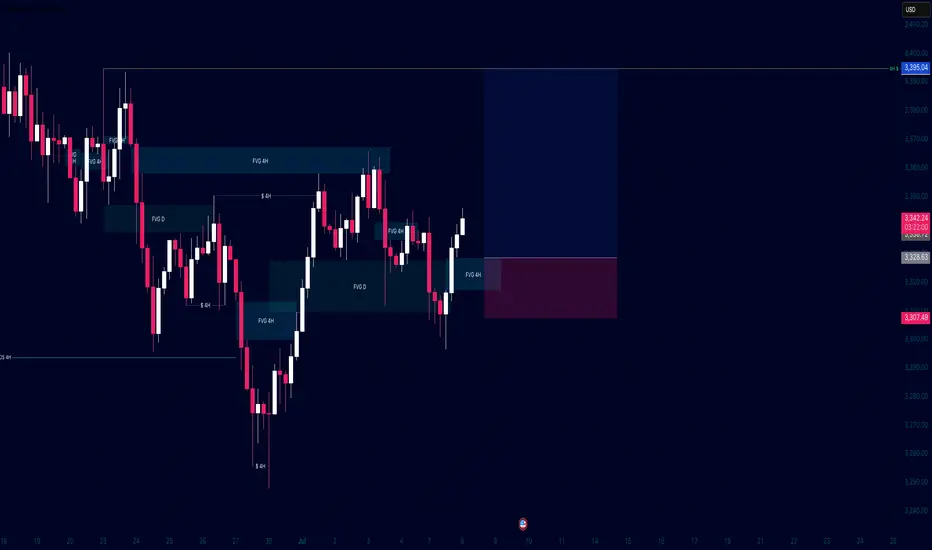
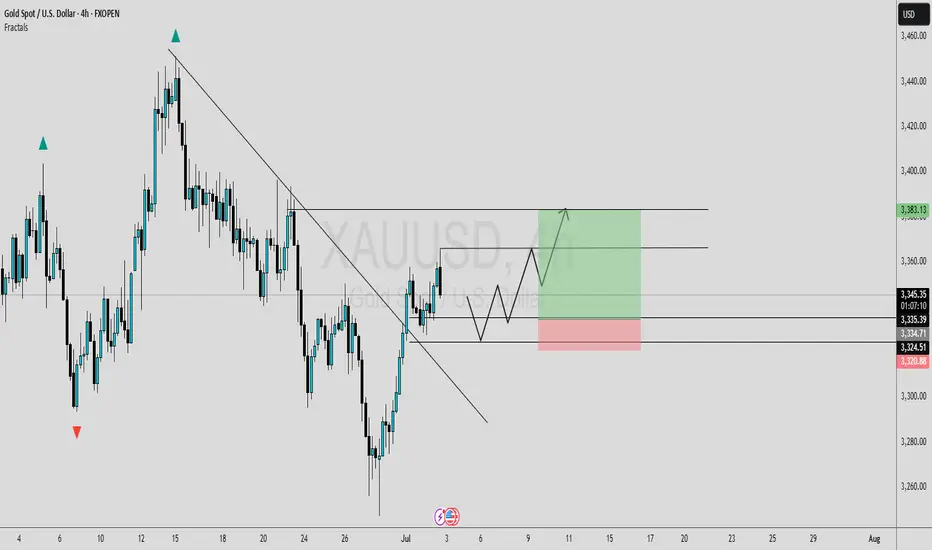
XAUUSD Short term Long ideaGold is in bearish market structure currently for long term but we might have a very good chance taking long trades valid for this week only.
The 4H structure shows IFVG formed Monday which is a strong bullish signal to reach the liquidity above, Once we reach the liquidity I will be shifting my trades to bearish.
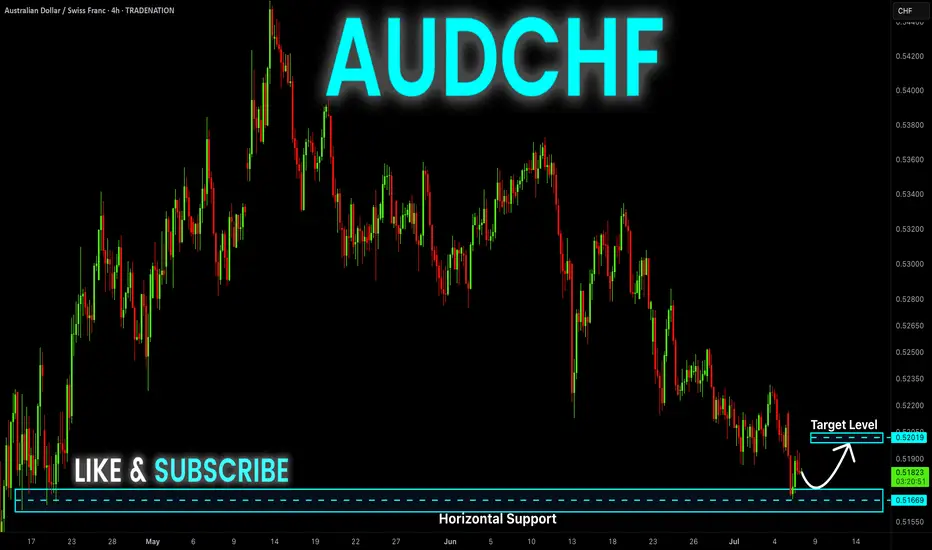
AUD-CHF Rebound Ahead! Buy!
Hello,Traders!
AUD-CHF keeps falling but
A horizontal support level
Is ahead around 0.5160
And as the pair is locally
Oversold we will be expecting
A local bullish rebound
Buy!
Comment and subscribe to help us grow!
Check out other forecasts below too!
Disclosure: I am part of Trade Nation's Influencer program and receive a monthly fee for using their TradingView charts in my analysis.
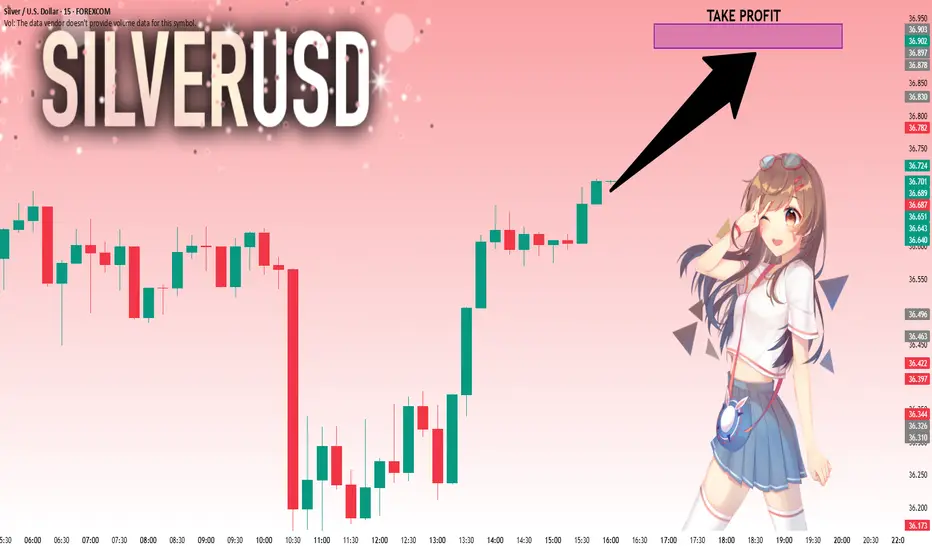
SILVER: Will Go Up! Long!
My dear friends,
Today we will analyse SILVER together☺️
The in-trend continuation seems likely as the current long-term trend appears to be strong, and price is holding above a key level of 36.696 So a bullish continuation seems plausible, targeting the next high. We should enter on confirmation, and place a stop-loss beyond the recent swing level.
❤️Sending you lots of Love and Hugs❤️
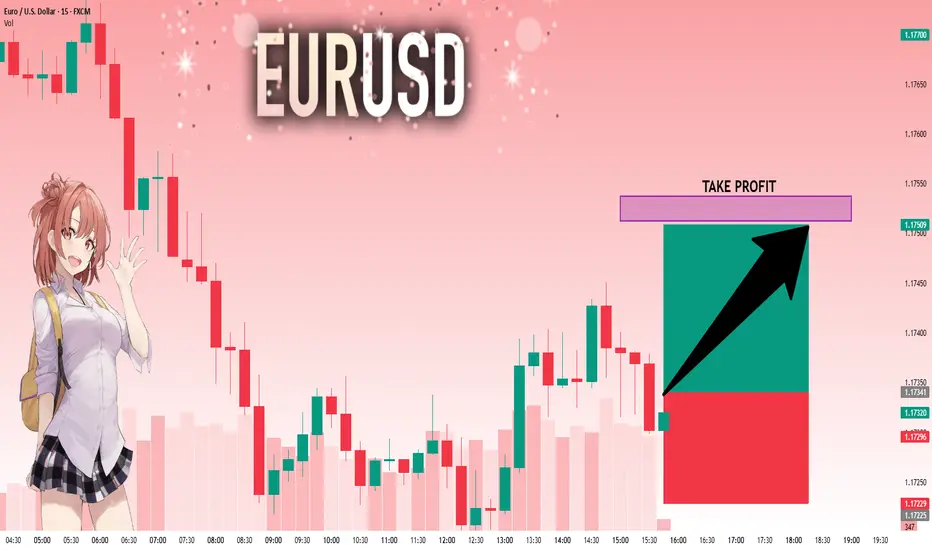
EURUSD: The Market Is Looking Up! Long!
My dear friends,
Today we will analyse EURUSD together☺️
The market is at an inflection zone and price has now reached an area around 1.17341 where previous reversals or breakouts have occurred.And a price reaction that we are seeing on multiple timeframes here could signal the next move up so we can enter on confirmation, and target the next key level of 1.17512.Stop-loss is recommended beyond the inflection zone.
❤️Sending you lots of Love and Hugs❤️
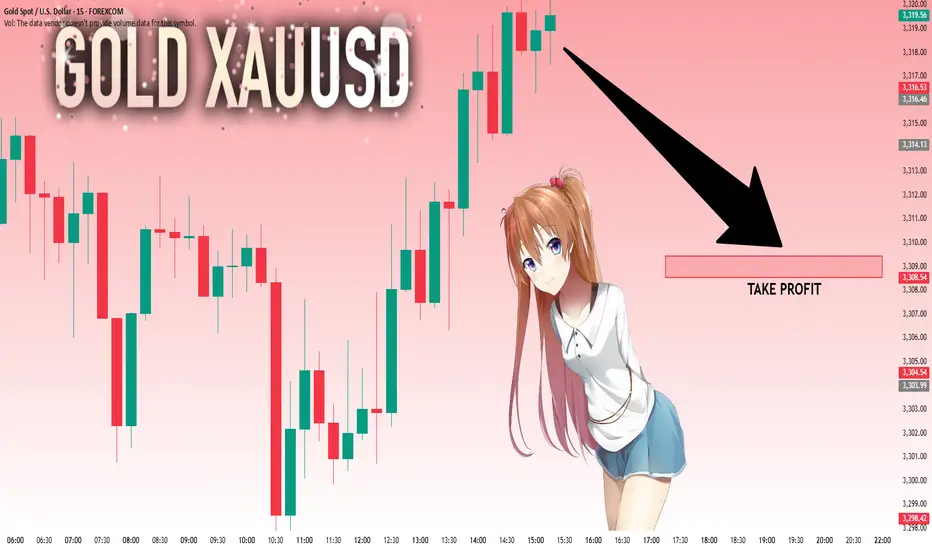
GOLD: Strong Bullish Sentiment! Long!
My dear friends,
Today we will analyse GOLD together☺️
The price is near a wide key level
and the pair is approaching a significant decision level of 3,317.31 Therefore, a strong bullish reaction here could determine the next move up.We will watch for a confirmation candle, and then target the next key level of 3,309.44.Recommend Stop-loss is beyond the current level.
❤️Sending you lots of Love and Hugs❤️
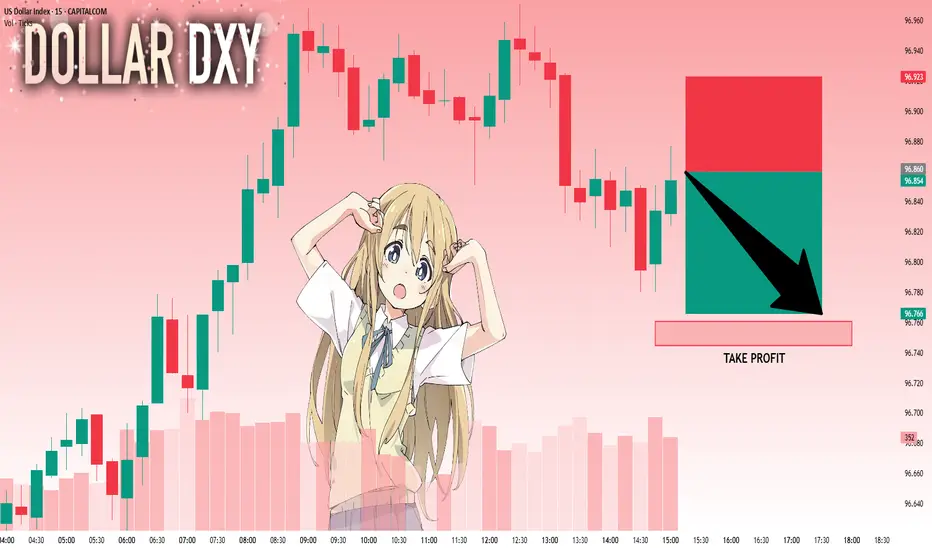
DXY: Bears Are Winning! Short!
My dear friends,
Today we will analyse DXY together☺️
The recent price action suggests a shift in mid-term momentum. A break below the current local range around 96.860 will confirm the new direction downwards with the target being the next key level of 96.760.and a reconvened placement of a stop-loss beyond the range.
❤️Sending you lots of Love and Hugs❤️
TRENDLINE BREAKOUT [LONG]In this analysis we're focusing on 4H timeframe. As we know that price move impulse toward upside and break trendline, now I'm waiting for retracement. Once price reach my zone and give any type of bullish confirmation than we'll execute our trade. This is a higher time frame analysis and key levels. Let's analyze more deeply into smaller time frame and potential outcomes.
Always use stoploss for your trade.
Always use proper money management and proper risk to reward ratio.
#XAUUSD 4H Technical Analysis Expected Move.
Framing a scalp.. ICT style.. The R2F way..In this short video I go through how I personally frame a trade using ICT concepts. We have the opportunity to see it pan out pretty quickly, which is always a nice thing.
- R2F Trading

GOLD Short From Resistance! Sell!
Hello,Traders!
GOLD is weaker than we
Expected and failed to break
The key horizontal level
Around 3360$ and we are
Now seeing a bearish rejection
So we are locally bearish biased
And we will be expecting a
Further bearish move down
Sell!
Comment and subscribe to help us grow!
Check out other forecasts below too!
Disclosure: I am part of Trade Nation's Influencer program and receive a monthly fee for using their TradingView charts in my analysis.
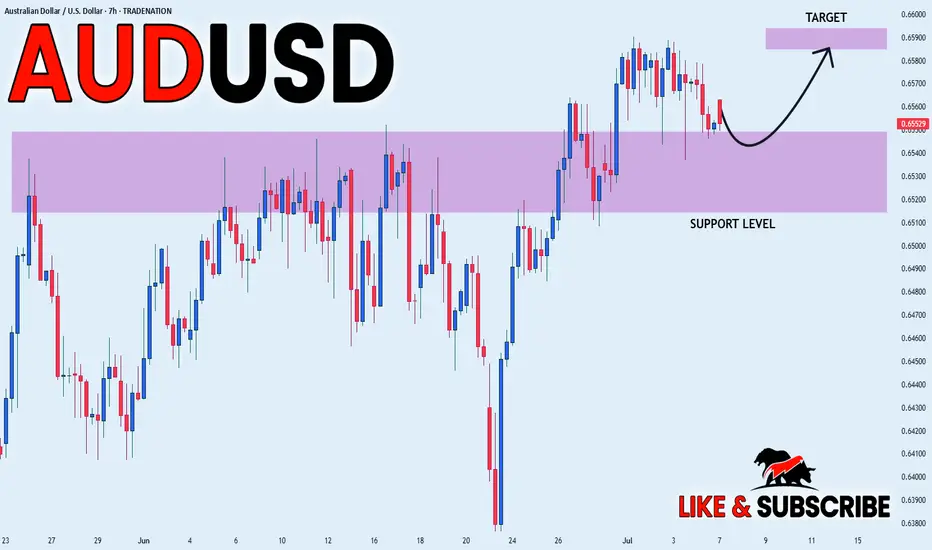
AUD_USD WILL GO UP|LONG|
✅AUD_USD has retested a key support level of 0.6540
And as the pair is already making a bullish rebound
A move up to retest the supply level above at 0.6584 is likely
LONG🚀
✅Like and subscribe to never miss a new idea!✅
Disclosure: I am part of Trade Nation's Influencer program and receive a monthly fee for using their TradingView charts in my analysis.