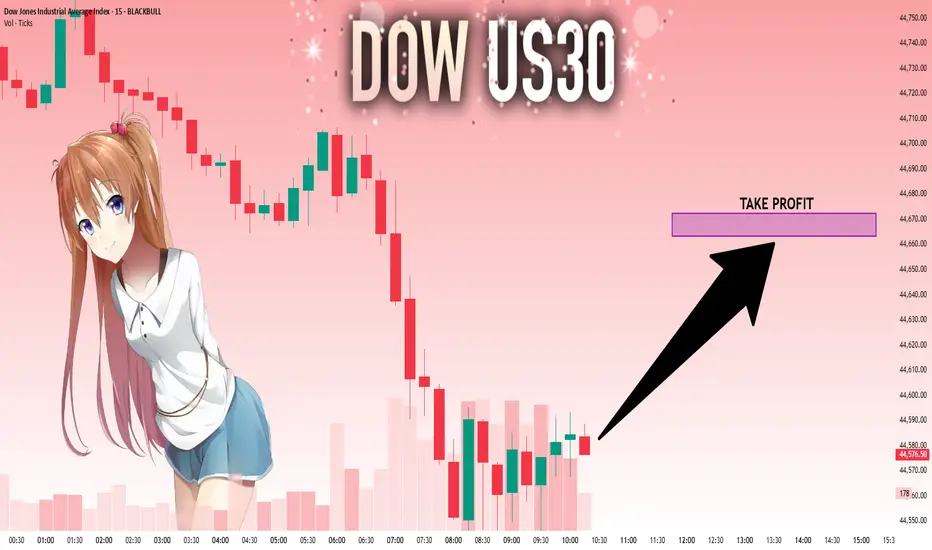
US30: Will Go Up! Long!
My dear friends,
Today we will analyse US30 together☺️
The market is at an inflection zone and price has now reached an area around 44,585.50 where previous reversals or breakouts have occurred.And a price reaction that we are seeing on multiple timeframes here could signal the next move up so we can enter on confirmation, and target the next key level of 44,663.28.Stop-loss is recommended beyond the inflection zone.
❤️Sending you lots of Love and Hugs❤️
Ict
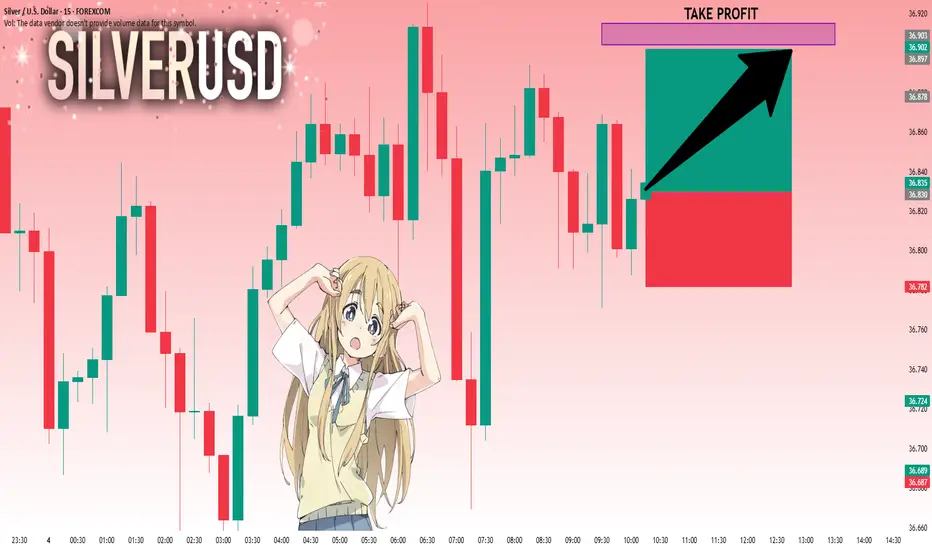
SILVER: The Market Is Looking Up! Long!
My dear friends,
Today we will analyse SILVER together☺️
The price is near a wide key level
and the pair is approaching a significant decision level of 36.830 Therefore, a strong bullish reaction here could determine the next move up.We will watch for a confirmation candle, and then target the next key level 36.903.Recommend Stop-loss is beyond the current level.
❤️Sending you lots of Love and Hugs❤️
EURUSD: Strong Bearish Sentiment! Short!
My dear friends,
Today we will analyse EURUSD together☺️
The recent price action suggests a shift in mid-term momentum. A break below the current local range around 1.17775 will confirm the new direction downwards with the target being the next key level of 1.17696.and a reconvened placement of a stop-loss beyond the range.
❤️Sending you lots of Love and Hugs❤️

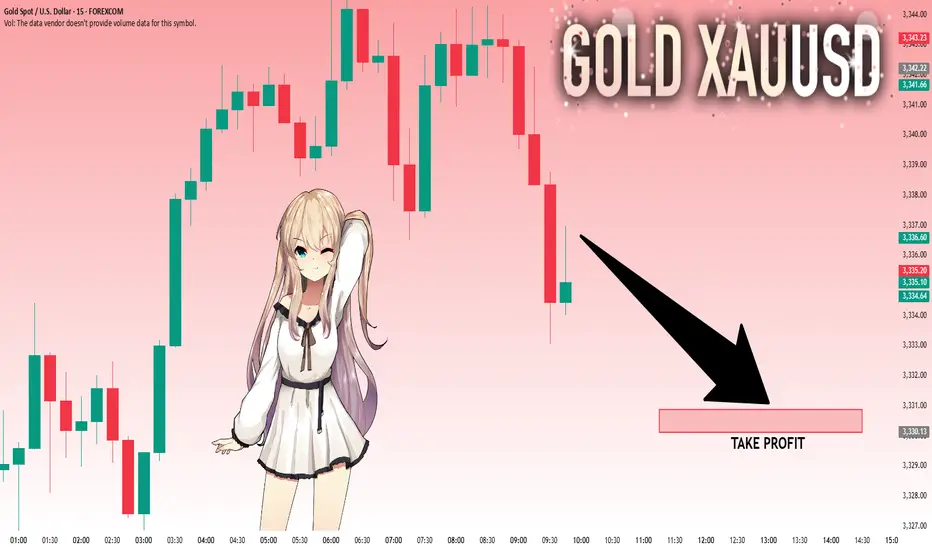
GOLD: Bears Are Winning! Short!
My dear friends,
Today we will analyse GOLD together☺️
The in-trend continuation seems likely as the current long-term trend appears to be strong, and price is holding below a key level of 3,336.61 So a bearish continuation seems plausible, targeting the next low. We should enter on confirmation, and place a stop-loss beyond the recent swing level.
❤️Sending you lots of Love and Hugs❤️
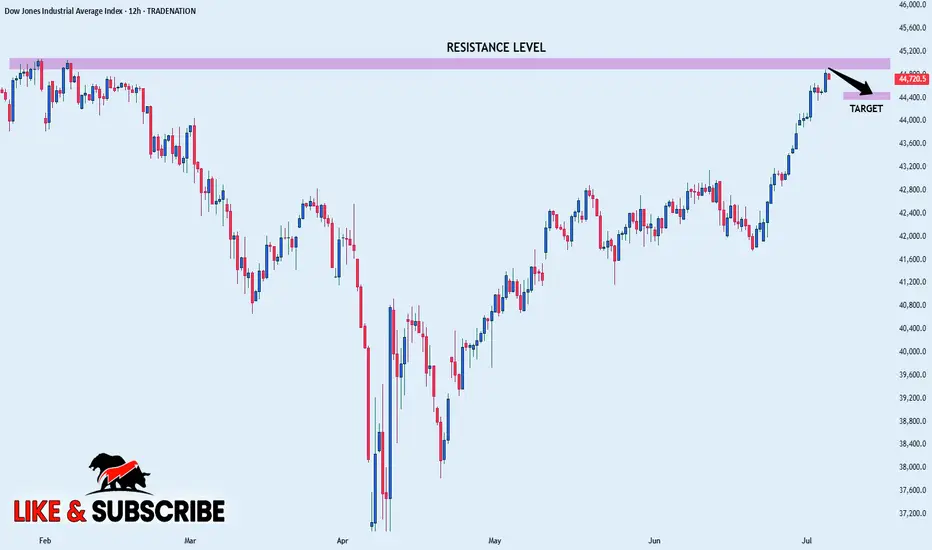
US30 SHORT FROM RESISTANCE|
✅DOW JONES is going up now
But a strong resistance level is ahead at 45,077
Thus I am expecting a pullback
And a move down towards the target of 44,500
SHORT🔥
✅Like and subscribe to never miss a new idea!✅
Disclosure: I am part of Trade Nation's Influencer program and receive a monthly fee for using their TradingView charts in my analysis.
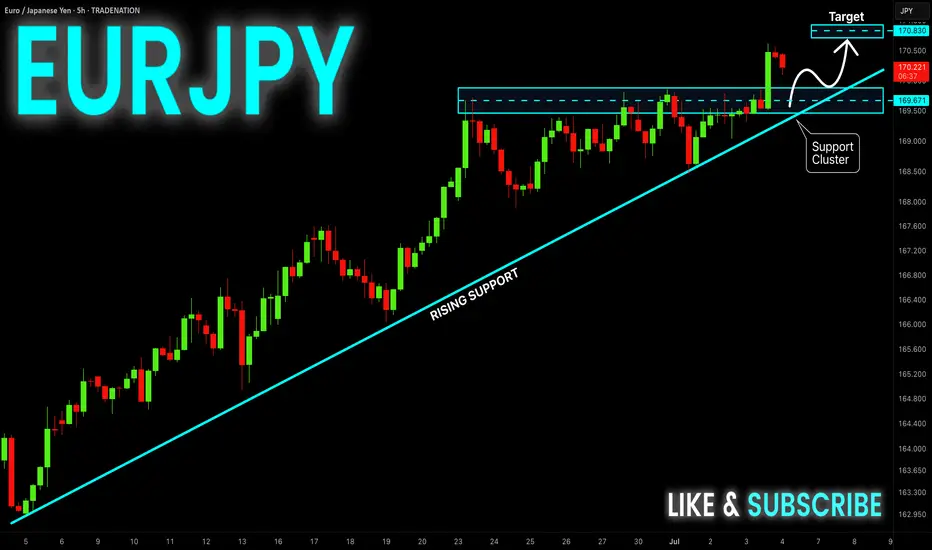
EUR-JPY Will Keep Growing! Buy!
Hello,Traders!
EUR-JPY is trading in an
Uptrend and the pair broke
The key horizontal level
Of 169.814 and the breakout
Is confirmed so after a potential
Retest of the support cluster
Of the rising and horizontal
Support lines below we will
Be expecting a bullish continuation
Buy!
Comment and subscribe to help us grow!
Check out other forecasts below too!
Disclosure: I am part of Trade Nation's Influencer program and receive a monthly fee for using their TradingView charts in my analysis.
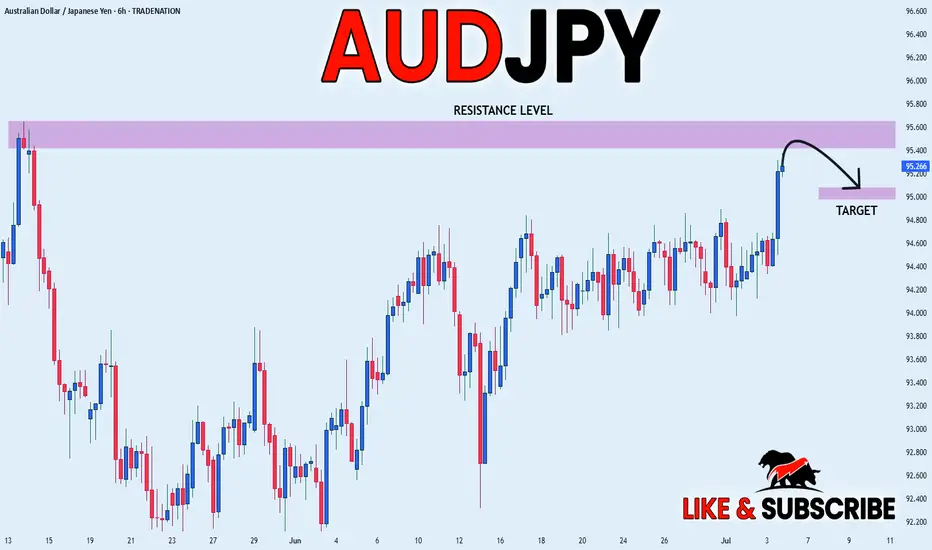
AUD_JPY RISKY SHORT|
✅AUD_JPY is set to retest a
Strong resistance level above at 95.600
After trading in a local uptrend for some time
Which makes a bearish pullback a likely scenario
With the target being a local support below at 95.081
SHORT🔥
✅Like and subscribe to never miss a new idea!✅
Disclosure: I am part of Trade Nation's Influencer program and receive a monthly fee for using their TradingView charts in my analysis.
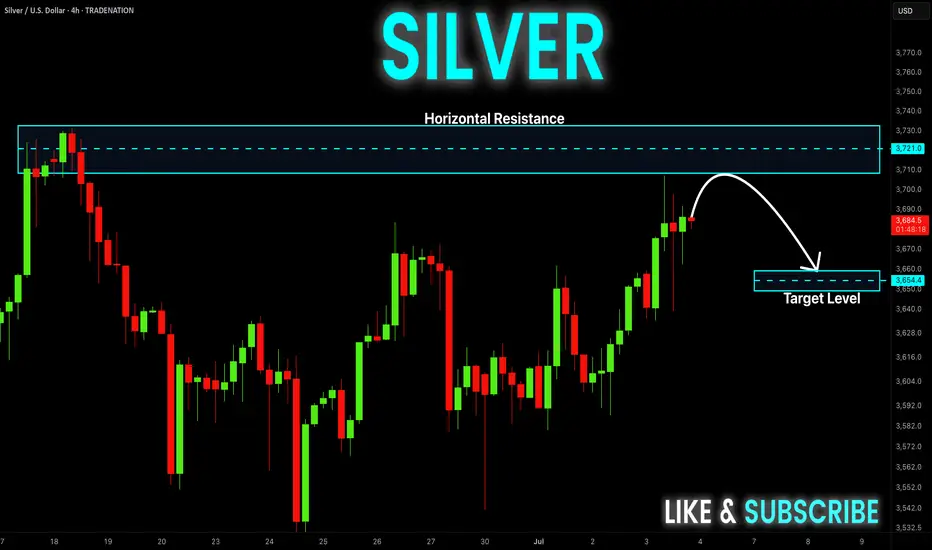
SILVER Short From Resistance! Sell!
Hello,Traders!
SILVER is trading in an
Uptrend but the price will
Soon hit a horizontal resistance
Area around 37,32$ from
Where we will be expecting
A local bearish correction
Sell!
Comment and subscribe to help us grow!
Check out other forecasts below too!
Disclosure: I am part of Trade Nation's Influencer program and receive a monthly fee for using their TradingView charts in my analysis.
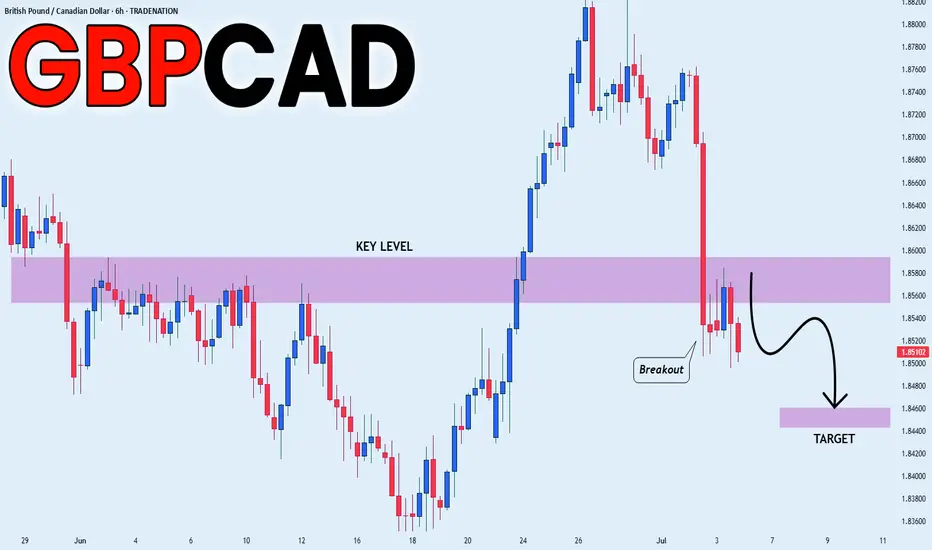
GBP_CAD BEARISH BREAKOUT|SHORT|
✅GBP_CAD broke the key structure level of 1.8580
While trading in an local downtrend
Which makes me bearish
And as the retest of the level is complete
Bearish continuation will follow
SHORT🔥
✅Like and subscribe to never miss a new idea!✅
Disclosure: I am part of Trade Nation's Influencer program and receive a monthly fee for using their TradingView charts in my analysis.
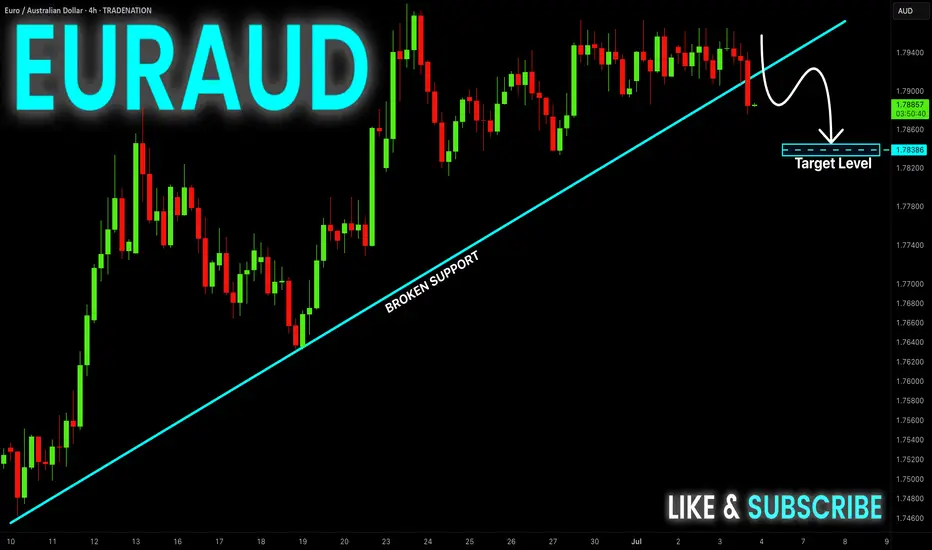
EUR-AUD Bearish Breakout! Sell!
Hello,Traders!
EUR-AUD was trading along
The rising support line but
Now we are seeing a bearish
Breakout so we are bearish
Biased and we will be expecting
A further bearish move down
Sell!
Comment and subscribe to help us grow!
Check out other forecasts below too!
Disclosure: I am part of Trade Nation's Influencer program and receive a monthly fee for using their TradingView charts in my analysis.
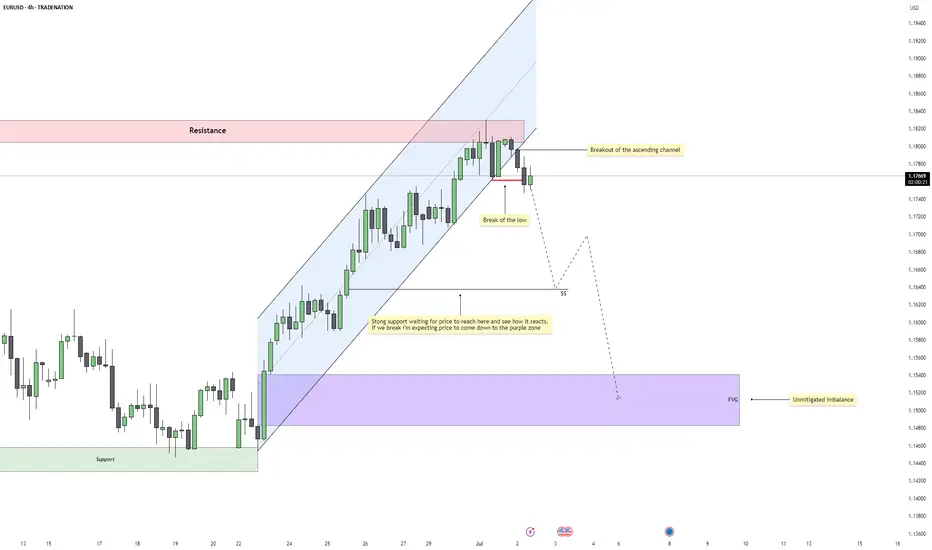
EURUSD – Bearish Reversal Confirmed After Structural BreakEURUSD has shifted out of its bullish environment after a sustained rally inside a clean ascending channel. Price recently rejected a resistance zone that capped previous buying pressure and has now started to rotate downward. This marks the first serious challenge to the trend and sets the tone for a potential bearish phase.
Channel Breakdown and Price Behavior
The ascending channel had been respected for several sessions, guiding price upward with consistent higher highs and higher lows. The recent breakdown from this structure is significant, as it shows the market is no longer willing to support higher prices within that controlled environment. This type of breakout often signals a loss of momentum and increased volatility in the opposite direction.
Break of the Low and Shift in Structure
After breaking the channel, price also took out a major internal low, which had previously held during retracements. This is a key signal of a structural shift, confirming that the uptrend has been interrupted. When price breaks a low that buyers had been defending, it shows sellers have stepped in with conviction and are likely aiming lower targets.
Short-Term Target and Reaction Zone
The first area of interest sits just below current price where a support shelf and price inefficiencies line up. This zone, marked with the dollar sign symbol on the chart, may attract a short-term reaction. If buyers are still present, this is where they would likely try to step in. However, the rejection from resistance and the structural break suggest this level could eventually give way.
Imbalance Zone Below and Liquidity Target
If that support fails, the next high-probability draw is the large untested imbalance sitting further below. This zone has remained untouched since the rally began and represents unfinished business for the market. Price often seeks out these inefficiencies, especially after trend shifts, making it a natural target for sellers if momentum continues.
Conclusion
EURUSD is showing clear signs of bearish pressure after rejecting resistance, breaking structure, and leaving behind unmitigated downside targets. As long as we remain below the broken low, the path of least resistance points lower. The imbalance zone below remains the key destination unless the market shows signs of reversal higher.
Disclosure: I am part of Trade Nation's Influencer program and receive a monthly fee for using their TradingView charts in my analysis.
___________________________________
Thanks for your support!
If you found this idea helpful or learned something new, drop a like 👍 and leave a comment, I’d love to hear your thoughts! 🚀
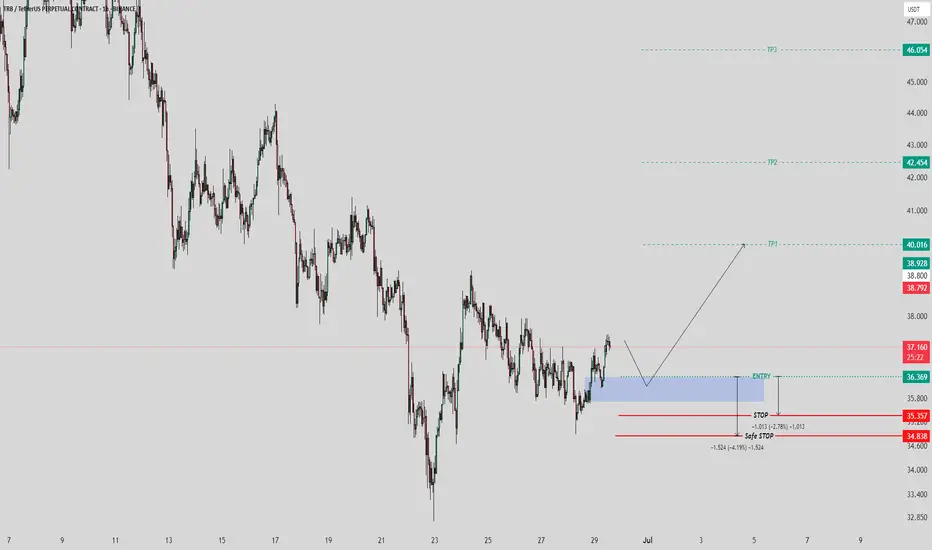
TRBUSDT Setup – Staggered Exits, Smart Profits📌 Entry: 36.70
🎯 TP1: +10% → Secure 50% of position
🛡️ Move to risk-free after TP1 to protect capital
🎯 TP2: Take 50% of remaining volume
🎯 TP3: Close all remaining volume
Calculated exits. Risk-managed. Momentum-ready.
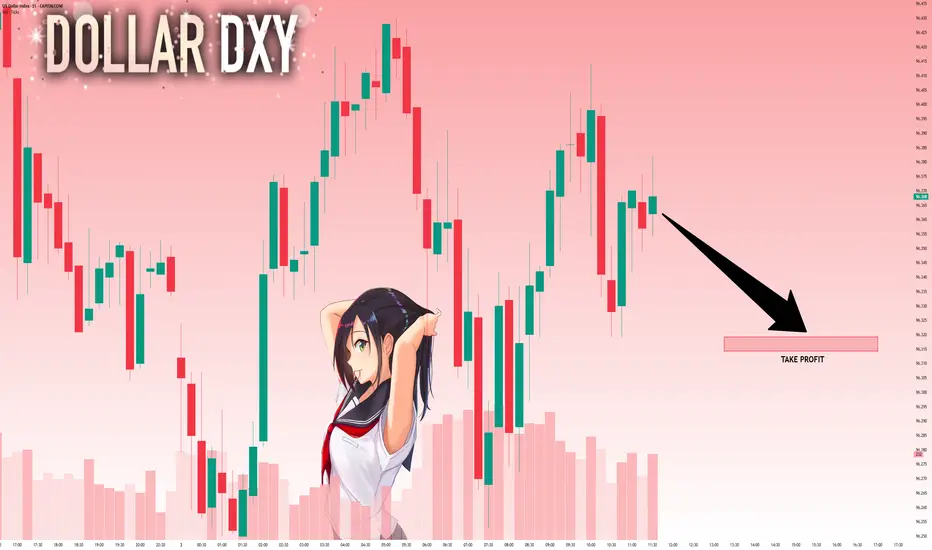
DXY: Next Move Is Down! Short!
My dear friends,
Today we will analyse DXY together☺️
The market is at an inflection zone and price has now reached an area around 96.362 where previous reversals or breakouts have occurred.And a price reaction that we are seeing on multiple timeframes here could signal the next move down so we can enter on confirmation, and target the next key level of 96.319..Stop-loss is recommended beyond the inflection zone.
❤️Sending you lots of Love and Hugs❤️
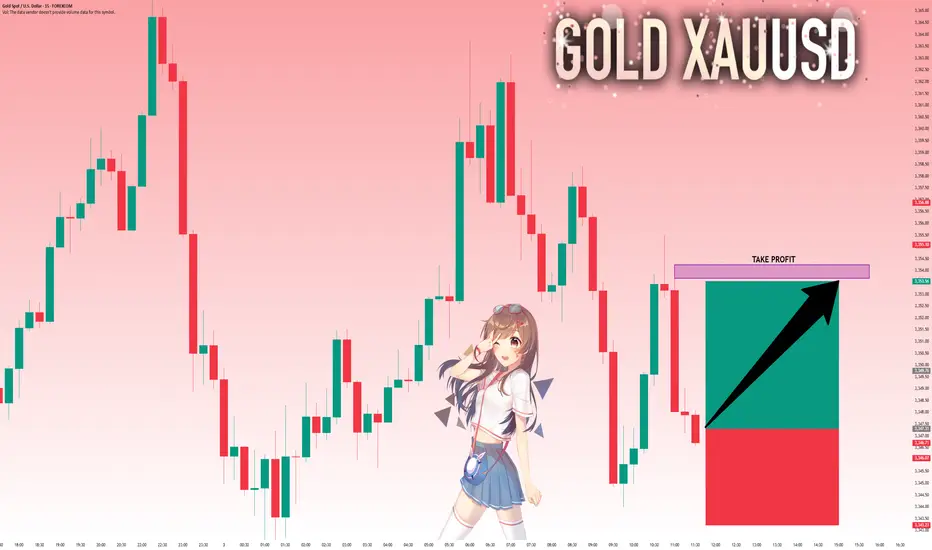
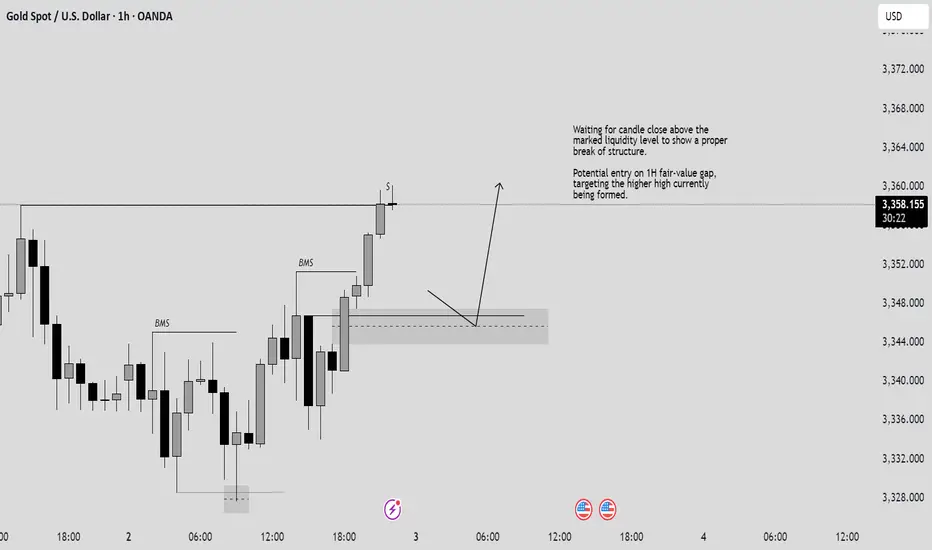
GOLD: Target Is Up! Long!
My dear friends,
Today we will analyse GOLD together☺️
The price is near a wide key level
and the pair is approaching a significant decision level of 3,347.31 Therefore, a strong bullish reaction here could determine the next move up.We will watch for a confirmation candle, and then target the next key level of 3,353,67.Recommend Stop-loss is beyond the current level.
❤️Sending you lots of Love and Hugs❤️
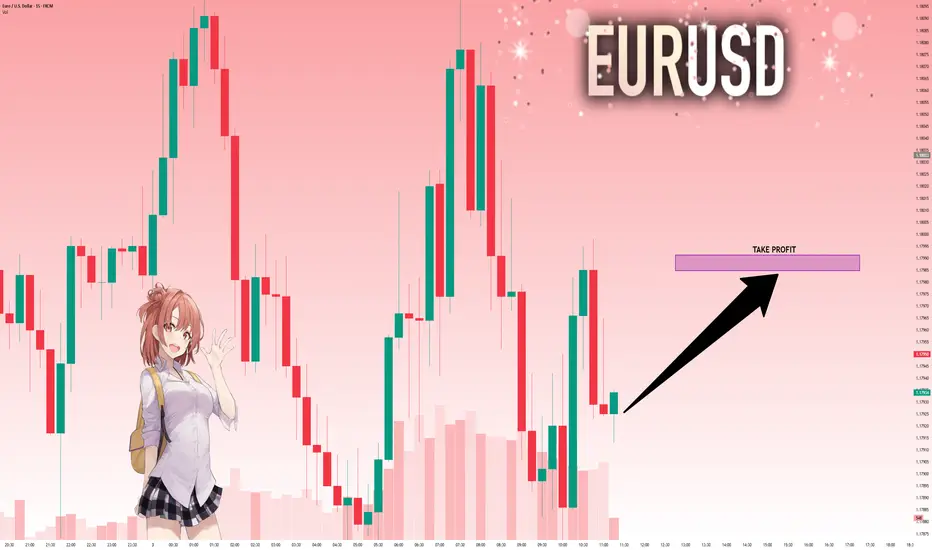
EURUSD: Move Up Expected! Long!
My dear friends,
Today we will analyse EURUSD together☺️
The recent price action suggests a shift in mid-term momentum. A break above the current local range around 1.17930v will confirm the new direction upwards with the target being the next key level of 1.17985 and a reconvened placement of a stop-loss beyond the range.
❤️Sending you lots of Love and Hugs❤️
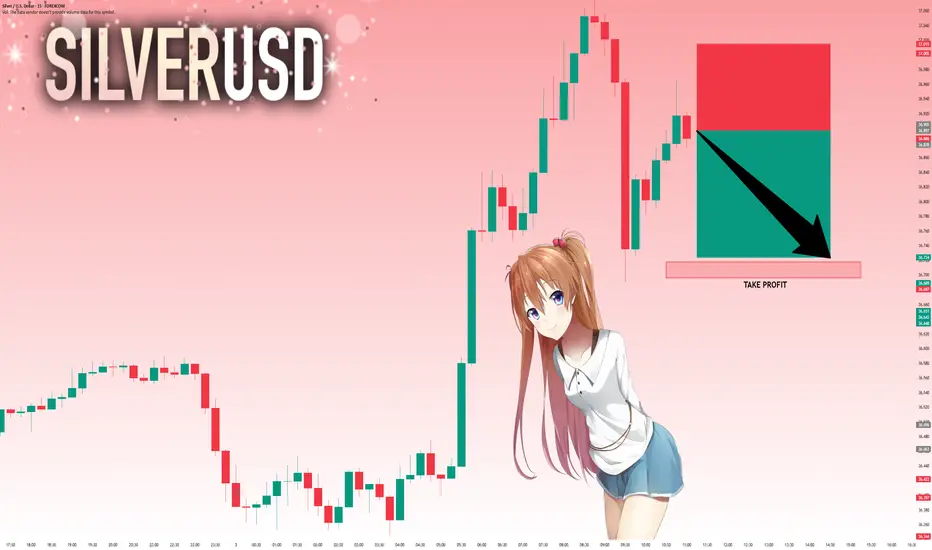
SILVER: Local Bearish Bias! Short!
My dear friends,
Today we will analyse SILVER together☺️
The in-trend continuation seems likely as the current long-term trend appears to be strong, and price is holding below a key level of 36.897 So a bearish continuation seems plausible, targeting the next low. We should enter on confirmation, and place a stop-loss beyond the recent swing level.
❤️Sending you lots of Love and Hugs❤️
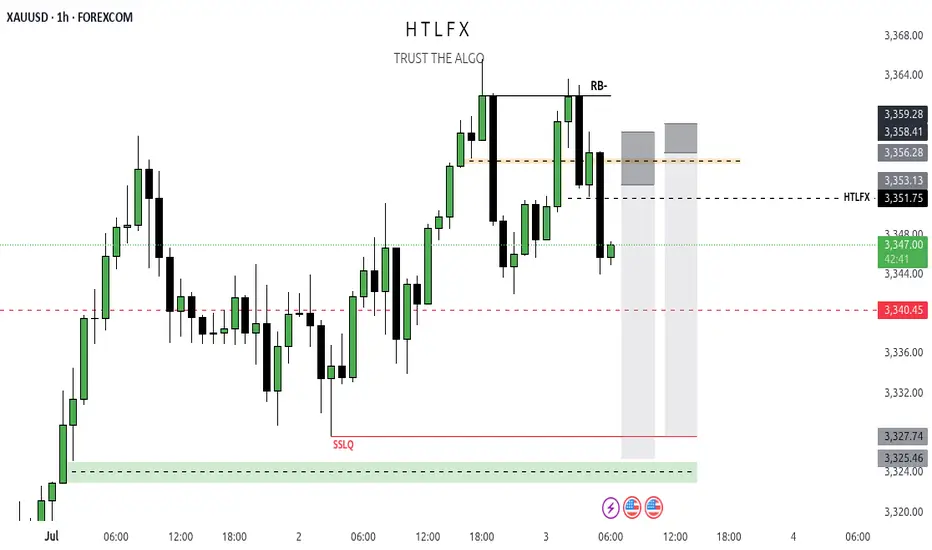
GOLD short( RB- ) + Dealing Range + NFP Day ( Volatile )
so yeah pd array rejection block sign of weakness look for short
than wait for dealing rang than look for ur entry type it's on u each trader has an entry type so look to excute targeting SSLQ sell side liquidity simple
Rince repeat follow me on X check my profile
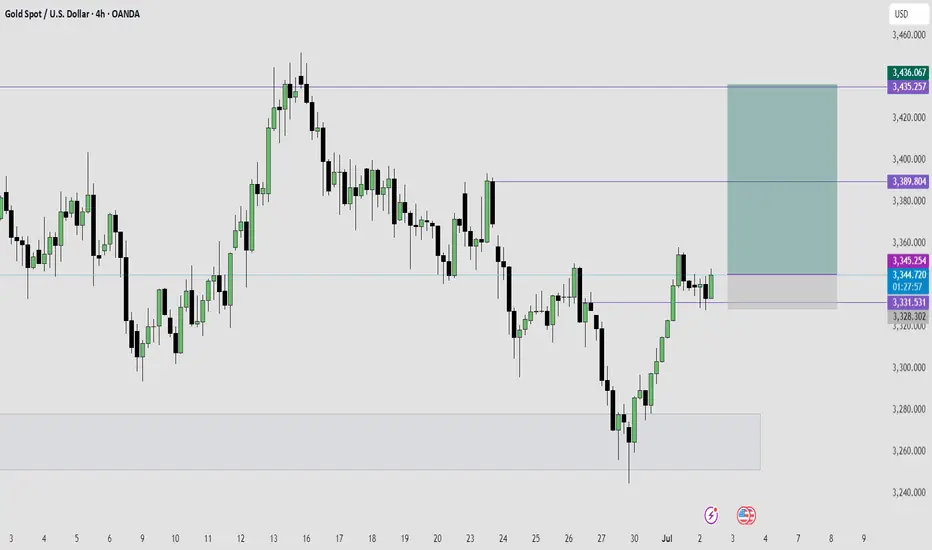
Gold is Ready For The Next Bullish Run- Taking a Long Trade HereAfter a series of bearish structures on 4Hour time frame, which is actually a bullish retracement on higher time frame, Gold has now broke the bearish structure with series of bullish candles which turned the trend from bearish to bullish trend.
After the bullish break of structure, Gold retrace into a fair value price level, formed a swing low plus a bullish price action which further confirmed the bullishness of Gold, which is were I took an entry for a buy long trade.
My target for this trade is for Gold to reach the price level of $3,436 which is a 5.36RR return.
I will be monitoring price and manage my trade accordingly as price move in my direction.
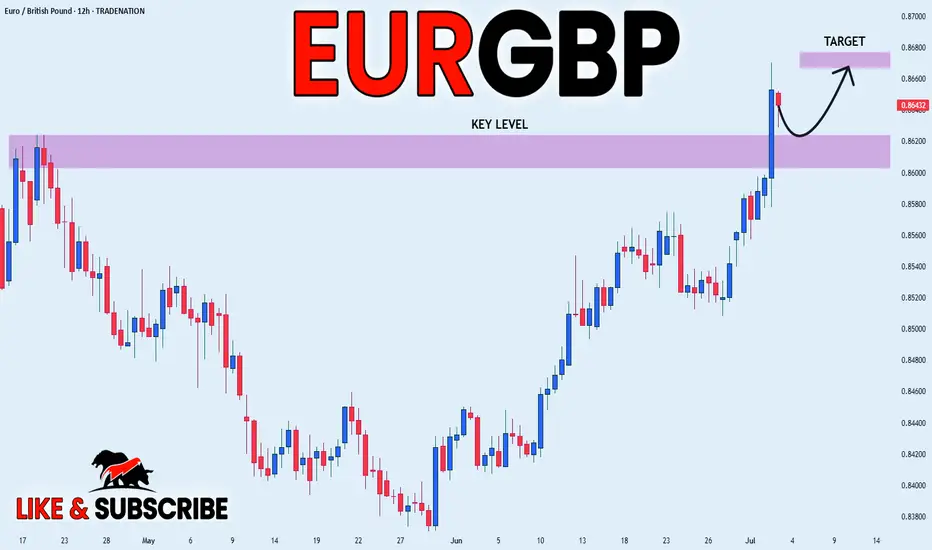
EUR_GBP BULLISH BIAS|LONG|
✅EUR_GBP broke the key
Structure level of 0.8620
While trading in an local uptrend
Which makes me bullish
And I think that after the retest
Of the broken level is complete
A rebound and bullish continuation will follow
LONG🚀
✅Like and subscribe to never miss a new idea!✅
Disclosure: I am part of Trade Nation's Influencer program and receive a monthly fee for using their TradingView charts in my analysis.
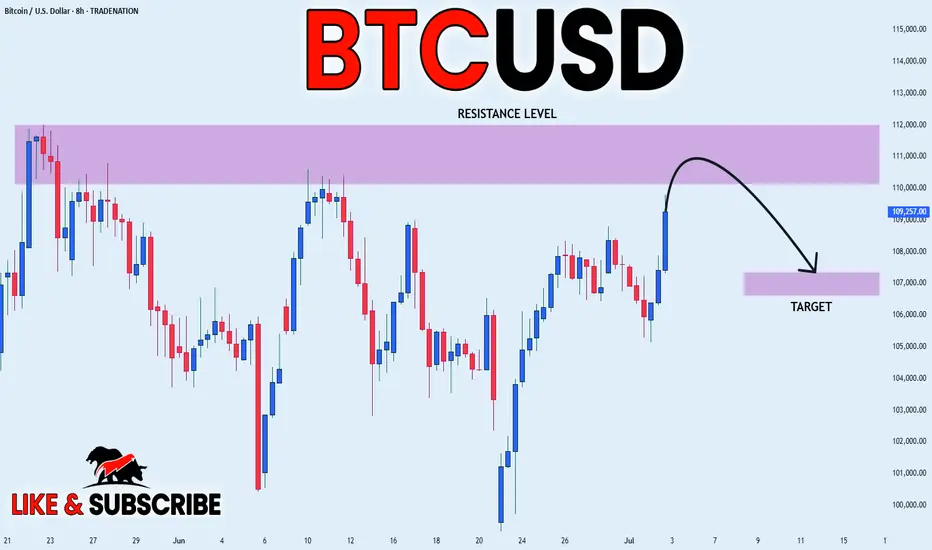
BITCOIN STRONG RESISTANCE AHEAD|SHORT|
✅BITCOIN is going up now
But a strong resistance level is ahead at 112,000$
Which is also an All-Time-High
Thus I am expecting a pullback
And a move down towards the target of 107,300$
SHORT🔥
✅Like and subscribe to never miss a new idea!✅
Disclosure: I am part of Trade Nation's Influencer program and receive a monthly fee for using their TradingView charts in my analysis.
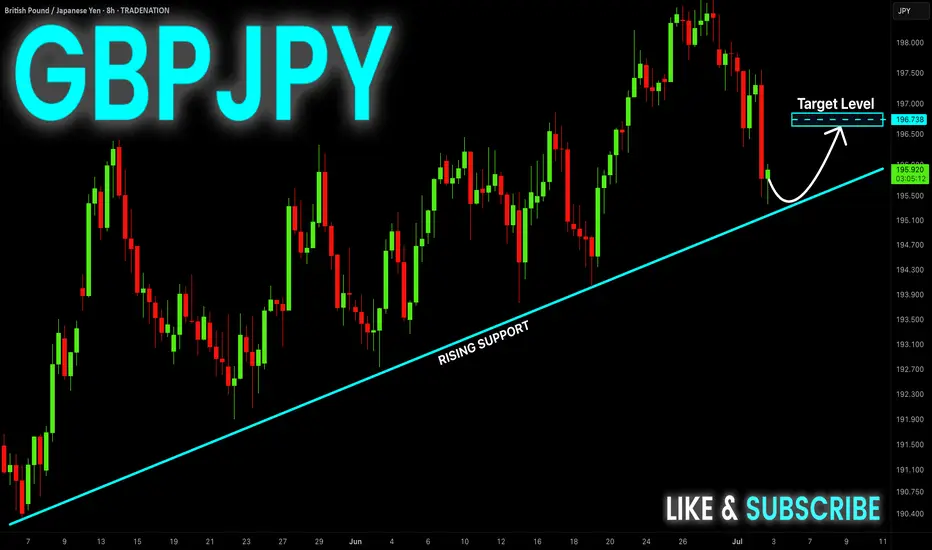
GBP-JPY Correction Ahead! Buy!
Hello,Traders!
GBP-JPY will soon make
A retest of the rising support
Line and as we are bullish
Biased we will be expecting
A local bullish correction
Buy!
Comment and subscribe to help us grow!
Check out other forecasts below too!
Disclosure: I am part of Trade Nation's Influencer program and receive a monthly fee for using their TradingView charts in my analysis.
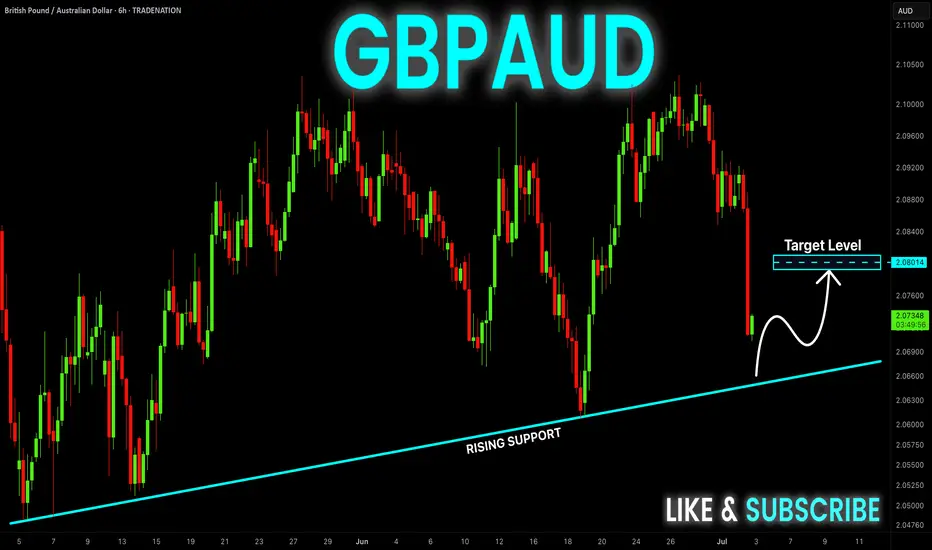
GBP-AUD Rising Support Ahead! Buy!
Hello,Traders!
GBP-AUD made a sharp
And sudden move down
And the pair is oversold
So after it retest the rising
Support line we will be
Expecting a local bullish
Correction and a move up
Buy!
Comment and subscribe to help us grow!
Check out other forecasts below too!
Disclosure: I am part of Trade Nation's Influencer program and receive a monthly fee for using their TradingView charts in my analysis.