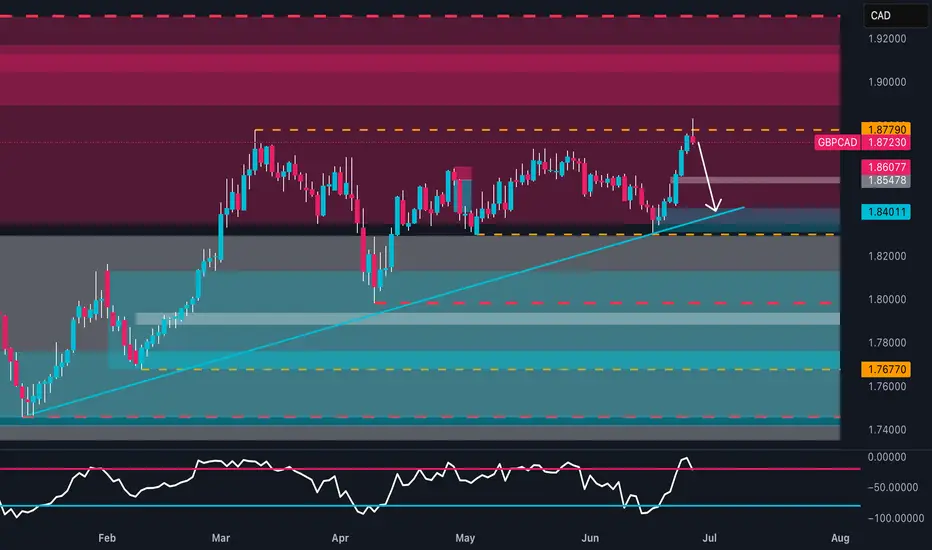
85% of Traders Are Wrong on GBPCAD - I'm Going Short!📊 COT Analysis
GBP:
Non-Commercials remain net long with 106,282 longs vs 63,425 shorts. However, long positions are decreasing (-4,794) while shorts are slightly increasing (+3,983), suggesting profit-taking or a potential shift in sentiment.
Commercials are strongly net short (35,707 longs vs 87,770 shorts), with a significant reduction in both longs (-24,958) and shorts (-33,457) — a clear reduction in overall exposure.
→ Non-Commercial positioning is still bullish, but momentum is fading.
CAD:
Non-Commercials remain heavily net short (28,154 longs vs 94,487 shorts), but notable changes are taking place: sharp increase in longs (+8,503) and a significant cut in shorts (-18,307), pointing to a possible reversal in sentiment.
Commercials are net long with a rise in both longs (+1,834) and shorts (+31,186), indicating potential hedging as expectations shift.
→ CAD strength is emerging in the COT data, supporting a potential bearish move on GBPCAD.
📈 Seasonality – June/July
GBP tends to perform poorly in June across all historical averages (-0.004 / -0.006). July shows slight positivity but is statistically insignificant.
CAD has a mildly negative June, but July is historically its strongest month (+0.006 / +0.007 on 20Y and 15Y averages).
→ Seasonal bias favors CAD strength in the June–July transition.
🧠 Retail Sentiment
Retail traders are 85% long on GBPCAD, a strong contrarian signal.
→ Such imbalance increases the odds of a correction or reversal to the downside.
→ Confirms short bias.
📉 Price Action & RSI
Price surged into strong resistance at 1.8779 (triple top area).
Current daily rejection + RSI in overbought territory suggest a potential swing high forming.
Natural downside target: 1.8400–1.8450 (prior structure and base of the move).
→ Ideal short setup from resistance with confirmation via bearish price action.
Ict
EUR-CAD Local Long! Buy!
Hello,Traders!
EUR-CAD is trading in an
Uptrend and the pair is
About to retest a horizontal
Support of 1.5933 and as
We are locally bullish biased
We will be expecting a
Local bullish rebound
Buy!
Comment and subscribe to help us grow!
Check out other forecasts below too!
Disclosure: I am part of Trade Nation's Influencer program and receive a monthly fee for using their TradingView charts in my analysis.
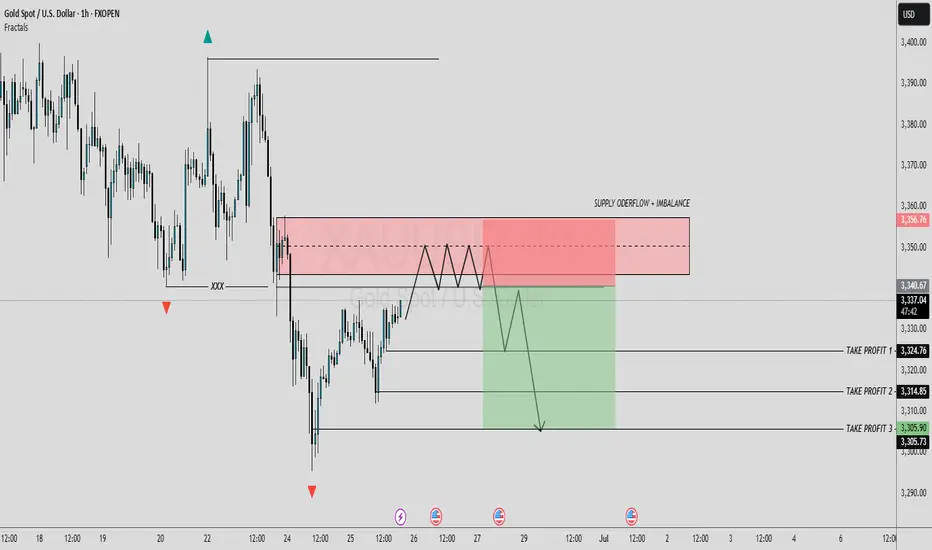
GOLD REVERSAL POINT [Bearish Bias]According to this analysis, today I'm expecting a sell opportunity. So here we're analyze 1H time frame, Price is currently moving near a strong order flow area, and has also SIBI is pending. If price faces clear rejection from this key levels, So there is a high probability that the market may decline from this level. Wait with patient and maintain discipline, confirmation is key.
Now let's see how our sell zone plays out.
Always use stoploss for your trade.
Always use proper money management and proper risk to reward ratio.
#GOLD 1H Technical Analysis Expected Move.
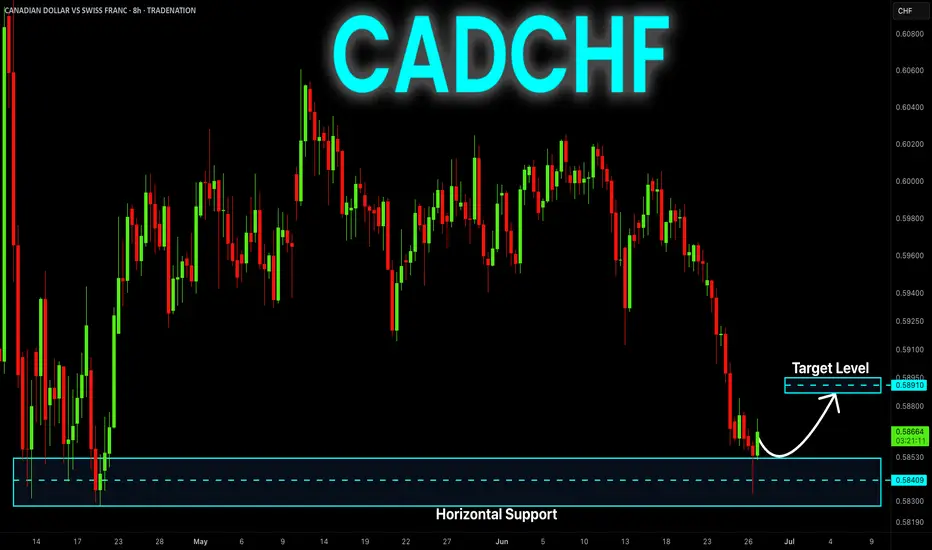
CAD-CHF Bullish Rebound Ahead! Buy!
Hello,Traders!
CAD-CHF fell down sharply
And the pair was oversold
So we are not surprised to
See a bullish rebound from
The strong horizontal support
Around 0.5830 level and we
Think that we are likely
To see a further bullish move up
Buy!
Comment and subscribe to help us grow!
Check out other forecasts below too!
Disclosure: I am part of Trade Nation's Influencer program and receive a monthly fee for using their TradingView charts in my analysis.
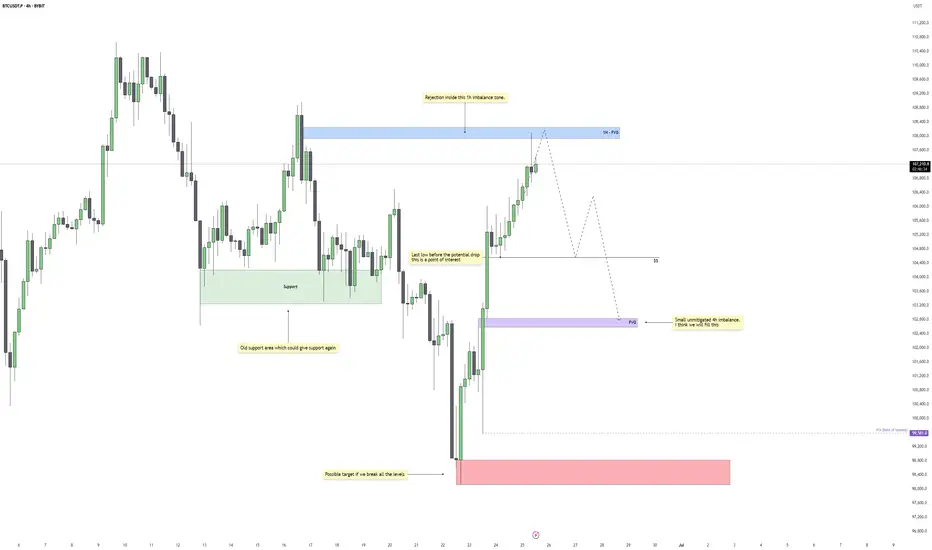
Bitcoin - Bears Take Control, Reversal Coming?After an aggressive bullish rally, Bitcoin has filled a clean 1H imbalance zone near 108K and swept short-term liquidity above recent 1H highs. The move into premium pricing saw clear signs of rejection, with a strong bearish reaction directly inside the imbalance area. This reaction confirms the area as a valid supply zone and signals that bulls may have exhausted their momentum in the short term.
Liquidity Sweep and Rejection
The sweep of prior highs was sharp and quick, lacking follow-through, and was immediately followed by rejection wicks and a drop in momentum. This kind of price action typically hints at engineered liquidity grabs, where smart money drives price into inefficiencies to fill orders before reversing direction. That liquidity sweep, paired with the fill of the 1H FVG, increases the probability that this high is now set in place for a short-term reversal.
Key Short-Term Level to Watch
The immediate level of interest lies at the most recent low before the rally, marked clearly as a potential short-term support. This low often acts as a magnet post-sweep, as price retraces to test if there’s real buyer interest left or not. If this low fails to hold, the bearish momentum could accelerate into the nearby 4H Fair Value Gap around the 102.5K–101.9K area.
Fair Value Gap and Lower Target
That 4H FVG has not yet been filled, and there’s also a small unmitigated imbalance sitting just above it. If price drops into this zone and still fails to show strong buyer interest, the path opens toward a more significant downside move. The final downside target sits near 98K, highlighted by a higher timeframe demand area and major structure level. This zone would only come into play if all intermediate support levels break cleanly.
Bearish Roadmap
Short-term, I expect a retest of the recent low, followed by a possible reaction. But if that reaction fails and momentum stays bearish, the 4H FVG fill becomes highly likely. A break below that would shift control decisively to sellers, with 98K as the next major liquidity pocket to target. This move would also clean out most of the inefficiencies left behind by the recent aggressive bullish move.
Conclusion
The rejection from the 1H imbalance and liquidity sweep suggest Bitcoin’s recent rally may be done for now. Until we reclaim the 1H FVG and break above recent highs with strength, the bias is bearish. If the key low breaks, I’ll be watching how price reacts inside the FVG zone. A weak reaction could open up the flush toward the 98K level for a larger liquidity draw.
___________________________________
Thanks for your support!
If you found this idea helpful or learned something new, drop a like 👍 and leave a comment, I’d love to hear your thoughts! 🚀
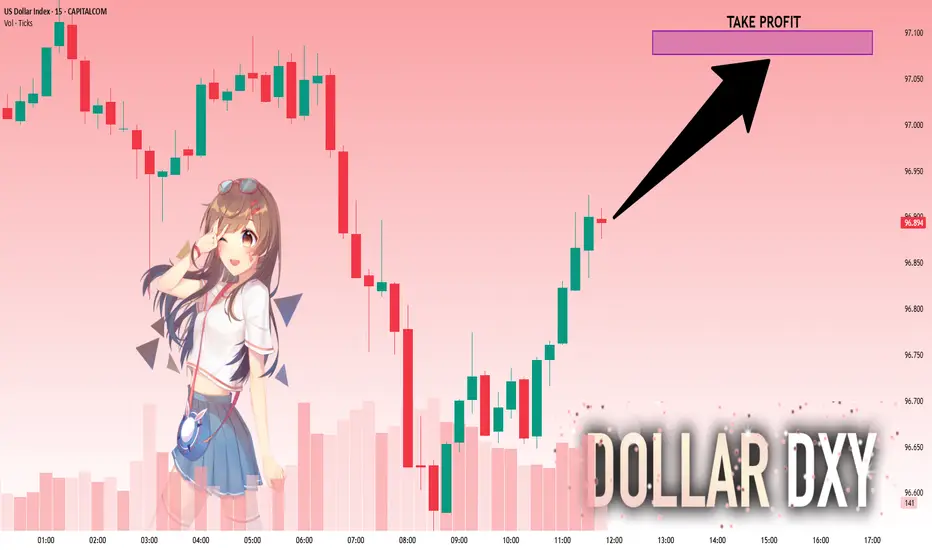
DXY: Strong Bullish Sentiment! Long!
My dear friends,
Today we will analyse DXY together☺️
The price is near a wide key level
and the pair is approaching a significant decision level of 96.899 Therefore, a strong bullish reaction here could determine the next move up.We will watch for a confirmation candle, and then target the next key level of 97.077.Recommend Stop-loss is beyond the current level.
❤️Sending you lots of Love and Hugs❤️
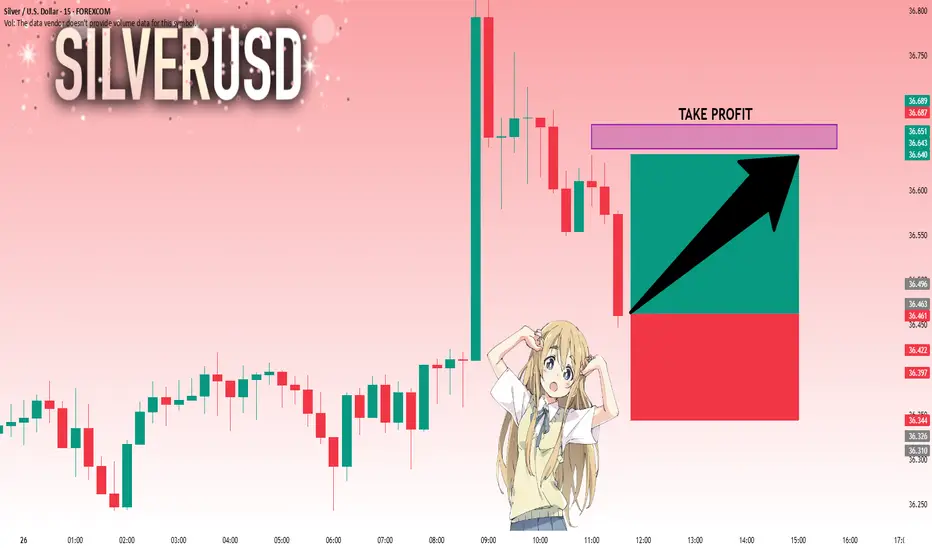
SILVER: Bulls Are Winning! Long!
My dear friends,
Today we will analyse SILVER together☺️
The recent price action suggests a shift in mid-term momentum. A break above the current local range around 36.463 will confirm the new direction upwards with the target being the next key level of 36.640 and a reconvened placement of a stop-loss beyond the range.
❤️Sending you lots of Love and Hugs❤️
EURUSD: Next Move Is Down! Short!
My dear friends,
Today we will analyse EURUSD together☺️
The in-trend continuation seems likely as the current long-term trend appears to be strong, and price is holding below a key level of 1.17021 So a bearish continuation seems plausible, targeting the next low. We should enter on confirmation, and place a stop-loss beyond the recent swing level.
❤️Sending you lots of Love and Hugs❤️

GOLD: Target Is Down! Short!
My dear friends,
Today we will analyse GOLD together☺️
The market is at an inflection zone and price has now reached an area around 3,342.22 where previous reversals or breakouts have occurred.And a price reaction that we are seeing on multiple timeframes here could signal the next move down so we can enter on confirmation, and target the next key level of 3,336.36..Stop-loss is recommended beyond the inflection zone.
❤️Sending you lots of Love and Hugs❤️

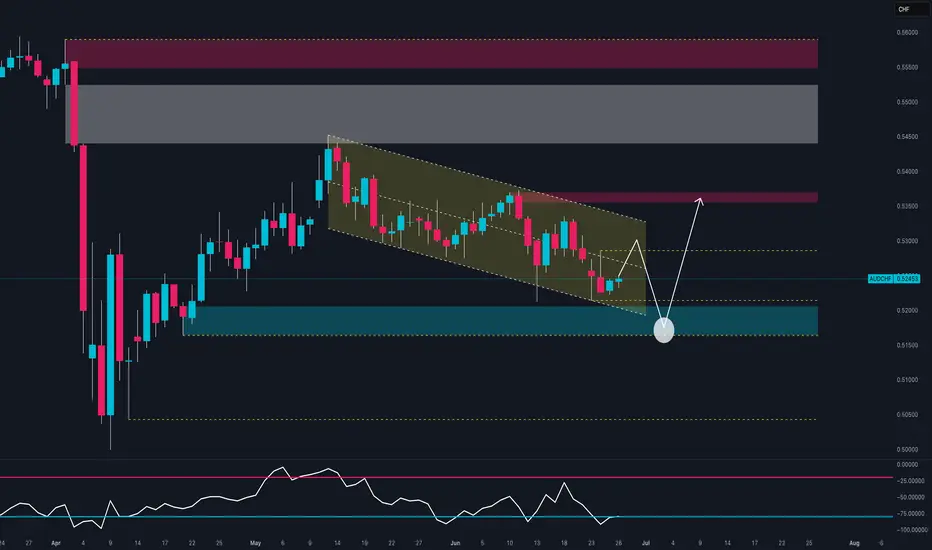
AUDCHF at Make-or-Break Zone: Smart Money Reversal or Breakdown?1. Price Action
Price is currently trading within a descending channel, with 0.5244 hovering near a key demand zone (0.5150–0.5200), where a first bullish reaction has already occurred.
The structure suggests a potential fake breakdown, with room for a rebound toward static resistances at 0.5330, and possibly 0.5450.
RSI is rising from oversold, showing signs of a potential bullish divergence.
📌 Technical bias: Waiting for confirmation of a reversal at key support.
Upside targets: 0.5330 > 0.5450.
Ideal stop-loss below 0.5160.
2. Retail Sentiment
72% of retail traders are long, with an average entry at 0.5551, now facing a 300+ pip drawdown.
This increases short-term contrarian bearish pressure, but also signals liquidity above the highs, which could be targeted before a true bullish reversal.
3. Commitment of Traders (as of June 17, 2025)
AUD – Bearish
Massive drop in both commercial longs (-60k) and shorts (-60k) suggests broad disengagement.
Non-commercials remain net short (-69k), with overall open interest declining.
CHF – Neutral to Bullish
CHF also sees declines in positioning, but commercial traders remain firmly net long (+51.7k).
Non-commercials are net short (-25.5k).
📌 COT Conclusion: AUD remains structurally weaker than CHF, but both currencies are showing signs of positioning uncertainty. This compression phase may precede a technical rebound on AUDCHF.
4. Seasonality
AUD
June historically shows modest strength on 10Y and 5Y averages.
However, 2Y data points to weakness → any rally may be short-lived or fragile.
CHF
CHF tends to be strong in June, especially on 20Y and 10Y views.
Yet, short-term (2Y) data shows end-of-month weakness, suggesting possible profit-taking ahead.
✅ Operational Outlook
Short-term bias: Long AUDCHF (corrective rebound)
Medium/long-term bias: Bearish (still in a downtrend)
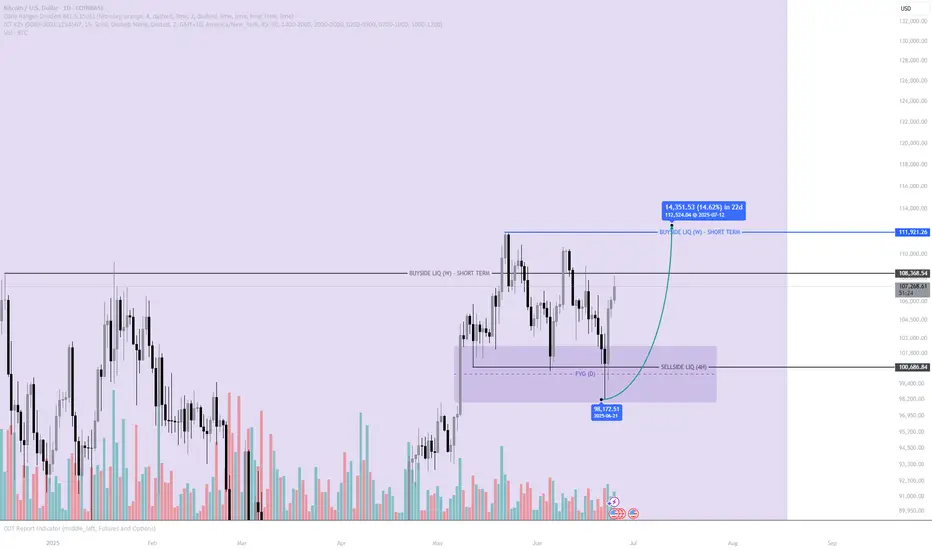
Bitcoin Respecting FVG Again – Is This the Launchpad to 112K+ ?Bitcoin has once again shown strong respect for a key Fair Value Gap (FVG) on the daily timeframe, tapping into a previously identified imbalance around the $98,000 region. This area had earlier acted as a base for bullish structure, and price's return to it suggests re-accumulation by smart money rather than a breakdown. The reaction was swift, rejecting off the FVG and forming a strong bullish daily candle, implying intent for higher prices.
This move into the FVG also swept sell-side liquidity resting below a clear 4-hour equal low. This kind of liquidity grab is a textbook ICT-style move, used to trap retail shorts before a reversal. With that liquidity cleared and institutional interest likely engaged, the structure has shifted bullishly, creating a higher low and showing momentum building to the upside.
The next major upside objective lies at $111,921, which marks short-term weekly buyside liquidity. This area represents a key magnet for price — where many stop-losses and buy-side orders are likely stacked — making it a logical destination for a move upward. The projected move offers a potential 14.6% upside over the next few weeks.
If price can hold above the $106K-$108K zone, the probability increases that we’re witnessing the beginning of a broader impulsive leg toward the $112K region. However, failure to maintain bullish structure here could mean deeper accumulation is still unfolding. As always, this setup should be approached with discipline, and further confirmation should be sought using your own risk model and strategy.
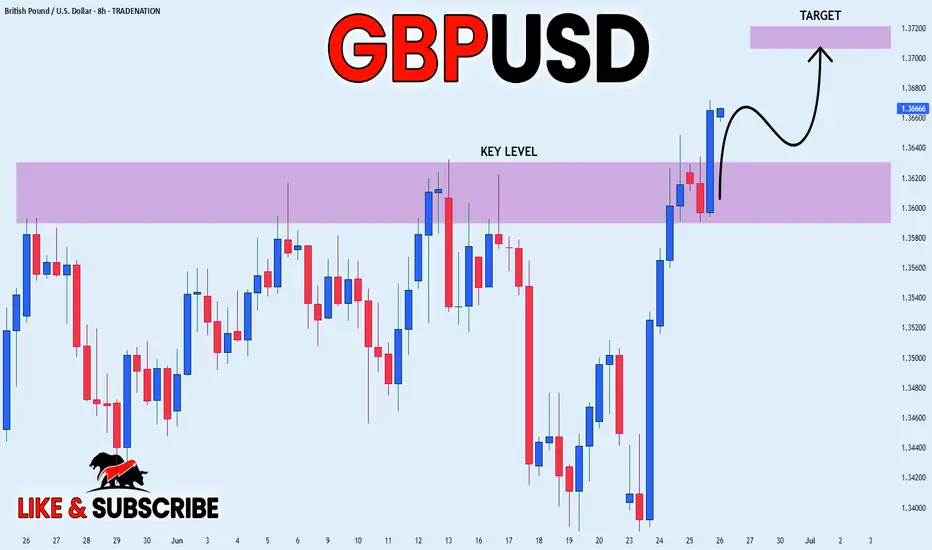
GBP_USD WILL KEEP GROWING|LONG|
✅GBP_USD broke the key structure level of 1.3620
While trading in an local uptrend
Which makes me bullish biased
And I think that after the retest of the broken level is complete
A rebound and bullish continuation will follow
LONG🚀
✅Like and subscribe to never miss a new idea!✅
Disclosure: I am part of Trade Nation's Influencer program and receive a monthly fee for using their TradingView charts in my analysis.
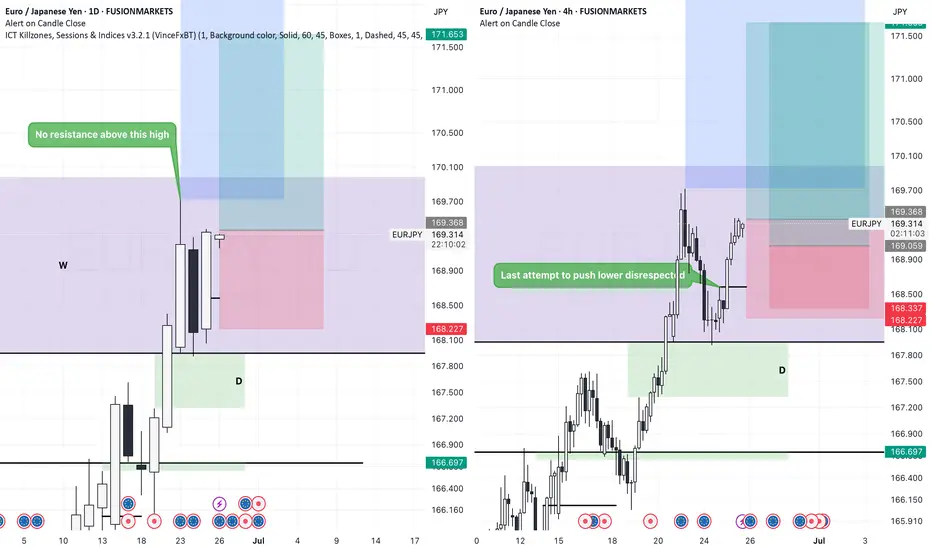
EUR/JPY higherPrice retraced from Weekly FVG. The retracement had high momentum down, making Fair Value Gaps on the 4H. After 3 things aligned:
1. Price made new 4H Fair Value Gap coming from the Daily Fair Value Gap
2. Price disrespected Swing High in 4H Fair Value Gap
3. Rejection off D FVG closed with perfect 2 candle rejection.
I entered the trade after I've seen the close on the daily timeframe, Stop below the 4H Fair Value Gaps.
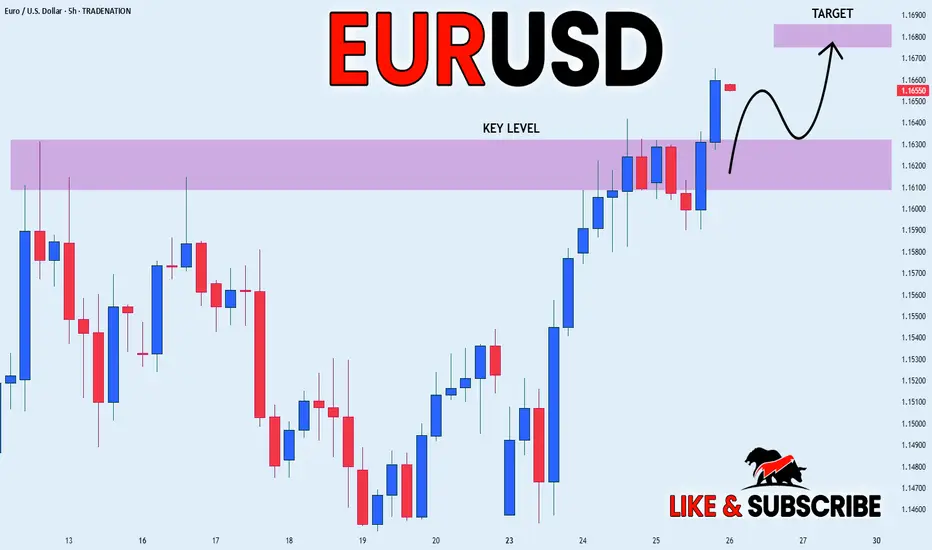
EUR_USD BULLISH BREAKOUT|LONG|
✅EUR_USD is going up
Now and the pair made a bullish
Breakout of the key horizontal
Level of 1.1630 and the breakout
Is confirmed so we are bullish
Biased and we will be expecting
A further bullish move up
LONG🚀
✅Like and subscribe to never miss a new idea!✅
Disclosure: I am part of Trade Nation's Influencer program and receive a monthly fee for using their TradingView charts in my analysis.
AUD-NZD Long From Rising Support! Buy!
Hello,Traders!
AUD-NZD went down but
Will soon retest a rising
Support line from where
We will be expecting a
Bullish rebound and a move up
Buy!
Comment and subscribe to help us grow!
Check out other forecasts below too!
Disclosure: I am part of Trade Nation's Influencer program and receive a monthly fee for using their TradingView charts in my analysis.

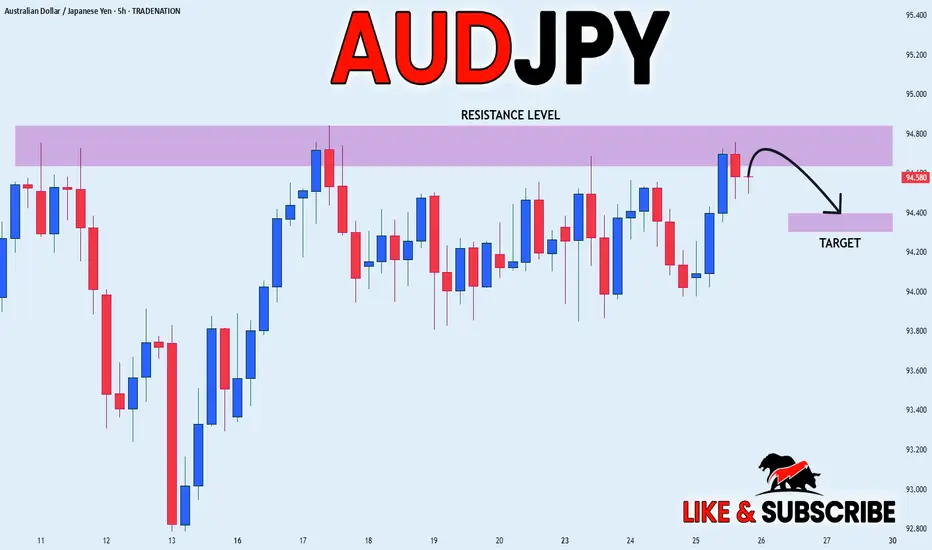
AUD_JPY LOCAL SHORT|
✅AUD_JPY made a retest of the
Strong horizontal resistance level of 94.800
And as you can see the pair is already
Making a local pullback from
The level which sends a clear
Bearish signal to us therefore
We will be expecting a
Further bearish correction
SHORT🔥
✅Like and subscribe to never miss a new idea!✅
Disclosure: I am part of Trade Nation's Influencer program and receive a monthly fee for using their TradingView charts in my analysis.
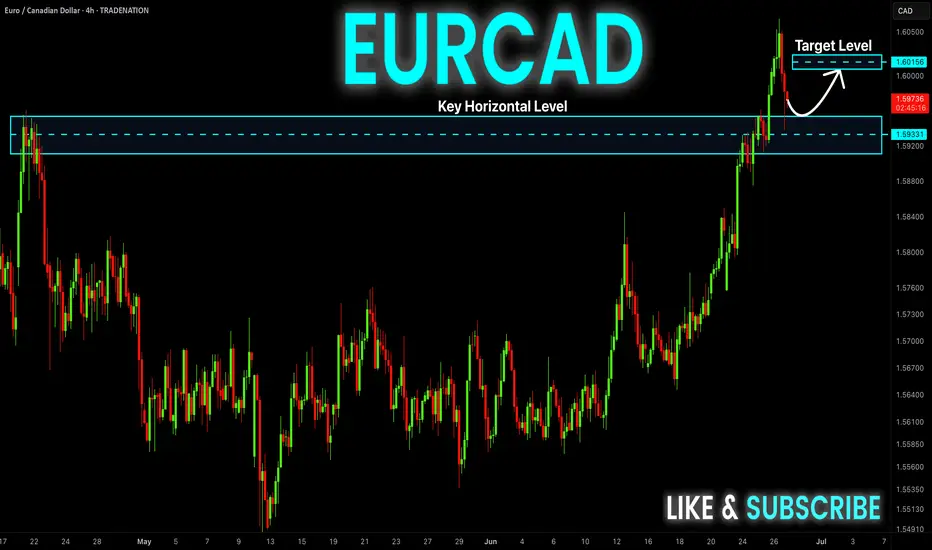
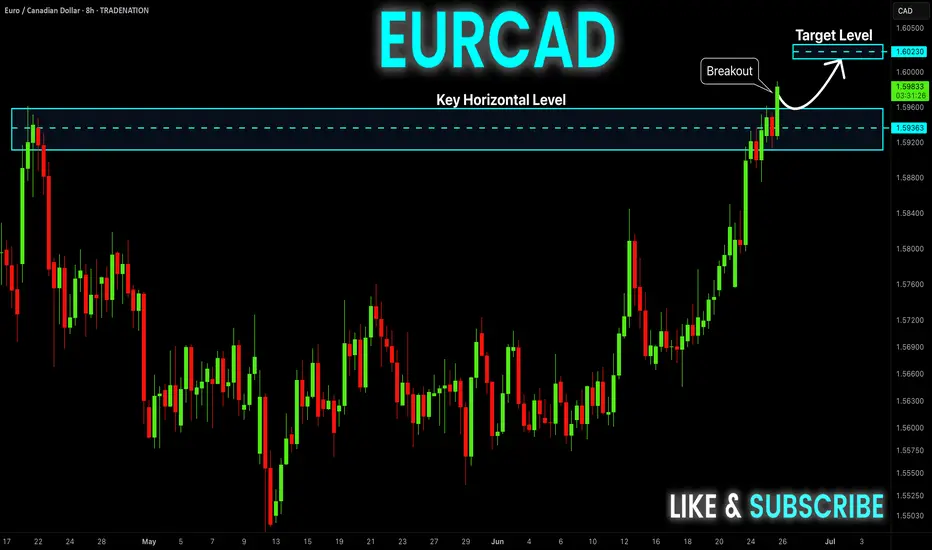
EUR-CAD Bullish Breakout! Buy!
Hello,Traders!
EUR-CAD is trading in an
Uptrend and the pair made
A bullish breakout of the key
Horizontal level of 1.5936 so we
Are bullish biased and we
Will be expecting a further
Bullish move up
Buy!
Comment and subscribe to help us grow!
Check out other forecasts below too!
Disclosure: I am part of Trade Nation's Influencer program and receive a monthly fee for using their TradingView charts in my analysis.
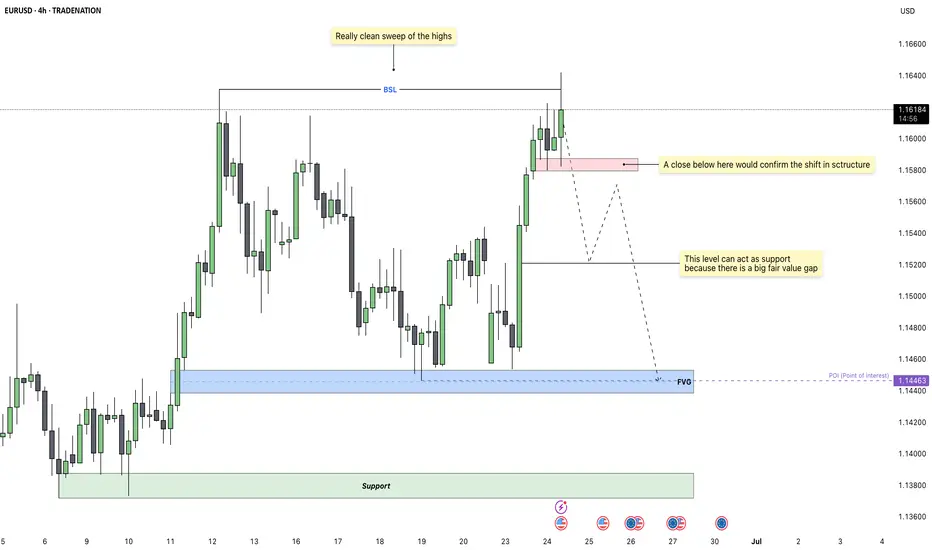
EURUSD - Bears Preparing a Bearish Shift in StructureEURUSD has been pushing higher over the past few sessions, reaching into a key liquidity zone. On the 4H chart, we’ve now seen a very clean sweep of previous swing highs, which completes the first step needed for a potential reversal. This sweep acted as a buy-side liquidity run, taking out resting orders before showing early signs of exhaustion.
Liquidity Sweep and Structural Confirmation
The sweep of the highs marked a potential turning point, but for this setup to gain validity, we need to see confirmation through structure. That confirmation would come from a decisive 4H close below the red mitigation zone. This area aligns with a small demand that previously pushed price up, so a close below would mark a clean break in bullish order flow and confirm a bearish structure shift.
Downside Expectations and Key Levels
If the structure shift is confirmed, I expect EURUSD to move lower toward the fair value gap around 1.14600 to 1.14400. This FVG could provide temporary support, and we may see some reaction there. However, due to the size of the imbalance and the overall context, price has the potential to continue lower through that level.
Interim Reactions and Minor Scenarios
There is a chance price reacts to the FVG and pulls back before continuing lower. Any bounce from this zone would likely be short-term unless it leads to a clear market structure shift back to the upside. If price fails to hold above the FVG, the deeper support zone below near 1.13800 would become the next logical target.
Trigger Point for Bearish Bias
The most important trigger for this trade is a 4H close below the red box. Without that, the bullish structure technically remains intact. Once that level is broken, I will consider the sweep and break combination a completed reversal signal, targeting the FVG and beyond.
Conclusion
This setup follows a textbook liquidity grab followed by a potential structure break. Patience is key here, as I’m waiting for confirmation before taking action. If price closes below the red zone, I’ll be actively looking for shorts targeting the 1.14600 region, with room to extend lower depending on how price reacts at the FVG.
Disclosure: I am part of Trade Nation's Influencer program and receive a monthly fee for using their TradingView charts in my analysis.
___________________________________
Thanks for your support!
If you found this idea helpful or learned something new, drop a like 👍 and leave a comment, I’d love to hear your thoughts! 🚀
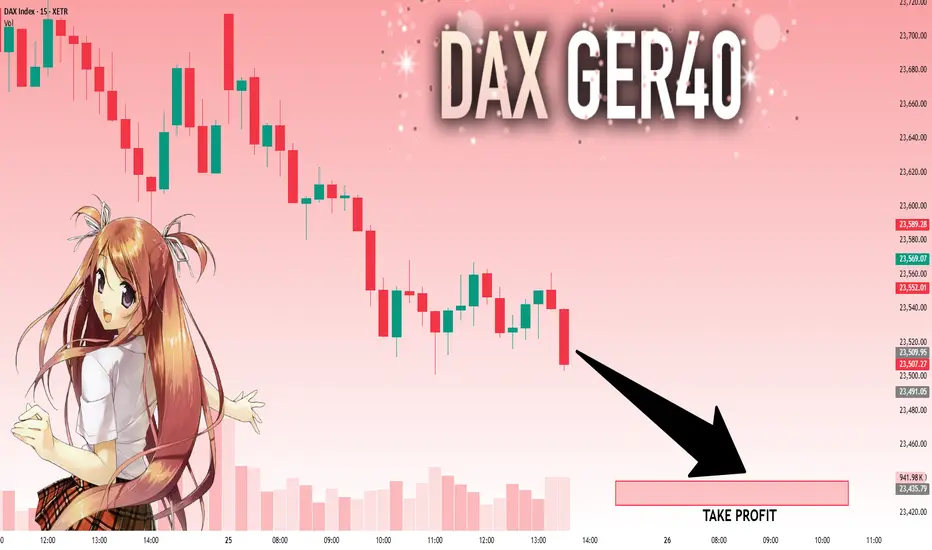
DAX: Move Down Expected! Short!
My dear friends,
Today we will analyse DAX together☺️
The price is near a wide key level
and the pair is approaching a significant decision level of 23,509.95 Therefore, a strong bearish reaction here could determine the next move down.We will watch for a confirmation candle, and then target the next key level of 23,438.51..Recommend Stop-loss is beyond the current level.
❤️Sending you lots of Love and Hugs❤️
GOLD: Local Bullish Bias! Long!
My dear friends,
Today we will analyse GOLD together☺️
The recent price action suggests a shift in mid-term momentum. A break above the current local range around 3,314.13 will confirm the new direction upwards with the target being the next key level of 3,322.84 and a reconvened placement of a stop-loss beyond the range.
❤️Sending you lots of Love and Hugs❤️

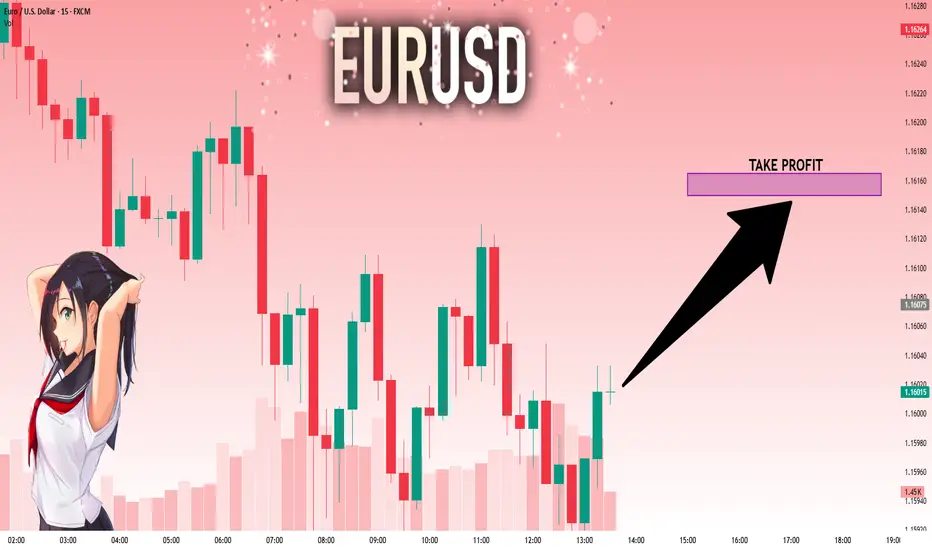
EURUSD: Strong Growth Ahead! Long!
My dear friends,
Today we will analyse EURUSD together☺️
The in-trend continuation seems likely as the current long-term trend appears to be strong, and price is holding above a key level of 1.16017 So a bullish continuation seems plausible, targeting the next high. We should enter on confirmation, and place a stop-loss beyond the recent swing level.
❤️Sending you lots of Love and Hugs❤️
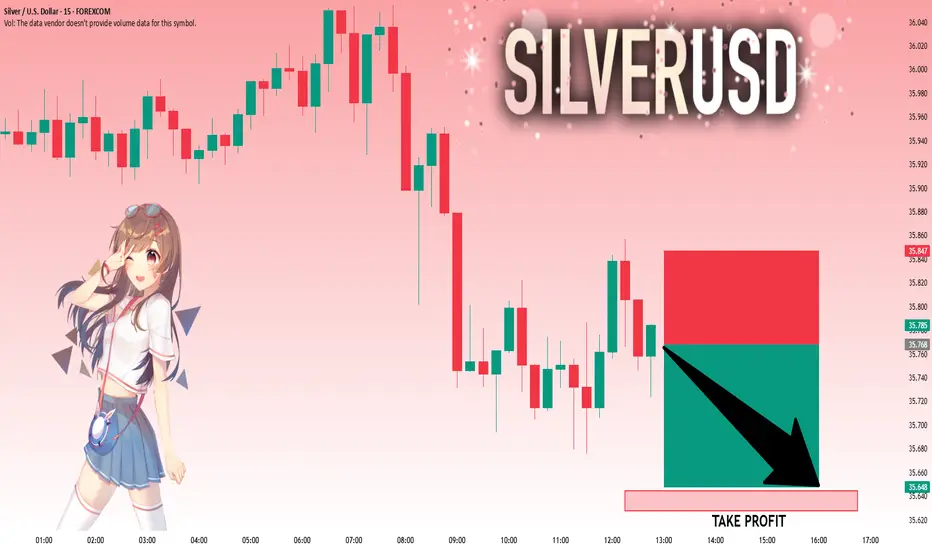
SILVER: Will Go Down! Short!
My dear friends,
Today we will analyse SILVER together☺️
The market is at an inflection zone and price has now reached an area around 35.768 where previous reversals or breakouts have occurred.And a price reaction that we are seeing on multiple timeframes here could signal the next move down so we can enter on confirmation, and target the next key level of 35.645..Stop-loss is recommended beyond the inflection zone.
❤️Sending you lots of Love and Hugs❤️
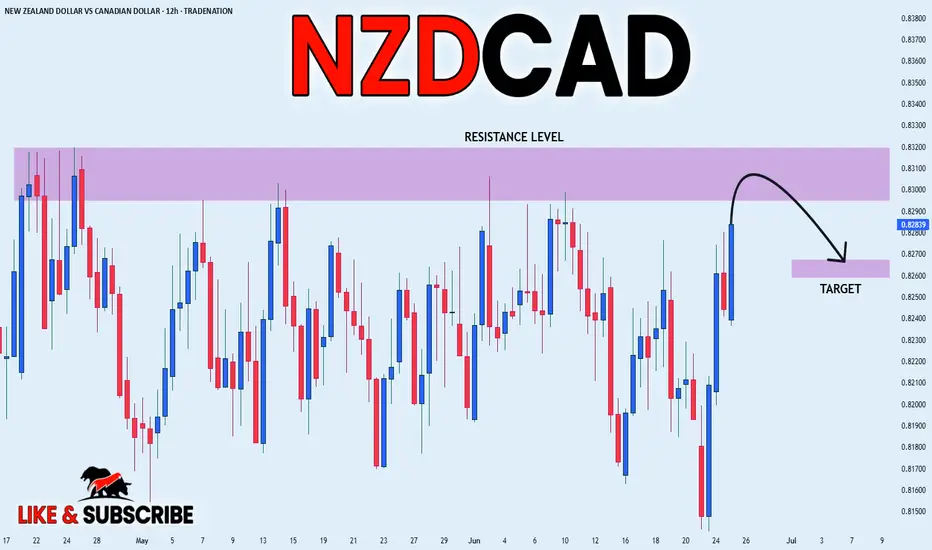
NZD_CAD SHORT FROM RESISTANCE|
✅NZD_CAD will soon retest a key resistance level of 0.8320
So I think that the pair will make a pullback
And go down to retest the demand level below at 0.8267
SHORT🔥
✅Like and subscribe to never miss a new idea!✅
Disclosure: I am part of Trade Nation's Influencer program and receive a monthly fee for using their TradingView charts in my analysis.