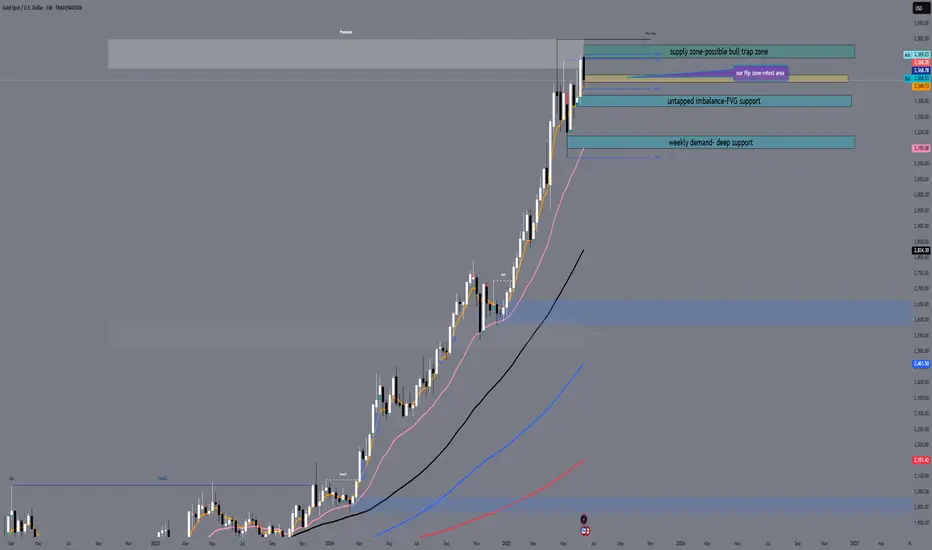
EUR_USD RISING SUPPORT AHEAD|LONG|
✅EUR_USD is trading along the rising support
And as the pair will soon retest it
I am expecting the price to go up
To retest the supply levels above at 1.1511
LONG🚀
✅Like and subscribe to never miss a new idea!✅
Disclosure: I am part of Trade Nation's Influencer program and receive a monthly fee for using their TradingView charts in my analysis.
Ict
GBP/JPY in Trouble? Smart Money Rotates Into Yen📊 1. COT Analysis
JPY (Japanese Yen):
Non-Commercial Net Long: +54,615 – showing strong long accumulation since March.
Recent Changes:
Long: -5,319
Short: +1,235
➡️ Mixed signals short-term, but overall net long positioning remains strong. Speculative funds are still heavily favoring the Yen, suggesting potential continued strength.
GBP (British Pound):
Non-Commercial Net Long: +51,634 (111,076 long – 59,442 short)
Recent Changes:
Long: +7,404
Short: -9,015
➡️ Specs are still net long on GBP, but exposure has slightly decreased. The divergence with the Yen is narrowing.
🔎 COT Summary:
Both currencies are being bought by speculators, but the JPY has shown more consistent long-term positioning. Net momentum appears to shift in favor of Yen strength, pointing to potential downside for GBP/JPY.
📅 2. Seasonality – June
Historically, June is a weak month for GBP/JPY, especially over 20y, 15y, 5y, and 2y windows.
Monthly average return is negative across all major historical timeframes (e.g. -1.2415 over 10 years).
➡️ Seasonality reinforces a bearish bias for June.
🧠 3. Retail Sentiment
Short: 52%
Long: 48%
➡️ Retail positioning is balanced, slightly skewed short. Not a strong contrarian signal, but also doesn’t support a bullish breakout scenario.
📉 4. Technical Analysis
Current Structure: Ascending channel from mid-May → currently testing lower boundary.
Key Zone: 195.600–196.520 is a major supply zone with multiple rejections.
Recent Candle Action: Bearish pin bar + engulfing candle → strong rejection from resistance.
Downside Targets:
First: 193.076
Second: 191.439
Break of the channel would further confirm a trend reversal.
➡️ Price action supports a short scenario with high reward-to-risk toward lower zones.

CADJPY Bearish Reversal? Smart Money + Seasonal Confluence🧠 COT Sentiment
Speculators are heavily net short on CAD (–93K), while maintaining a strong net long position on JPY (+144K).
→ This positioning clearly favors JPY strength over CAD weakness.
Commercials are hedging JPY downside, but the dominant flow remains JPY bullish.
📅 Seasonal Patterns
Historically, June is weak for CAD (5Y, 10Y, 15Y averages all negative).
Meanwhile, JPY tends to strengthen in the second half of June.
→ Seasonality supports a bearish outlook on the pair.
📉 Technical Structure
Price has reacted precisely to the Fibonacci 0.705 retracement (106.23) and is showing signs of RSI divergence.
We are trading within a key supply zone between 106.70 and 108.30, which also aligns with a major resistance cluster and harmonic extension.
First target sits at 103.88, with potential extension to 101.20 if breakdown confirms.
🛢 Macro Catalyst
Oil remains under pressure.
CAD retail sales dropped significantly.
Risk-off sentiment (cautious Fed + geopolitical tensions) favors JPY as a safe haven.
📊 Retail Sentiment
62% of retail traders are short, but with an average entry at 108.49.
→ A break below 106 could trigger liquidation, fueling further downside.
🧩 Trade Setup
🔹 Entry zone: 106.70–107.00
🔸 SL: Above 108.40 (invalidates the bearish thesis)
🎯 TP1: 103.88 (S/R retest)
🎯 TP2: 101.20 (extended target on risk aversion)
🧭 Synthesis
Every angle aligns toward a potential bearish reversal on CAD/JPY:
✅ COT positioning
✅ Seasonality
✅ Macro narrative
✅ Technical confluence
✅ Retail sentiment trap

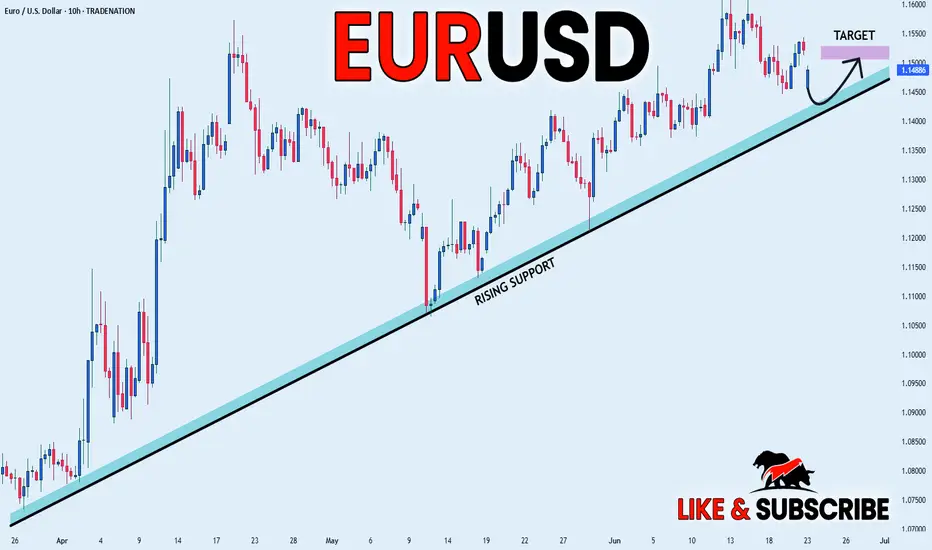
EURJPY Just Broke Out – Is This the Start of a Summer Rally?📊 1. COT Report – Euro & Yen
EUR (Euro FX – CME):
Non-Commercials:
Long: +5,968 | Short: -4,293 → Net Long increasing
Commercials:
Long: +11,480 | Short: +24,451 → Net Short
→ Speculators are clearly bullish on the euro.
JPY (Japanese Yen – CME):
Non-Commercials:
Long: -5,319 | Short: +1,235 → Net Long decreasing
Commercials:
Long: +31,893 | Short: +25,462 → Hedging, but still net short
→ The yen continues to be sold, especially by institutional players.
📌 EUR/JPY COT Summary:
Speculators are buying EUR and selling JPY → strong bullish bias on EUR/JPY.
🧠 2. Retail Sentiment
80% of retail traders are short EUR/JPY, with an average entry at 161.50
Current price is around 167.20 → retail is heavily underwater
✅ Strong contrarian bullish signal
📉 3. Technical Analysis
Price broke out of a long-term range, printing new yearly highs
RSI is overbought but with no active bearish divergence
Price sits inside a major supply zone between 166.50 and 168.00, where previous rejections occurred
A potential pullback to the 164.60–164.15 area aligns with ascending trendline support
🟡 Likely Scenario:
A healthy technical pullback to 164.50–165.00 to cool off RSI,
followed by a continuation higher if supported by momentum and COT positioning
📅 4. Seasonality
June is historically a bullish month for EUR/JPY:
5-year avg: +1.167%
2-year avg: +2.41%
→ Seasonality supports more upside into early July
🌍 5. Macro Context
BoJ remains dovish, no sign of imminent tightening
ECB is steady but relatively less dovish → rate differential still favors the euro
No signs yet of verbal intervention from Japan.
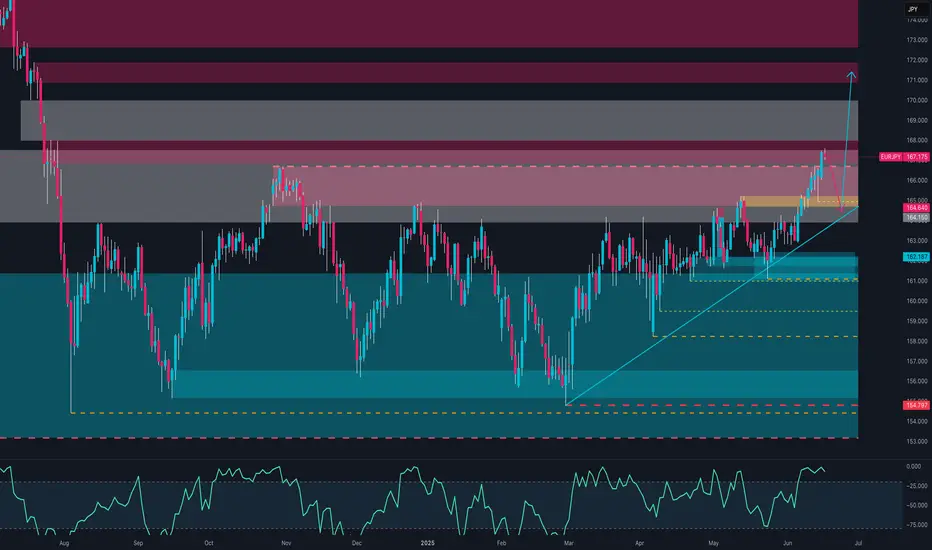
Smart Money Just Flipped Bearish on USD/CAD. Are You Still Long?🧠 1. COT Context & Institutional Flows
🇨🇦 CAD COT Report (CME) – June 10, 2025
Non-Commercials (speculators): net short 93,143 contracts (19,651 long vs. 112,794 short), with a short reduction of -14,319 → early bearish unwinding.
Commercials: net long 91,207 contracts (223,285 long vs. 132,078 short), with strong accumulation (+27,999 longs).
🔄 Net open interest change: +18,436 → renewed institutional interest on the long CAD side.
🇺🇸 USD Index COT Report (ICE) – June 10, 2025
Non-Commercials: net long 1,402 contracts (17,027 long vs. 15,625 short), with a +1,279 increase in longs → modest USD support.
Commercials remain net short -35 contracts, no clear shift.
🔄 Total open interest +2,652 → mild bullish interest in USD.
📌 Implication: Strong institutional support for CAD, USD mildly supported. Net positioning favors downside pressure on USD/CAD.
💹 2. Technical Analysis & Price Action
Primary trend: clearly bearish from the 1.38 zone.
Current price: 1.3552, testing a macro demand zone (1.3470–1.3540).
Daily RSI remains deeply oversold → possible technical bounce, but no reversal structure confirmed.
Recent candles show lower highs and lower lows, with no bullish momentum.
📌 Implication: The bearish trend remains in control. A technical rebound is possible, but bias stays short as long as price trades below 1.3640.
📈 3. Retail Sentiment
77% of retail traders are long USD/CAD, with an average entry at 1.3646.
Only 23% are short, positioned better at 1.3790.
📌 Implication: Retail is heavily long → contrarian bearish signal confirmed.
📊 4. Seasonality
June is historically weak for USD/CAD:
5Y Avg: -0.0118
2Y Avg: -0.0081
The June seasonal curve shows a stronger downside acceleration into the second half of the month.
📌 Implication: Seasonality adds downward pressure into month-end.
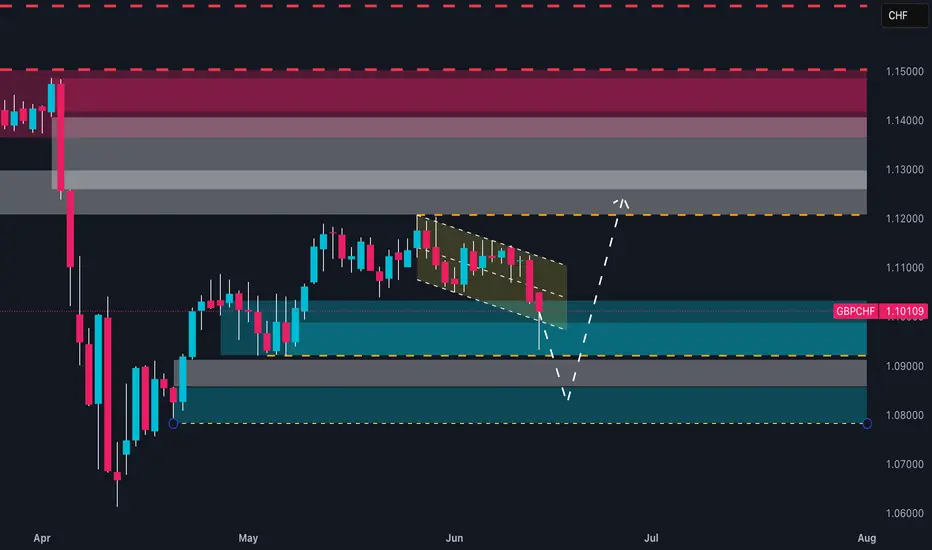
Retail is 86% Long on GBPCHF… But Smart Money Is Setting a Trap📊 1. RETAIL SENTIMENT
Long Positions: 86% – Average Entry: 1.1196
Short Positions: 14% – Average Entry: 1.0999
Current Price: 1.1010
Analysis:
Retail positioning is heavily skewed towards longs, with the average long entry significantly above the current market price. This creates vulnerability to downside pressure through stop-loss hunting or a bearish squeeze. Such extreme retail bias often acts as a contrarian signal: smart money may continue pushing the price lower to flush out retail traders before any meaningful reversal occurs.
🧾 2. COMMITMENTS OF TRADERS – COT REPORT (June 10, 2025)
🔹 British Pound (GBP)
Non-Commercials (Speculators): Net Long increasing by +7.4K → now at +51.6K
Commercials (Hedgers): Net Short decreasing by -13.9K → now at -60.5K
Total Open Interest: Decreased by -19K
Interpretation:
Speculators are maintaining strong long exposure on GBP, while commercials are covering some shorts—potentially signaling a short-term pause in bullish momentum. However, the drop in overall open interest suggests possible consolidation or short-term uncertainty.
🔹 Swiss Franc (CHF)
Non-Commercials: Net Shorts reduced by -2.7K
Commercials: Net Longs increased by +2.5K
Total Open Interest: Increased by +5.6K
Interpretation:
The CHF is gaining strength. Commercial participants are increasing their long exposure while speculators reduce their shorts—this positive divergence supports a bullish outlook on CHF, especially against retail-heavy long pairs like GBP.
📈 3. CHF SEASONALITY – JUNE
Average CHF Performance in June:
20-Year Avg: +0.0099
15-Year Avg: +0.0138
10-Year Avg: +0.0099
5-Year Avg: +0.0039
Analysis:
Historically, June is a seasonally strong month for the Swiss Franc. This seasonal bias aligns with current macro conditions, reinforcing the bullish case for CHF.
📊 4. TECHNICAL ANALYSIS (Daily Chart)
Pattern: Descending channel with a recent false breakdown and re-entry
Key Support Zone: 1.0980–1.1000 → tested and defended with a bullish wick
Target Resistance: 1.1170–1.1200 → prior retail cluster, supply zone, and average long entry
Scenario: A confirmed breakout of the channel could trigger a short squeeze toward 1.1170–1.1200
📌 STRATEGIC OUTLOOK
The current GBP/CHF setup is technically and sentimentally delicate. The price sits on a major daily demand zone, while sentiment and macro flows suggest downside pressure remains in play—but also allow room for a potential contrarian rally (short squeeze).
👉 Action Plan:
Wait for intraday/daily confirmation:
Go long above 1.1045 (breakout confirmation) → target 1.1170
Go short below 1.0980 (bearish continuation) → target 1.0860
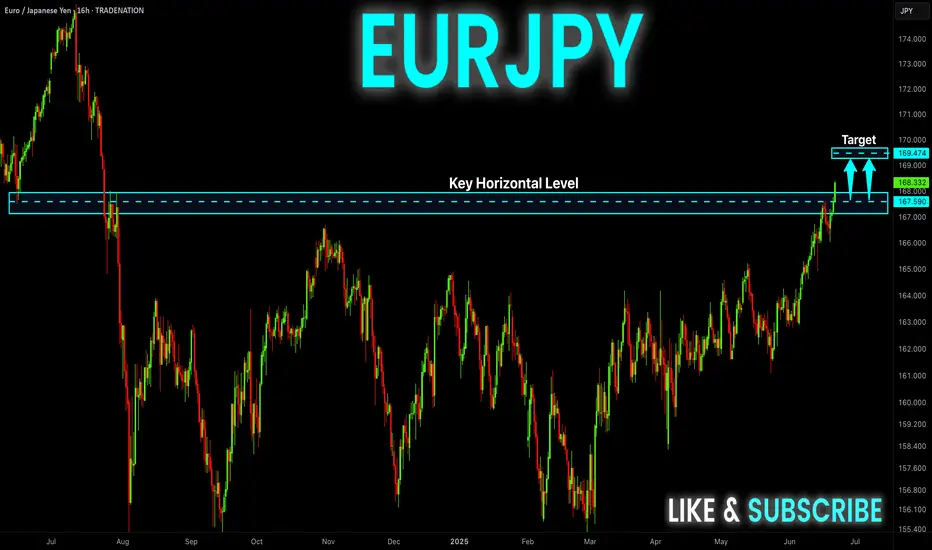
EUR-JPY Bullish Breakout! Buy!
Hello,Traders!
EUR-JPY is trading in an
Uptrend and the pair made
A strong bullish breakout
Of the key horizontal level
Of 168.000 and the breakout
Is confirmed so we will be
Expecting a further bullish
Move up on Monday
Buy!
Comment and subscribe to help us grow!
Check out other forecasts below too!
Disclosure: I am part of Trade Nation's Influencer program and receive a monthly fee for using their TradingView charts in my analysis.
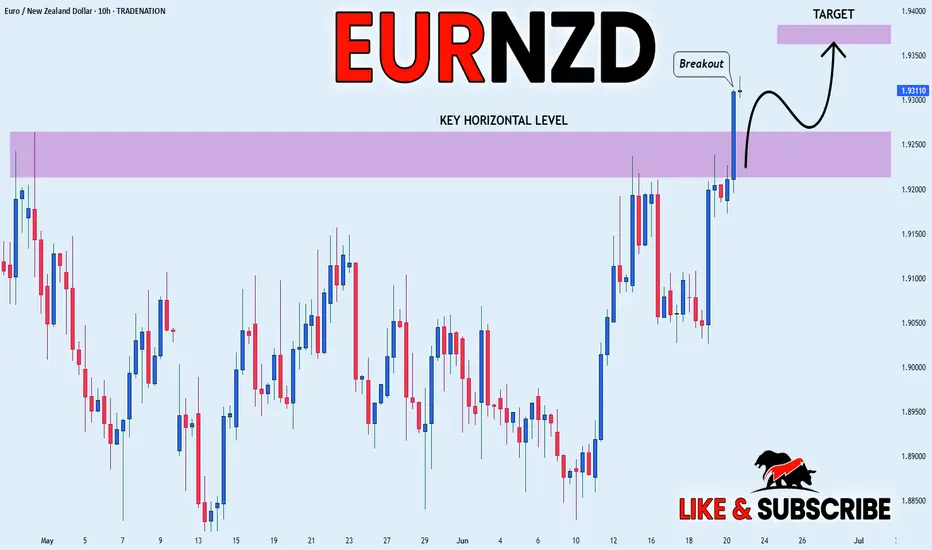
EUR_NZD WILL KEEP GROWING|LONG|
✅EUR_NZD is going up
Now and the pair made a bullish
Breakout of the key horizontal
Level of 1.9250 and the breakout
Is confirmed so we are bullish
Biased and we will be expecting
A further bullish move up on Monday
LONG🚀
✅Like and subscribe to never miss a new idea!✅
Disclosure: I am part of Trade Nation's Influencer program and receive a monthly fee for using their TradingView charts in my analysis.
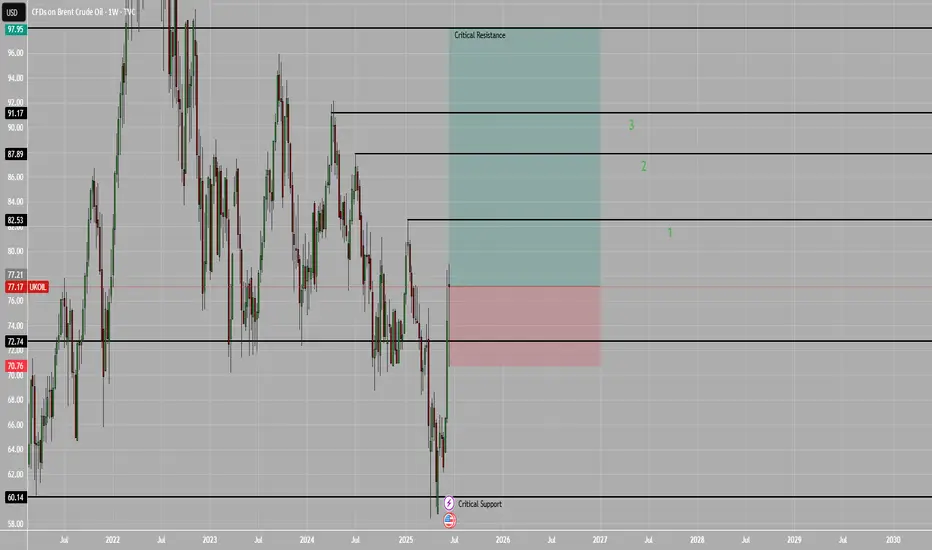
UKOILHello Traders
Oil will be Bullish in the next months
Bottom Support in 60$
and Goals 87, 91, 94, and 98
The most Important Resistance
is 98
If the Price closes this month above 72.74$, The target in the next goal will be achieved
Hope you Good luck
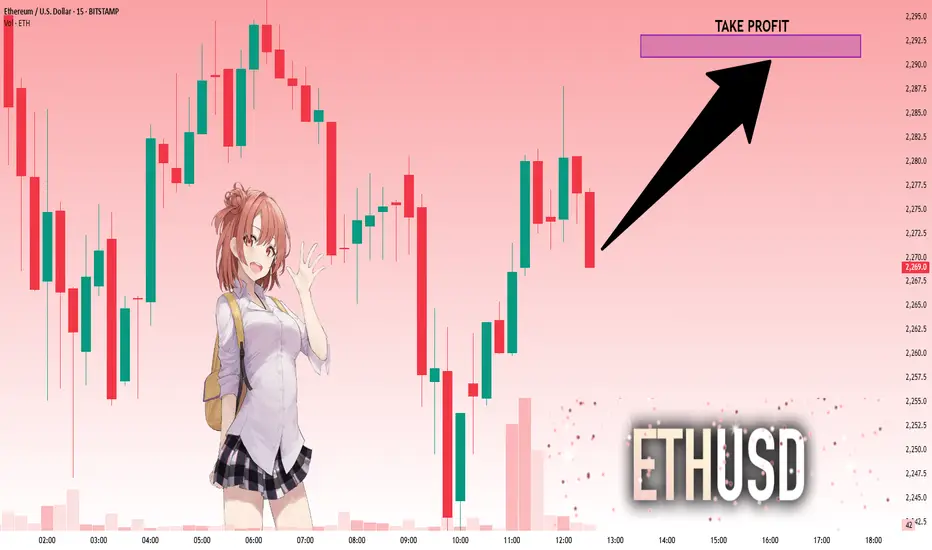
ETHUSD: Will Go Up! Long!
My dear friends,
Today we will analyse ETHUSD together☺️
The price is near a wide key level
and the pair is approaching a significant decision level of 2,270.9 Therefore, a strong bullish reaction here could determine the next move up.We will watch for a confirmation candle, and then target the next key level of 2,290.8.Recommend Stop-loss is beyond the current level.
❤️Sending you lots of Love and Hugs❤️
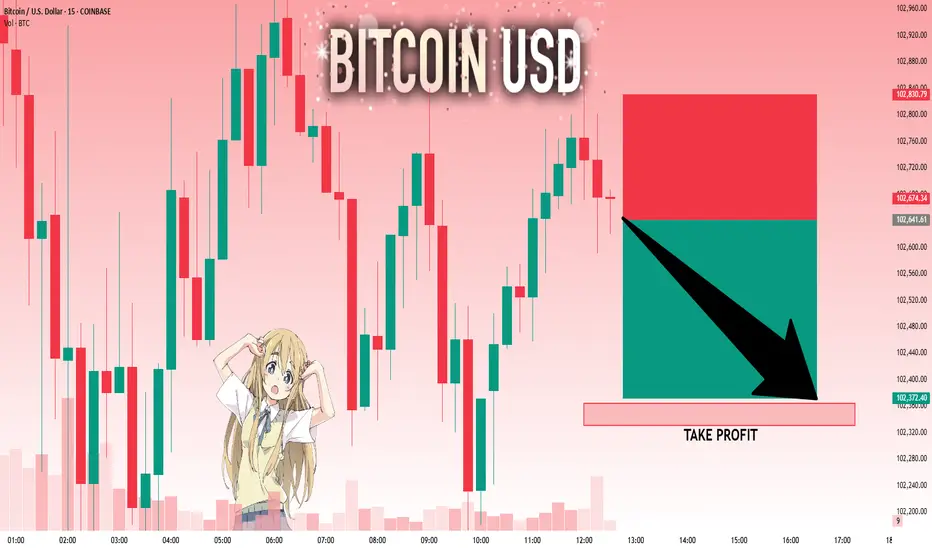
BTCUSD: The Market Is Looking Down! Short!
My dear friends,
Today we will analyse BTCUSD together☺️
The recent price action suggests a shift in mid-term momentum. A break below the current local range around 102,641.61 will confirm the new direction downwards with the target being the next key level of 102,364.09.and a reconvened placement of a stop-loss beyond the range.
❤️Sending you lots of Love and Hugs❤️
BNB Analysis (Crypto)Here is my analysis on BNB, the native token of Binance. I'll be using ICT concepts, primarily liquidity, efficiency, PD Arrays, and premium/discount/OTE.
Hope you find it insightful in knowing where price is going to go!
- R2F Trading

NATGAS REBOUND AHEAD|LONG|
✅NATGAS went down to retest
A horizontal support of 3.820$
Which makes me locally bullish biased
And I think that a move up
From the level is to be expected
Towards the target above at 3.984$
LONG🚀
✅Like and subscribe to never miss a new idea!✅
Disclosure: I am part of Trade Nation's Influencer program and receive a monthly fee for using their TradingView charts in my analysis.

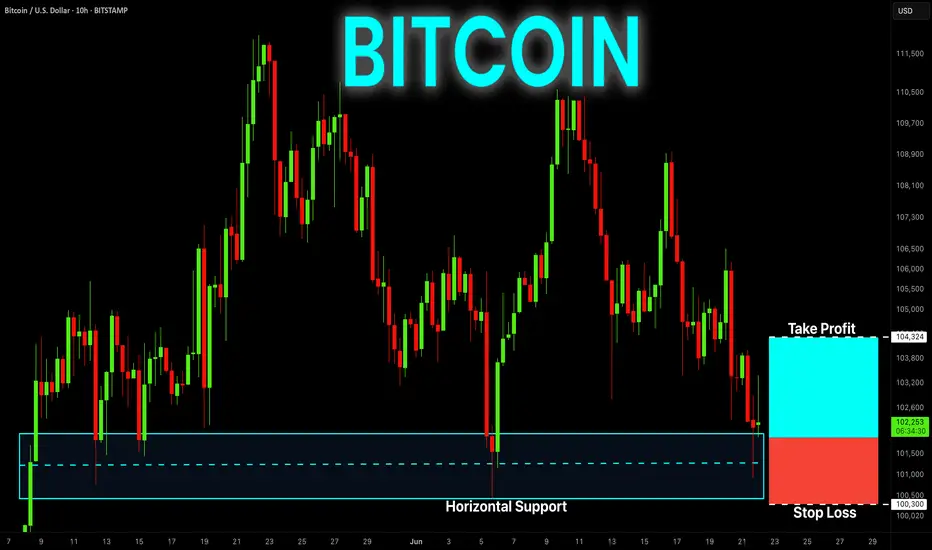
BITCOIN Free Signal! Buy!
Hello,Traders!
BITCOIN is retesting a
Horizontal support level
Around 101,288$ from
Where we will be expecting
A local rebound so we can
Go long with the Take Profit
Of 104,324$ and the Stop
Loss of 100,300$
Buy!
Comment and subscribe to help us grow!
Check out other forecasts below too!
Disclosure: I am part of Trade Nation's Influencer program and receive a monthly fee for using their TradingView charts in my analysis.
USOIL: Strong Bearish Sentiment! Short!
My dear friends,
Today we will analyse USOIL together☺️
The in-trend continuation seems likely as the current long-term trend appears to be strong, and price is holding below a key level of 73.969 So a bearish continuation seems plausible, targeting the next low. We should enter on confirmation, and place a stop-loss beyond the recent swing level.
❤️Sending you lots of Love and Hugs❤️

NG1!: Bulls Are Winning! Long!
My dear friends,
Today we will analyse NG1! together☺️
The market is at an inflection zone and price has now reached an area around 3.894 where previous reversals or breakouts have occurred.And a price reaction that we are seeing on multiple timeframes here could signal the next move up so we can enter on confirmation, and target the next key level of 3.993.Stop-loss is recommended beyond the inflection zone.
❤️Sending you lots of Love and Hugs❤️

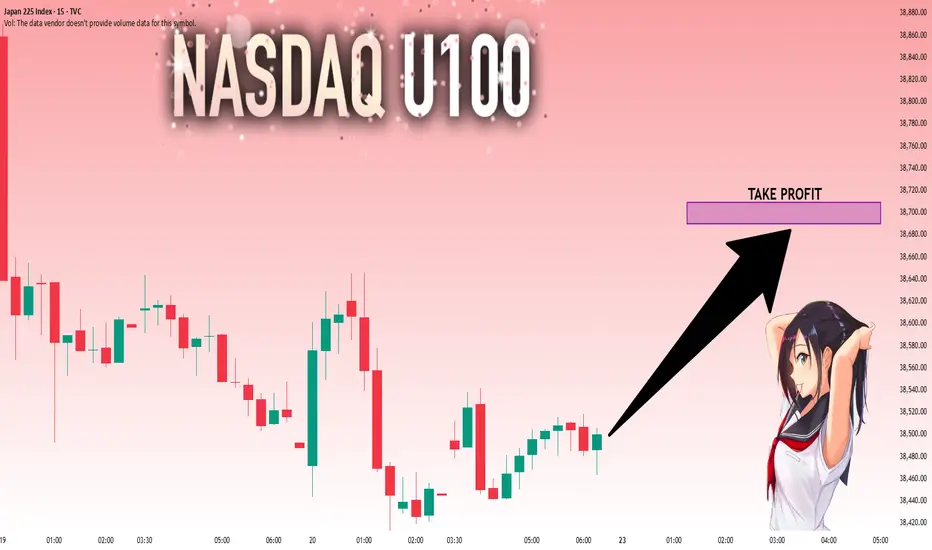
NI225: Next Move Is Up! Long!
My dear friends,
Today we will analyse NI225 together☺️
The price is near a wide key level
and the pair is approaching a significant decision level of 38,501.82 Therefore, a strong bullish reaction here could determine the next move up.We will watch for a confirmation candle, and then target the next key level of 38,689.93.Recommend Stop-loss is beyond the current level.
❤️Sending you lots of Love and Hugs❤️
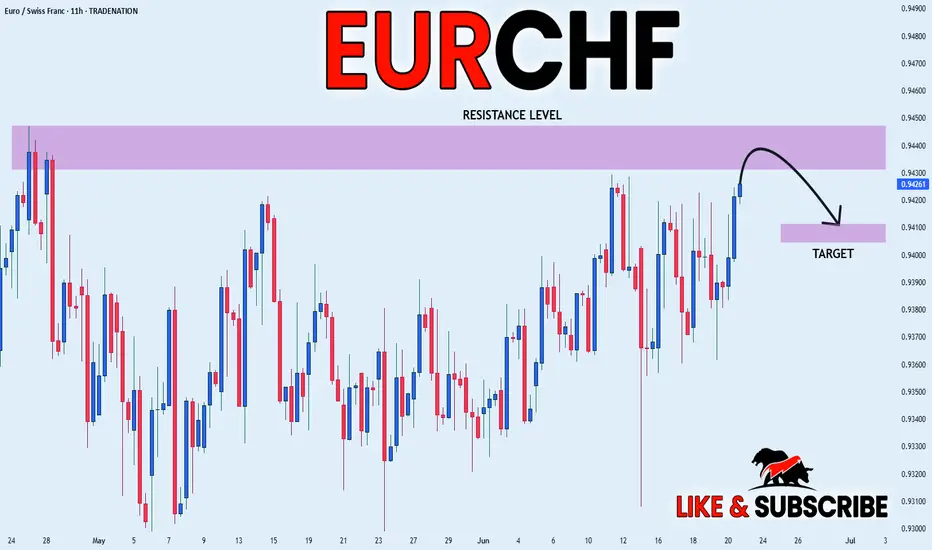
EUR_CHF CORRECTION AHEAD|SHORT|
✅EUR_CHF is set to retest a
Strong resistance level above at 0.9446
After trading in a local uptrend for some time
Which makes a bearish pullback a likely scenario
With the target being a local support below at 0.9410
SHORT🔥
✅Like and subscribe to never miss a new idea!✅
Disclosure: I am part of Trade Nation's Influencer program and receive a monthly fee for using their TradingView charts in my analysis.
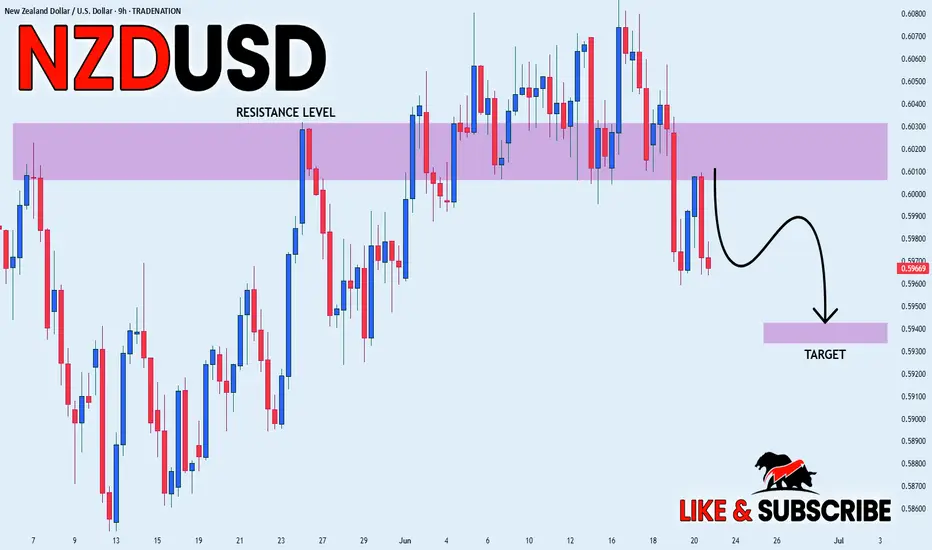
NZD_USD WILL GO DOWN|SHORT|
✅NZD_USD is going down currently
As the pair broke the key structure level of 0.6030
Which is now a resistance, and has made a pullback
And the retest, so I think the price will keep going down on Monday
SHORT🔥
✅Like and subscribe to never miss a new idea!✅
Disclosure: I am part of Trade Nation's Influencer program and receive a monthly fee for using their TradingView charts in my analysis.
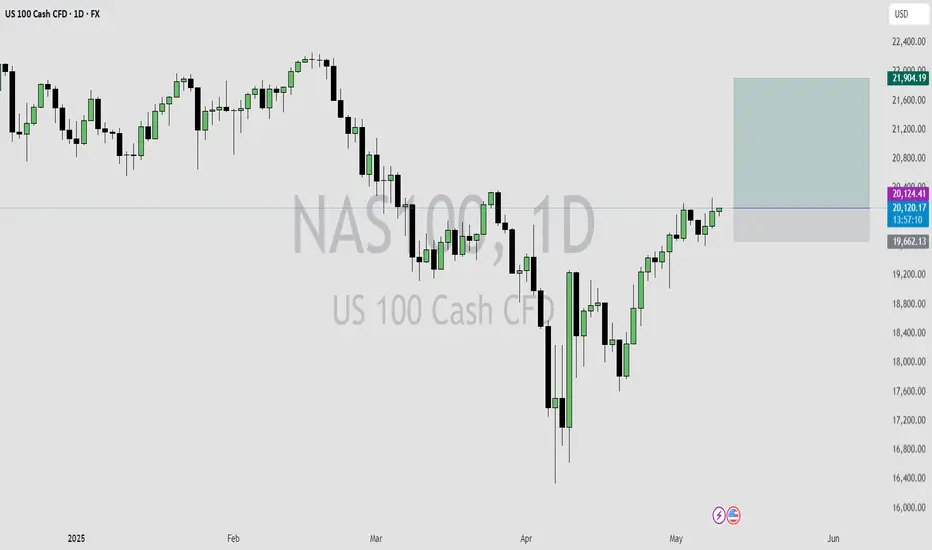
NASDAQ READY TO CONTINUE THE LONG-TERM WEEKLY BULLISH RUN
FX:NAS100
I just entered this buy trade on Nasdaq on the daily time frame.
The trade setup is a Swing trade following the monthly and weekly orderflow.
The Monthly is bullish, the weekly is also bullish, so I entered on the daily time frame retracement.
My overall take profit is a risk reward of 1:4.
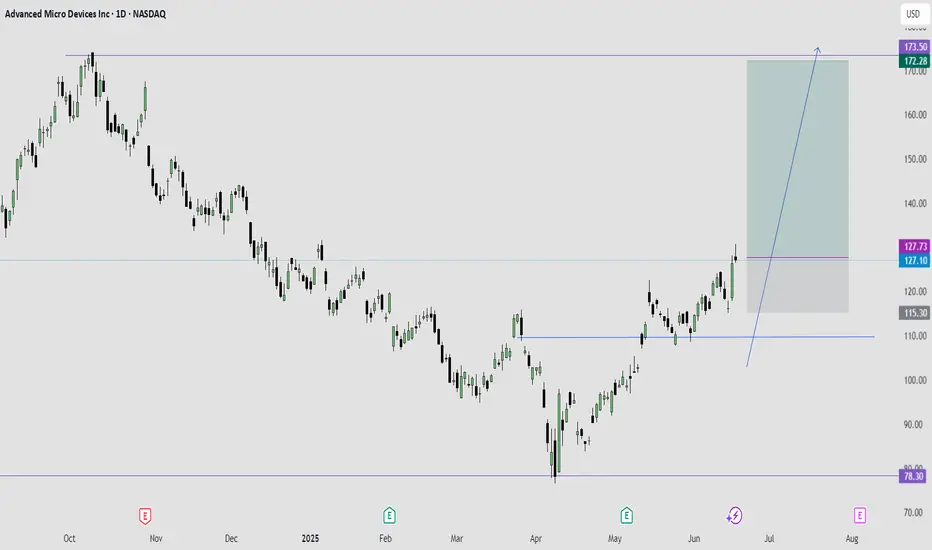
AMD IS READY FOR A STRONG BULLISH MOVENASDAQ:AMD Right now, am extremely bullish on AMD.
I expect AMD to give a good bullish run to trail NVIDIA.
Technically, AMD is supper bullish right now, having had a multiple bullish break of structure on the daily time frame.
I took a long entry on the bullish break of structure on daily time frame. Stop loss is below the recent structure swing low.
What do you see on your chart?
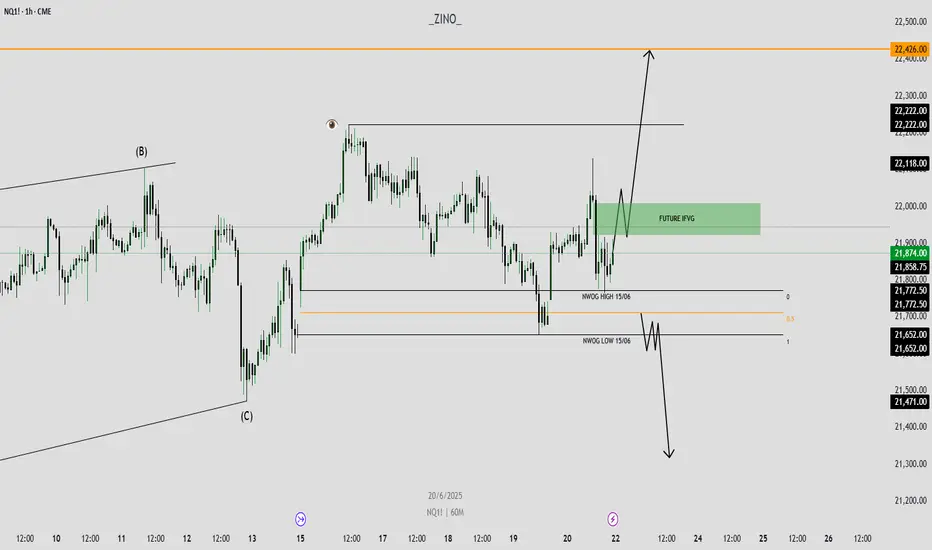
NQ 23/06/2025 BIASHERE IS MY SIMPLE IDEA ABOUT NQ FOR THE NEXT WEEK
everything is clear as the snapshot says
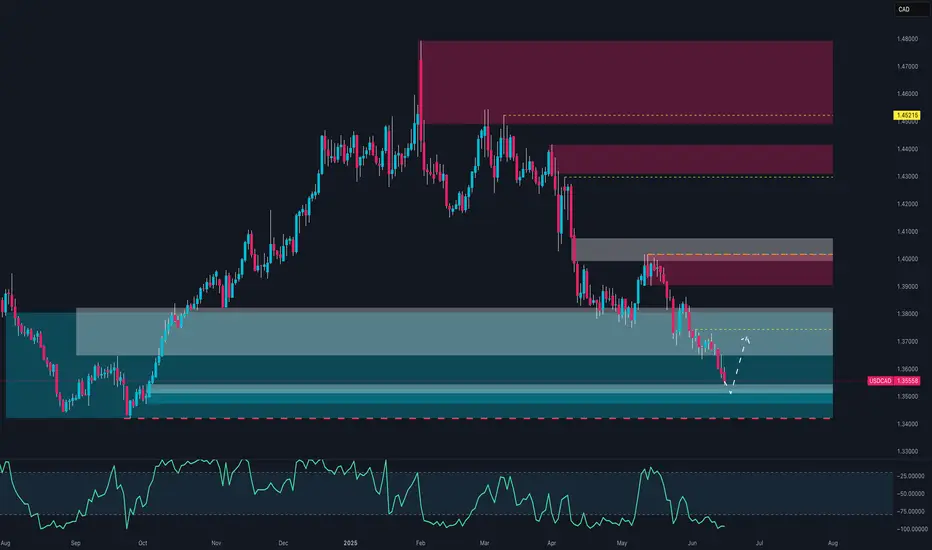
XAUUSD Weekly Outlook | June 23–27, 2025👋 Hey gold traders! As we close out the FOMC week and head into the final stretch of June, gold continues to hold bullish structure — but this week's candle is entering a very sensitive premium area. Let's break it all down in full top-down clarity:
🔍 Weekly Structure Update
✅ Weekly BOS confirmed since November 2023
✅ Price holding above EMA 5/21/50 — bullish lock intact
🔼 Current HH printed at 3452
📍Price is now entering a weekly FVG + supply trap zone around 3440–3460
🟣 RSI divergence starting to appear — caution in premium
🗺 Key Weekly Zones
Type Price Range Context
🔵 Demand Zone 3150 – 3190 Weekly OB + EMA50 confluence
🟣 FVG Support 3284 – 3320 Fresh imbalance post BOS
🟠 Flip Zone 3363 – 3385 Retest of BOS + FVG bottom
🔴 Sell Trap Zone 3440 – 3460 Weekly OB + liquidity sweep area
🧠 Bias This Week
📌 Bullish, but extended.
We expect a reaction from 3440–3460, not blind continuation.
The next healthy buy opportunity is only valid on a retrace toward 3320–3280, aligned with imbalance + structure.
🧭 GoldFxMinds Game Plan
Above 3440–3460 = overextension — wait for trap/sweep confirmation 🧨
Below 3363 = bearish flip zone — risk of revisiting 3280
Ideal buy = 3284–3320 → only on bullish PA or reversal confirmation
📰 Upcoming Economic Events (June 23–27)
🗣 FOMC Speakers flood the week (Waller, Powell, Williams, Goolsbee, Hammack, etc.)
🏠 Existing & New Home Sales, Consumer Confidence, Pending Home Sales
🛢 Crude Oil & Natural Gas Inventory reports
📊 Final GDP q/q, Core PCE, Personal Spending/Income
📉 Durable Goods, Unemployment Claims
🧪 Bank Stress Test Results (Friday)
⚠️ This is a dense news week — stay alert for surprise volatility, especially around Powell’s testimonies (Tue & Wed).
⚠️ Summary:
We are no longer in discount — we are inside the premium trap. Gold remains bullish, but 3440–3460 is a red flag zone. If this becomes the top, watch the flip at 3363–3385. Only re-enter long if structure confirms.
💬 If you found this helpful, drop a comment, give it a like, and make sure to follow GoldFxMinds for more sniper-level updates every week!
📣 This post was made using the Trade Nation chart feed. As a partner in their influencer program, I receive compensation for using and sharing their tools.