EUR/USD - Eyes on the major resistance at 1.1540!Introduction
The EUR/USD currency pair has been trending downward on the 1-hour timeframe, indicating that bearish momentum is firmly in control. In this analysis, I will outline what to expect from the pair moving forward, and highlight the high-confluence zone that could offer a potential short setup. This area combines technical factors that suggest it may act as strong resistance if price retraces upward before continuing the downtrend.
Market Structure
On the 1-hour chart, the EUR/USD continues to form a series of lower highs and lower lows, which clearly confirms a bearish market structure. This consistent pattern reinforces that sellers have the upper hand, and that any short-term rallies are likely to be corrective in nature, not trend-changing. As long as this structure remains intact, the broader expectation remains bearish, with sellers likely to defend key resistance levels.
Fair Value Gaps on the 15-Minute and 1-Hour Timeframes
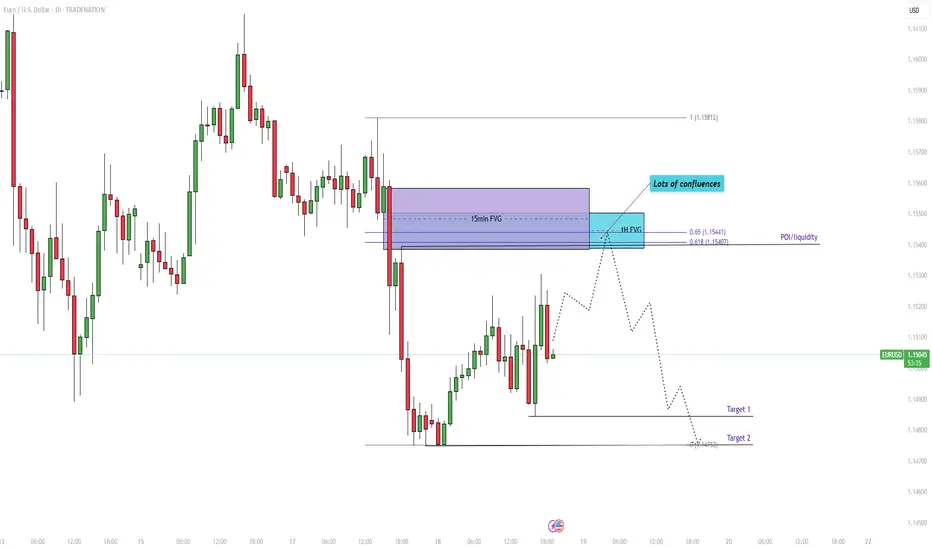
During the latest downward movement, the pair left behind two notable Fair Value Gaps, one on the 1-hour chart and another on the 15-minute chart. These imbalances are closely aligned, creating a strong confluence zone where price may face resistance if it moves back upward. The zone between 1.15400 and 1.15600 represents this overlapping FVG area. Because these gaps were formed by aggressive selling pressure, revisiting this level could trigger a bearish reaction, as traders look to re-enter short positions from a premium price.
Golden Pocket Fibonacci Retracement
Adding to this confluence, the Golden Pocket, the area between the 61.8% and 65% Fibonacci retracement levels, lies between 1.15407 and 1.15441. This zone is widely respected among traders due to its tendency to act as a reversal point in trending markets. The fact that it aligns so closely with both the 15-minute and 1-hour FVGs increases the likelihood of price reacting here. If the market retraces into this pocket, we could see renewed selling pressure, making it a valuable level to watch for short entries.
Point of Interest and Liquidity Zone
Within the latest leg down, there was a brief two-hour consolidation before the pair continued lower, leaving behind a distinct wick to the upside. This area is significant because it likely represents a point of interest where buy-side liquidity was grabbed. Many traders who entered shorts early may have placed their stop-losses above this consolidation high, creating a liquidity pool. This level, sitting inside the broader resistance zone formed by the FVGs and the Golden Pocket, adds another layer of technical significance. Price may move into this liquidity before reversing lower, offering a potential trap for buyers and an opportunity for sellers.
Downside Targets
If the price reacts to the resistance zone and resumes its downward movement, there are two logical targets to the downside. The first is 1.1485, which corresponds to the most recent swing low. The second target is 1.1475, which represents a deeper low and a stronger potential support level. These levels align with previous structure and could serve as key take-profit zones for traders holding short positions.
Conclusion
The EUR/USD remains in a well-defined downtrend, and several technical elements now converge between 1.15400 and 1.15600 to form a strong resistance zone. This area includes the 15-minute Fair Value Gap, the 1-hour Fair Value Gap, the Golden Pocket Fibonacci retracement, and a significant point of interest tied to liquidity. While the pair may not need to reach this zone before continuing lower, if it does, it is likely to act as a barrier to further upside. For traders looking to follow the dominant trend, this high-confluence area offers a potential entry point to the downside, with clear structure-based targets below.
Disclosure: I am part of Trade Nation's Influencer program and receive a monthly fee for using their TradingView charts in my analysis.
Thanks for your support.
- Make sure to follow me so you don't miss out on the next analysis!
- Drop a like and leave a comment!
Ict
Short on SOL Here is a short idea on SOLUSDT perpetual contract on Binance.
I also include my overall analysis. I hope you find this useful.
Thank you!
- R2F Trading

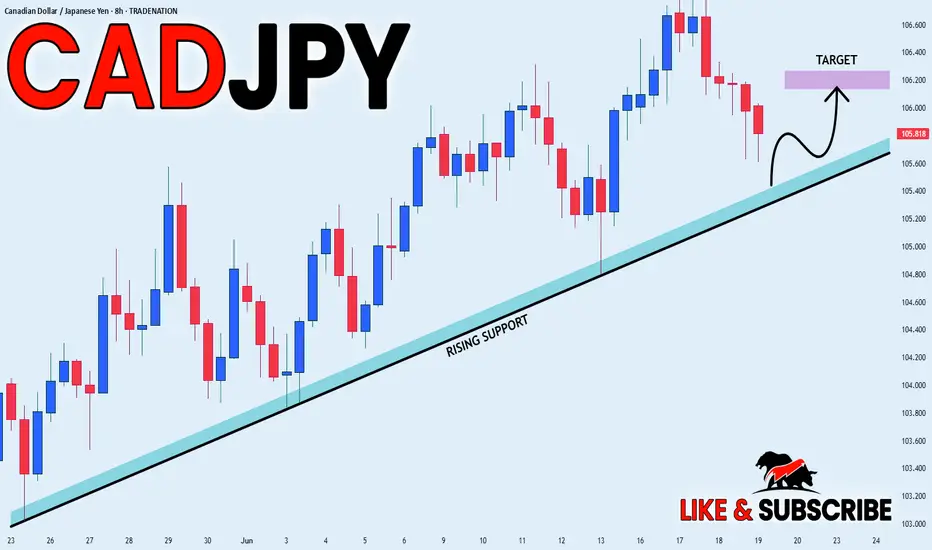
CAD_JPY WILL GROW|LONG|
✅CAD_JPY will soon hit
A rising support line and
As we are bullish biased
On the pair overall we will
Be expecting a local bullish
Rebound and a bullish move up
LONG🚀
✅Like and subscribe to never miss a new idea!✅
Disclosure: I am part of Trade Nation's Influencer program and receive a monthly fee for using their TradingView charts in my analysis.
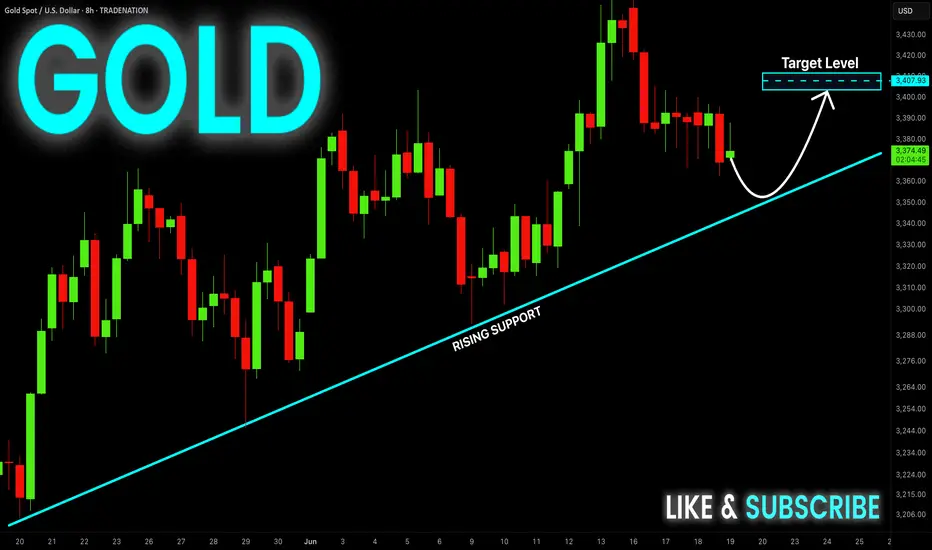
GOLD Rising Support Ahead! Buy!
Hello,Traders!
GOLD is trading in an uptrend
So despite the price is going
Down now we will be expecting
A strong rebound and a move up
After the price hits the
Rising support below
Buy!
Comment and subscribe to help us grow!
Check out other forecasts below too!
Disclosure: I am part of Trade Nation's Influencer program and receive a monthly fee for using their TradingView charts in my analysis.
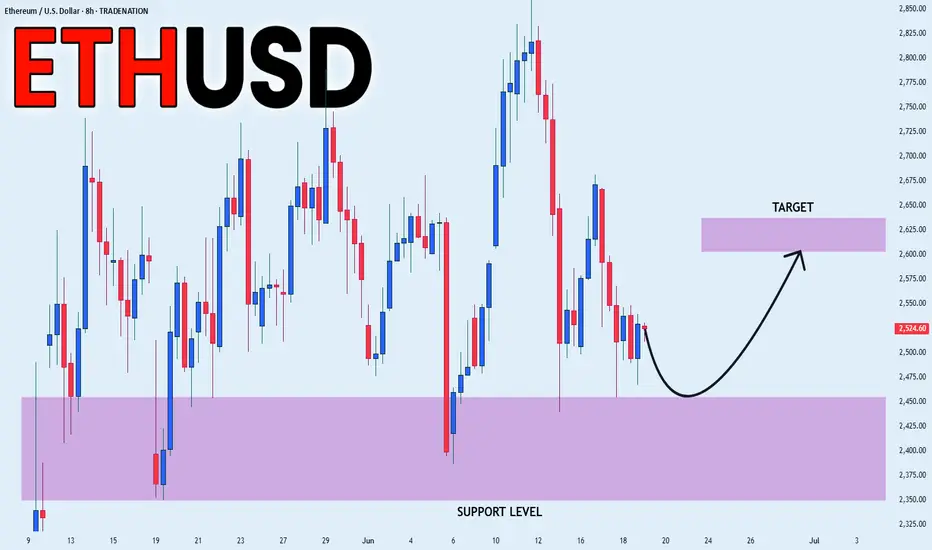
ETHEREUM LOCAL LONG|
✅ETHEREUM is going down now
But a strong support level is ahead at 2,375$
Thus I am expecting a rebound
And a move up towards the target of 2,600$
LONG🚀
✅Like and subscribe to never miss a new idea!✅
Disclosure: I am part of Trade Nation's Influencer program and receive a monthly fee for using their TradingView charts in my analysis.
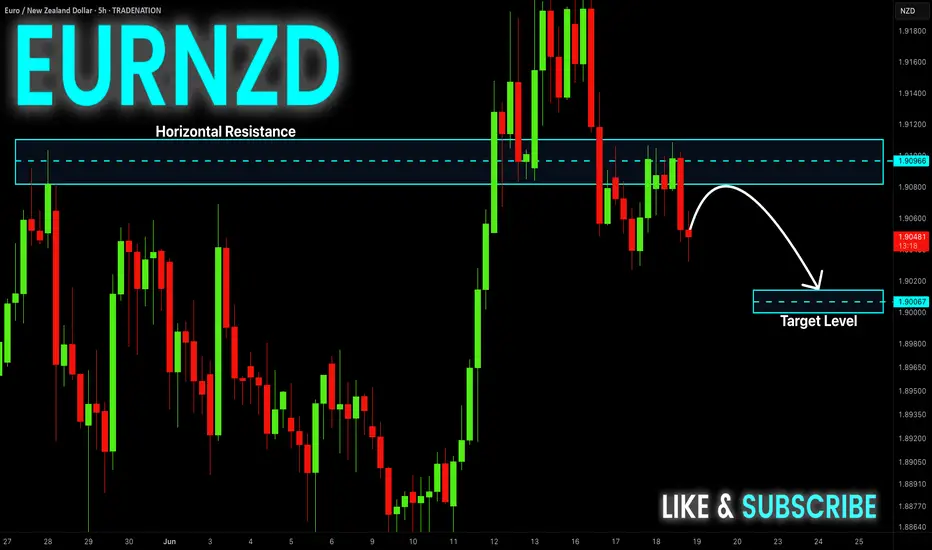
EUR-NZD Will Go Down! Sell!
Hello,Traders!
EUR-NZD made a retest
Of the horizontal resistance
Level of 1.9100 and made a
Nice pullback so we are bearish
Biased and we will be expecting
A further bearish move down
Sell!
Comment and subscribe to help us grow!
Check out other forecasts below too!
Disclosure: I am part of Trade Nation's Influencer program and receive a monthly fee for using their TradingView charts in my analysis.
GBP/USD - SMT with EUR/USD, SHORTExcited to share my first idea with you guys !
To start with, my name is Soulayman and have started my trading journey in October 2024. It was very hard at first, but after hard work and dedication we all know we can make it happen. I basically studied ICT concepts, and was able to integrate those into a system that I have built myself ( this is what every trader should do in my opinion, it will make you understand better ).
And that is why I am here today on Trading View, sharing my first ever idea with you guys !
I'll make it very simple , no extravagant analysis or super complicated trendlines all over the place ... =D
This is what I see :
1 - GBP/USD potentially forming a SMT with EUR/USD after sweeping London High located inside a fair value gap (which makes this play stronger)
2- After the sweep occurs, I will be waiting on a 5 MINUTE break of structure (since 1 min break outs are manipulation most of the times so i prefer to stay safe). If this is followed by a fair value gap, it reinforces our idea showing the market has intent to push price lower.
3 - Now , let's talk about the HIGH TIME FRAME structure (4H) clearly shows the price wants to sell and that it is targeting Sellside liquidity Equal Lows. We could than anticipate a reversal from there.
We currently have price pulling back towards the HTF FVG, failed to close above the most recent high and having bearish reaction.
Since everything aligns with our BIAS, we will let it play out and wait on the sweep !
I will be posting updates during the day =D
Stay tuned ! Talk to you guys soon !

DXY: Bulls Are Winning! Long!
My dear friends,
Today we will analyse DXY together☺️
The recent price action suggests a shift in mid-term momentum. A break above the current local range around 98. 059 will confirm the new direction upwards with the target being the next key level of 98.148 and a reconvened placement of a stop-loss beyond the range.
❤️Sending you lots of Love and Hugs❤️

GOLD: Next Move Is Up! Long!
My dear friends,
Today we will analyse GOLD together☺️
The in-trend continuation seems likely as the current long-term trend appears to be strong, and price is holding above a key level of 3,382.62 So a bullish continuation seems plausible, targeting the next high. We should enter on confirmation, and place a stop-loss beyond the recent swing level.
❤️Sending you lots of Love and Hugs❤️

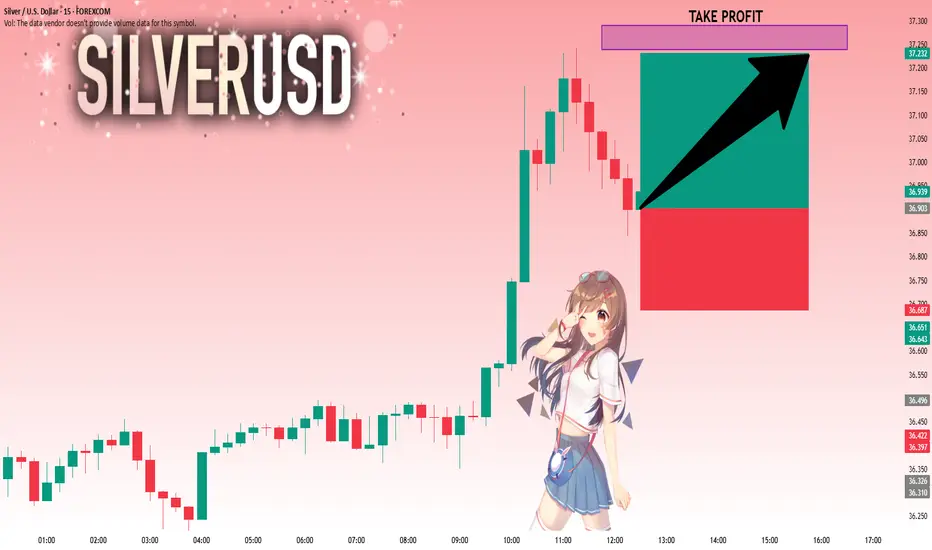
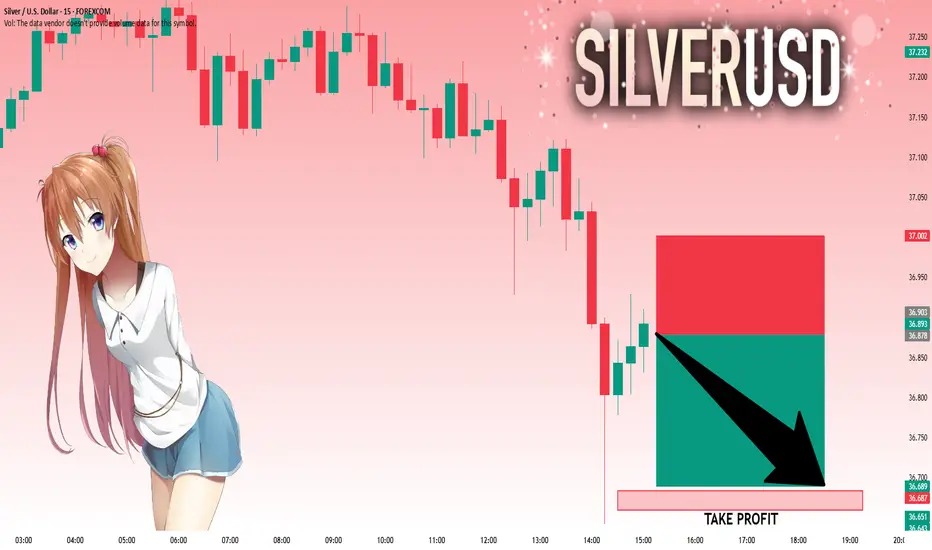
SILVER: Target Is Down! Short!
My dear friends,
Today we will analyse SILVER together☺️
The market is at an inflection zone and price has now reached an area around 36.878 where previous reversals or breakouts have occurred.And a price reaction that we are seeing on multiple timeframes here could signal the next move down so we can enter on confirmation, and target the next key level of 36.687..Stop-loss is recommended beyond the inflection zone.
❤️Sending you lots of Love and Hugs❤️
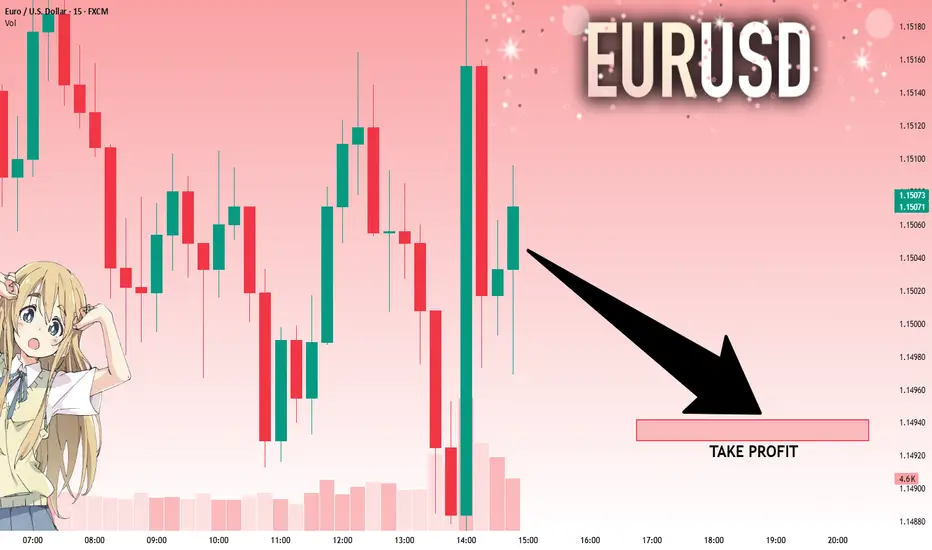
EURUSD: Move Down Expected! Short!
My dear friends,
Today we will analyse EURUSD together☺️
The price is near a wide key level
and the pair is approaching a significant decision level of 1.15043 Therefore, a strong bearish reaction here could determine the next move down.We will watch for a confirmation candle, and then target the next key level of 1.14942..Recommend Stop-loss is beyond the current level.
❤️Sending you lots of Love and Hugs❤️
Bitcoin - Trend Shift Confirmed, Eyes on $102.8K LiquidityMarket Context
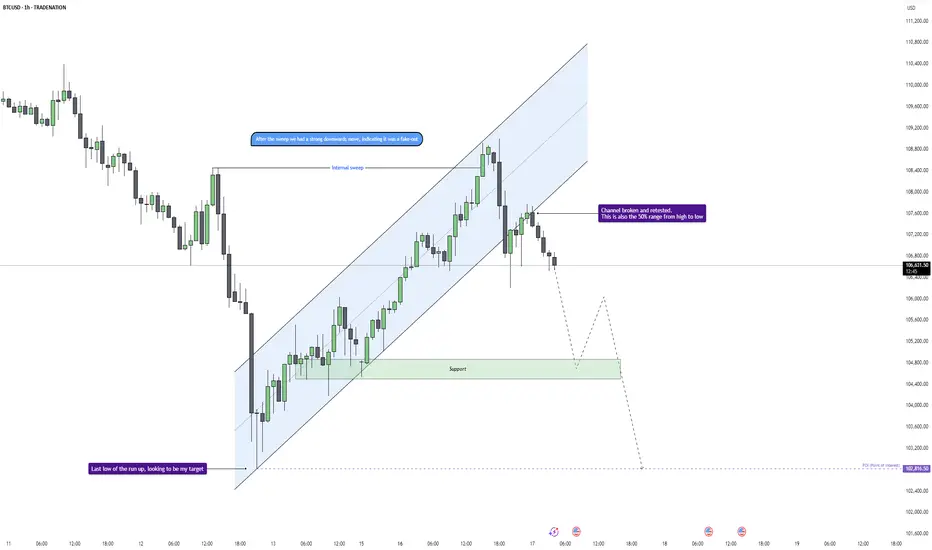
Bitcoin showed signs of exhaustion after a strong short-term rally within a clean upward channel on the 1H chart. Price action had been respecting the trend structure until a key deviation occurred near $108,500, where we saw an internal liquidity sweep that hinted at potential distribution.
Fake-Out Confirmation and Shift in Momentum
After taking out local highs around $108.5K, price failed to continue higher and instead reversed sharply, confirming the sweep as a classic fake-out. This kind of internal liquidity grab is typically used to trap breakout buyers before reversing and targeting previous lows.
Break of Structure and Channel Retest
The rising channel was broken convincingly, and price has now retested the underside of the channel, aligning with the 50% equilibrium of the entire high-to-low range. This reinforces the bearish bias and suggests the market has likely shifted from accumulation to distribution.
Downside Targets and Key Levels
Immediate support sits around $104.6K, which served as a consolidation base during the earlier run-up. If this level fails to hold, the next key target would be a sweep of the previous significant low at $102.8K. This area is marked as a point of interest and could offer a reaction or reversal.
Price Expectations and Trade Outlook
As long as price remains below the broken channel and under $107K, the bearish scenario remains in play. I’m watching for bearish continuation into $104.6K first, and a potential full sweep toward $102.8K if that support fails.
Conclusion
The internal sweep followed by impulsive rejection, combined with a clear channel breakdown and retest, shifts the bias to bearish. A move into the $104.6K region seems probable, with a lower liquidity target at $102.8K in sight if downside pressure accelerates.
Disclosure: I am part of Trade Nation's Influencer program and receive a monthly fee for using their TradingView charts in my analysis.
___________________________________
Thanks for your support!
If you found this idea helpful or learned something new, drop a like 👍 and leave a comment, I’d love to hear your thoughts! 🚀
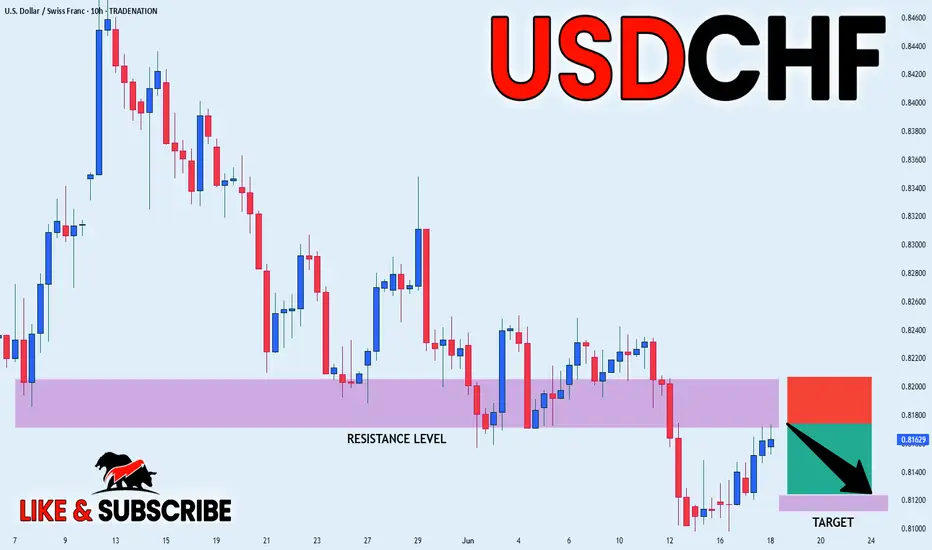
USD_CHF SHORT SIGNAL|
✅USD_CHF made a nice
Rebound from the support
Below just as we predicted in
Our previous analysis but is now
About to retest the horizontal
Resistance of 0.8200 from where
We can go short with the TP
Of 0.8124 and the SL of 0.8207
SHORT🔥
✅Like and subscribe to never miss a new idea!✅
Disclosure: I am part of Trade Nation's Influencer program and receive a monthly fee for using their TradingView charts in my analysis.
GBPUSD - Analysis (18th June 2025)Here is an analysis on Cable, and basically showcasing how I would form a bias, a narrative, an potential trade setups.
I hope it is insightful for you.
- R2F Trading

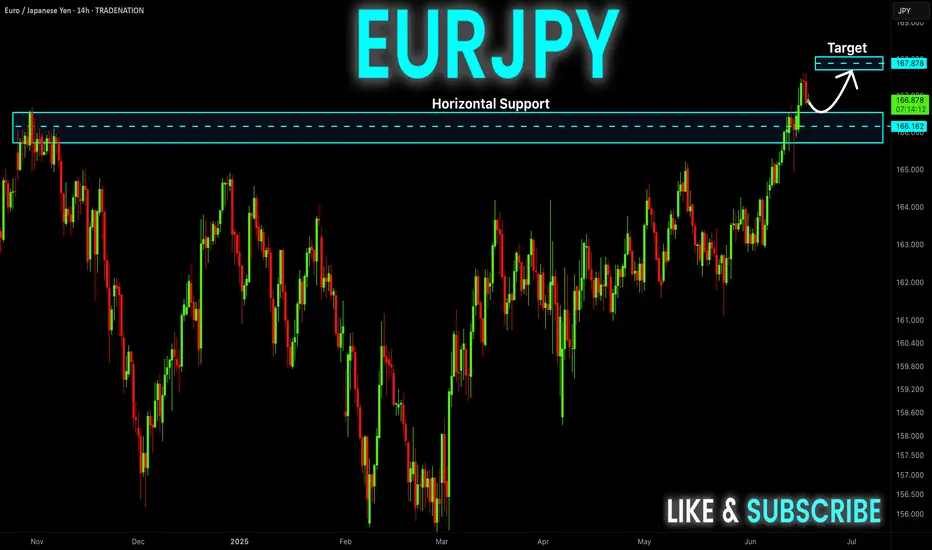
EUR-JPY Bullish Continuation! Buy!
Hello,Traders!
EUR-JPY is trading in an
Uptrend and the pair made
A bullish breakout of the key
Horizontal level of 166.162
And the breakout is confirmed
So after the retest of the
New support we will be
Expecting a bullish continuation
Buy!
Comment and subscribe to help us grow!
Check out other forecasts below too!
Disclosure: I am part of Trade Nation's Influencer program and receive a monthly fee for using their TradingView charts in my analysis.
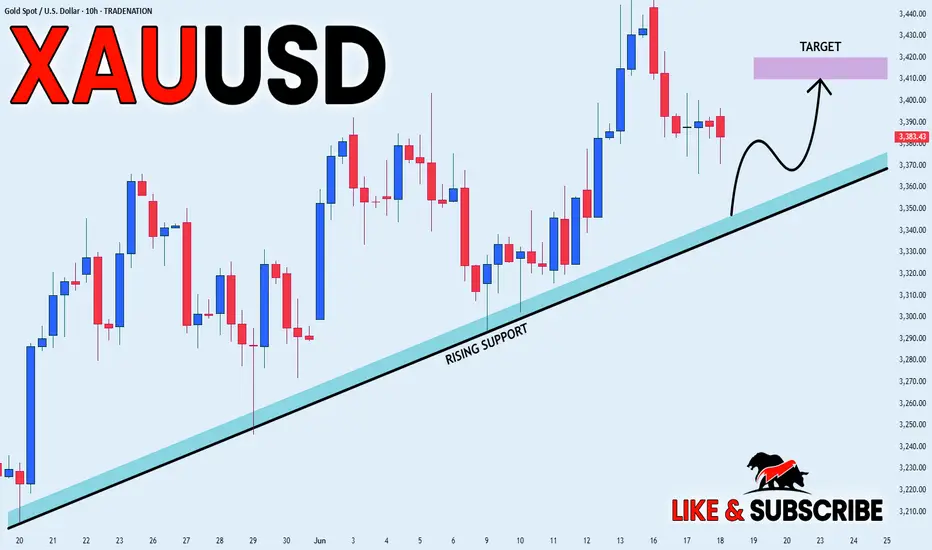
GOLD SUPPORT AHEAD|LONG|
✅GOLD is trading in an uptrend
With the price set to retest
The rising support line
From where I think the growth will continue
LONG🚀
✅Like and subscribe to never miss a new idea!✅
Disclosure: I am part of Trade Nation's Influencer program and receive a monthly fee for using their TradingView charts in my analysis.
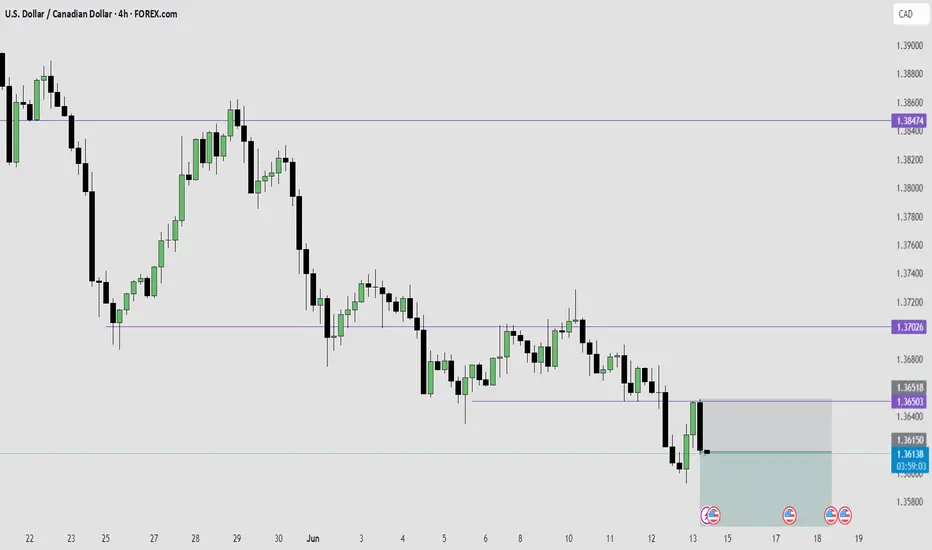
USDCAD SHORT IDEA- USDCAD Is EXTREMELY WEAK AND READY FOR SELLOANDA:USDCAD USDCAD Is extremely weak I expect price to drop hard from here.
TRADE BREAKDOWN
Weekly Trend is Bearish.
Daily Trend is Bearish.
4H Trend is also Bearish.
This is 100% a trend following strategy trade.
The entry is taken on 4H time frame targeting the recent weekly swing low.
This is a 4RR Trade.
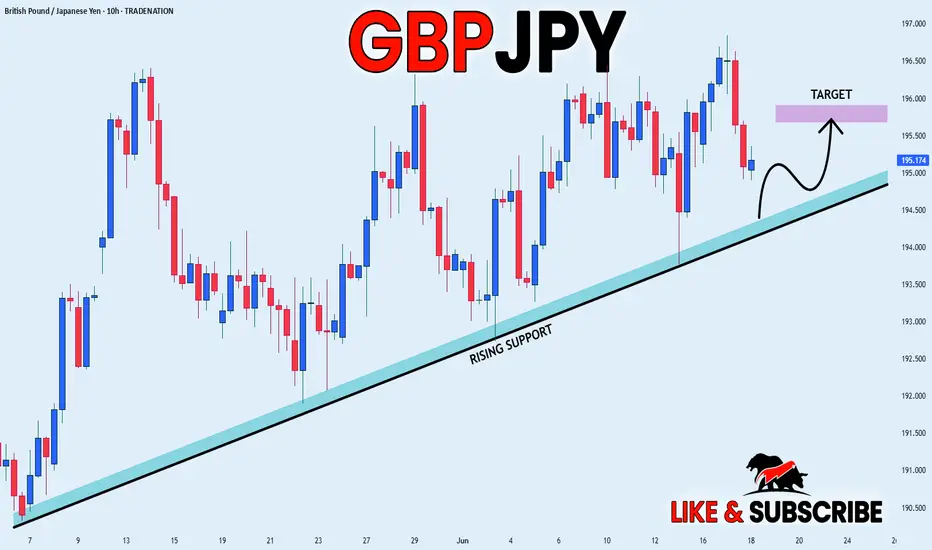
GBP_JPY RISING SUPPORT|LONG|
✅GBP_JPY is trading along the rising support
And as the pair will soon retest it
I am expecting the price to go up
To retest the supply levels above at 195.733
LONG🚀
✅Like and subscribe to never miss a new idea!✅
Disclosure: I am part of Trade Nation's Influencer program and receive a monthly fee for using their TradingView charts in my analysis.
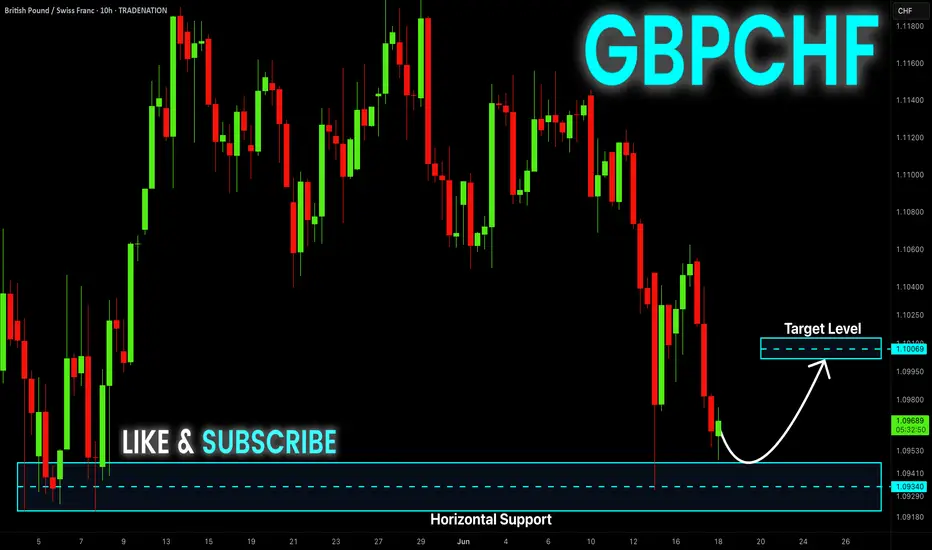
GBP-CHF Support Ahead! Buy!
Hello,Traders!
GBP-CHF keeps falling but
A strong horizontal support
Level is ahead at 1.0921
From where we will be
Expecting a rebound
And a local bullish move up
Buy!
Comment and subscribe to help us grow!
Check out other forecasts below too!
Disclosure: I am part of Trade Nation's Influencer program and receive a monthly fee for using their TradingView charts in my analysis.
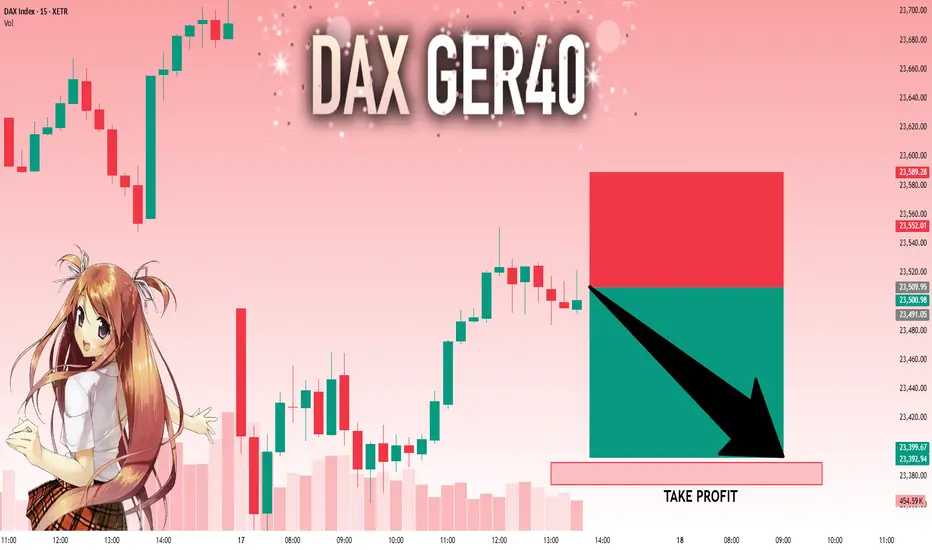
DAX: Local Bearish Bias! Short!
My dear friends,
Today we will analyse DAX together☺️
The recent price action suggests a shift in mid-term momentum. A break below the current local range around 23,509.95 will confirm the new direction downwards with the target being the next key level of 23,389.15.and a reconvened placement of a stop-loss beyond the range.
❤️Sending you lots of Love and Hugs❤️
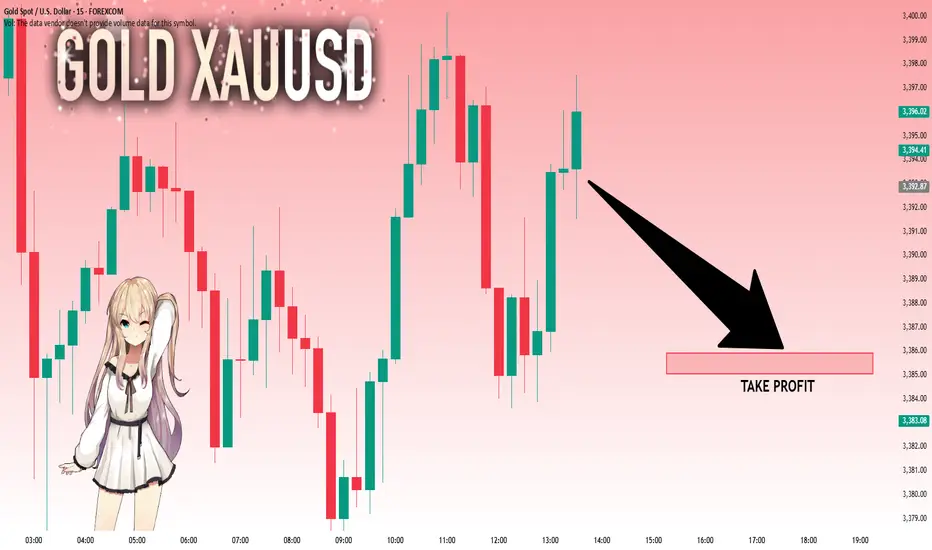
GOLD: Absolute Price Collapse Ahead! Short!
My dear friends,
Today we will analyse GOLD together☺️
The in-trend continuation seems likely as the current long-term trend appears to be strong, and price is holding below a key level of 3,394.60 So a bearish continuation seems plausible, targeting the next low. We should enter on confirmation, and place a stop-loss beyond the recent swing level.
❤️Sending you lots of Love and Hugs❤️
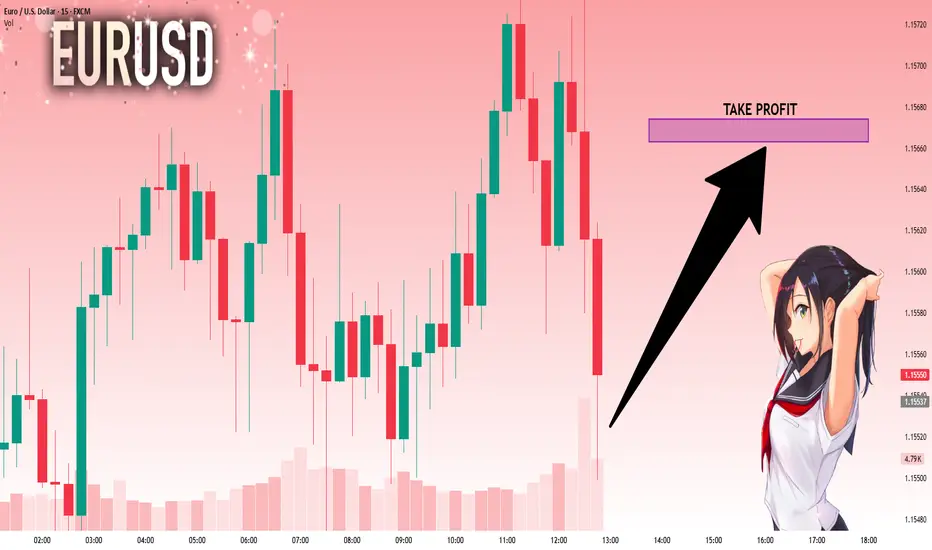
EURUSD: Will Go Up! Long!
My dear friends,
Today we will analyse EURUSD together☺️
The market is at an inflection zone and price has now reached an area around 1.15524 where previous reversals or breakouts have occurred.And a price reaction that we are seeing on multiple timeframes here could signal the next move up so we can enter on confirmation, and target the next key level of 1.15663.Stop-loss is recommended beyond the inflection zone.
❤️Sending you lots of Love and Hugs❤️
SILVER: The Market Is Looking Up! Long!
My dear friends,
Today we will analyse SILVER together☺️
The price is near a wide key level
and the pair is approaching a significant decision level of 36.903 Therefore, a strong bullish reaction here could determine the next move up.We will watch for a confirmation candle, and then target the next key level of 37.240 .Recommend Stop-loss is beyond the current level.
❤️Sending you lots of Love and Hugs❤️