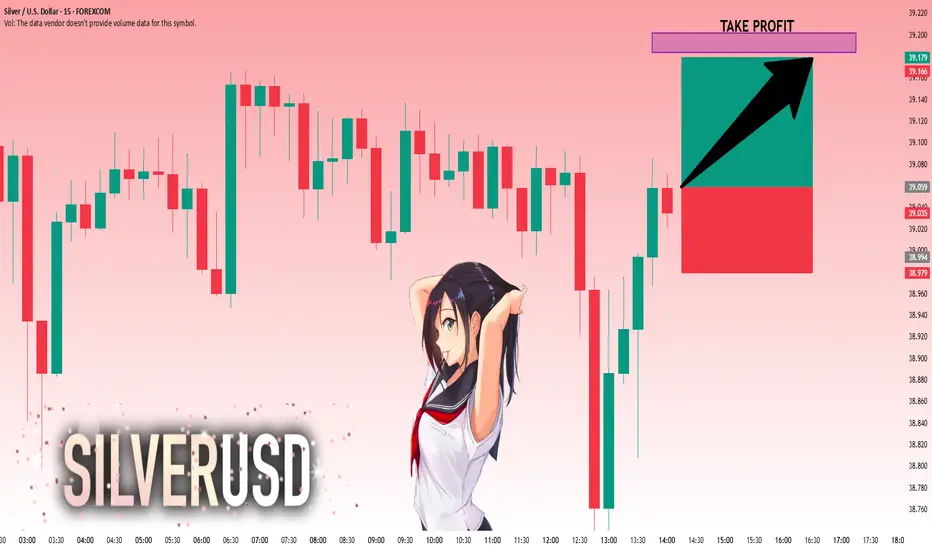
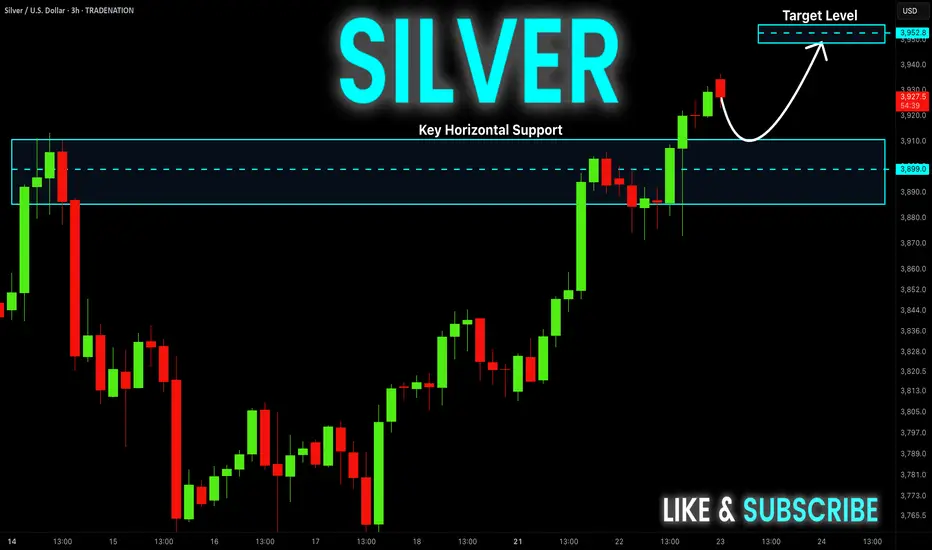
SILVER: Bulls Are Winning! Long!
My dear friends,
Today we will analyse SILVER together☺️
The market is at an inflection zone and price has now reached an area around 39.025 where previous reversals or breakouts have occurred.And a price reaction that we are seeing on multiple timeframes here could signal the next move up so we can enter on confirmation, and target the next key level of 39.148.Stop-loss is recommended beyond the inflection zone.
❤️Sending you lots of Love and Hugs❤️
Ict
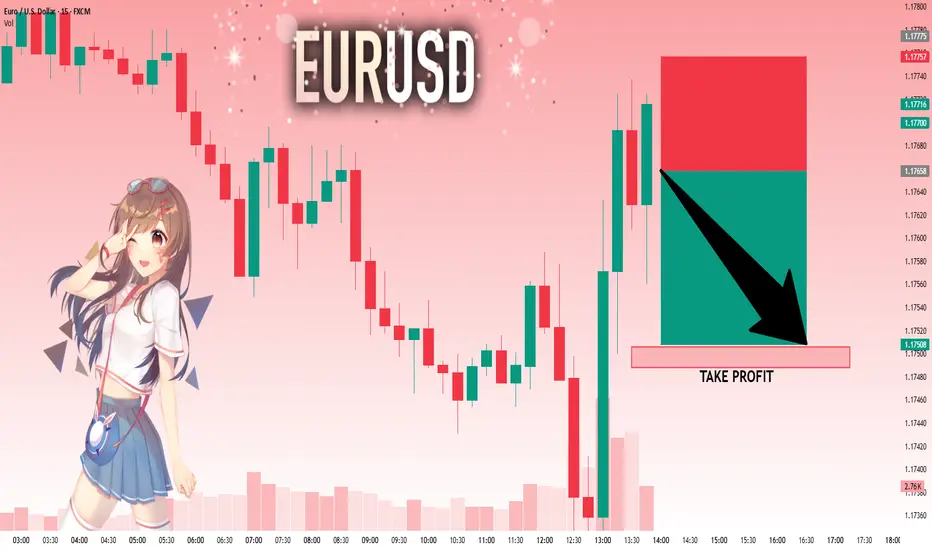
EURUSD: Next Move Is Down! Short!
My dear friends,
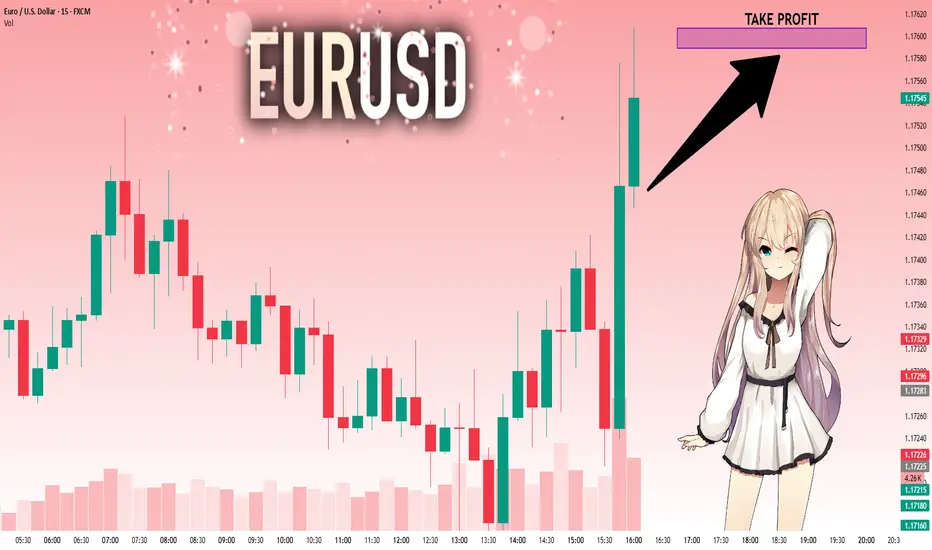
Today we will analyse EURUSD together☺️
The price is near a wide key level
and the pair is approaching a significant decision level of 1.17658 Therefore, a strong bearish reaction here could determine the next move down.We will watch for a confirmation candle, and then target the next key level of 1.17506..Recommend Stop-loss is beyond the current level.
❤️Sending you lots of Love and Hugs❤️
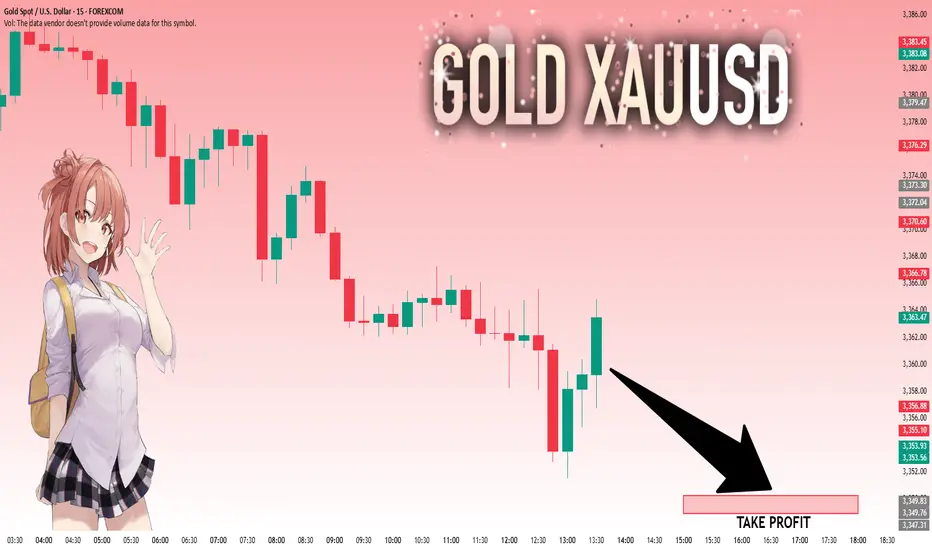
GOLD: Target Is Down! Short!
My dear friends,
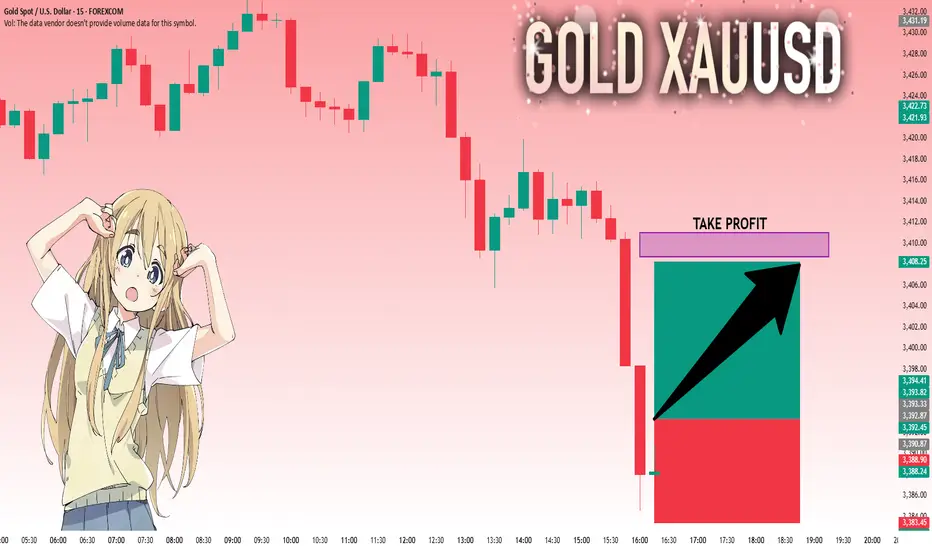
Today we will analyse GOLD together☺️
The recent price action suggests a shift in mid-term momentum. A break below the current local range around 3,359.59 will confirm the new direction downwards with the target being the next key level of 3,350.22.and a reconvened placement of a stop-loss beyond the range.
❤️Sending you lots of Love and Hugs❤️
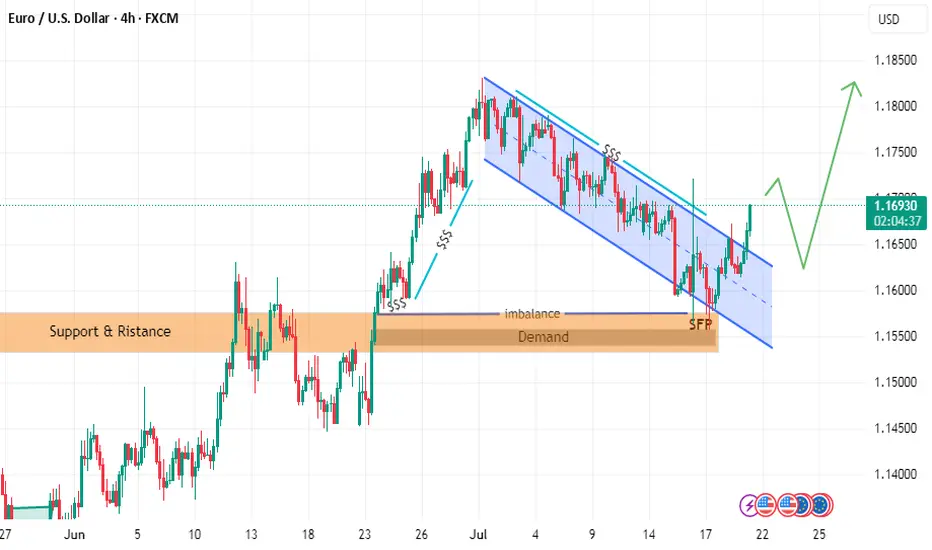
follow EURUSD LION & PLANE BUY SETUPTHE PRICE has moved as I explained in the last two posts
but we have some update to go along the way
the price could break failing channel
and withdrawal liquidity and filled imbalance
hence reflect from demand zone with zero reflection as i explained in last post with rock and plane
and it will go up to take liquidity in failing channel or downtrend
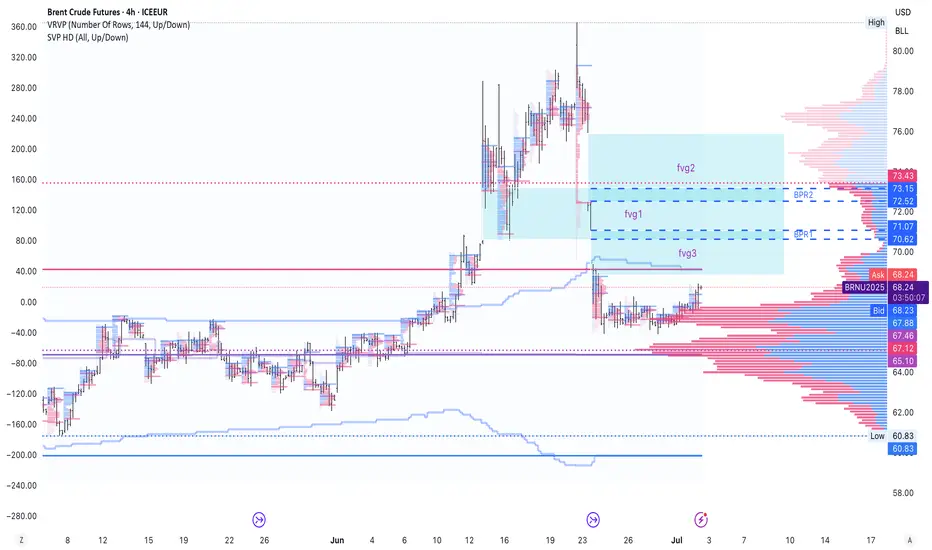
to identify BPRs on Brent Oil FuturesI am not good at the ICT price action style. So I got 2 questions for traders that know this well.
1. Did i draw the correct BPRs? I use both bars and volume profile to filter FVGs
2. Do you only use BPRs to do after break trend following or position closing, or you can actually use them in resistance reversal entry?
Need your help and advice mates.
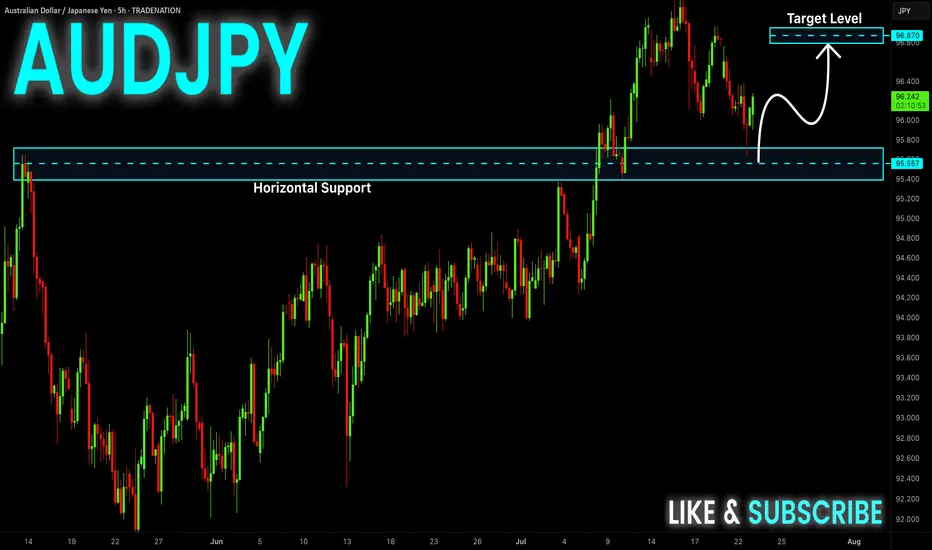
AUDJPY Bullish Order Block In SightOANDA:AUDJPY Price finds Support at the Swing Low @ 95.629 and creates a Swing High @ 96.741!
Based on the ICT Method, the Swing Low broke Sell-Side Liquidity @ 95.995 and opened up a Bullish Order Block Opportunity @ 96.217!
Price is currently working down from 96.49 at the time of publishing but once Price visits the Order Block, this could deliver Long Opportunities!!

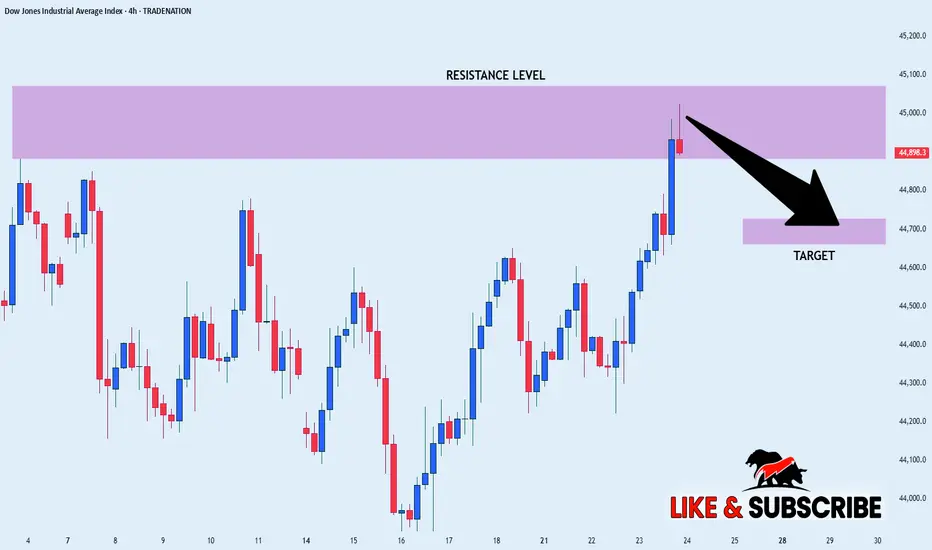
US30 SHORT FORM RESISTANCE|
✅DOW JONES index keeps
Growing in a strong uptrend
And we are bullish biased long-term
However the price has hit an all-time-high
Resistance level of 45,072(which can be seen
Further left you zoom out on higher TF)
So as we are already seeing a local
Bearish reaction we will be
Expecting a local bearish correction
SHORT🔥
✅Like and subscribe to never miss a new idea!✅
Disclosure: I am part of Trade Nation's Influencer program and receive a monthly fee for using their TradingView charts in my analysis.
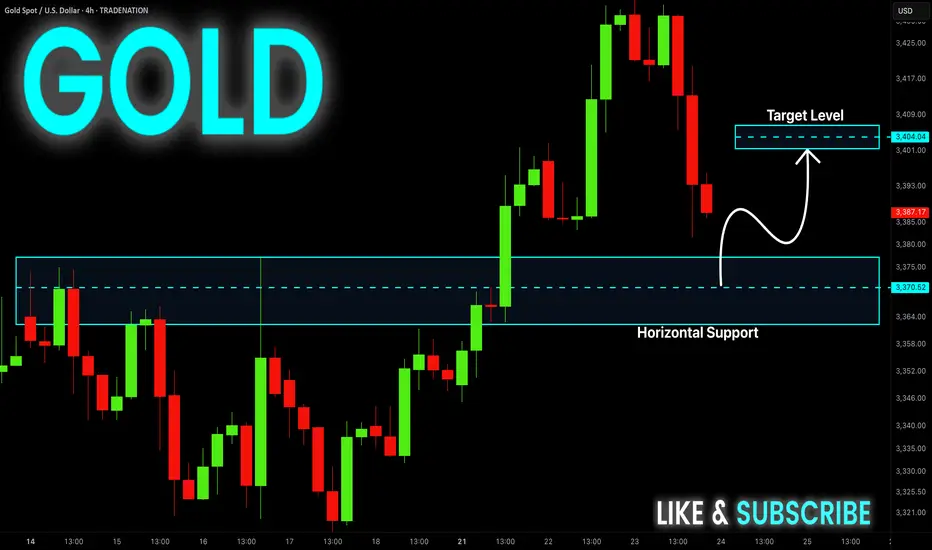
GOLD Rebound Ahead! Buy!
Hello,Traders!
GOLD is falling down now
But will soon hit a horizontal
Support level of 3375$
And as we are bullish biased
We will be expecting a rebound
And a local bullish correction
Buy!
Comment and subscribe to help us grow!
Check out other forecasts below too!
Disclosure: I am part of Trade Nation's Influencer program and receive a monthly fee for using their TradingView charts in my analysis.
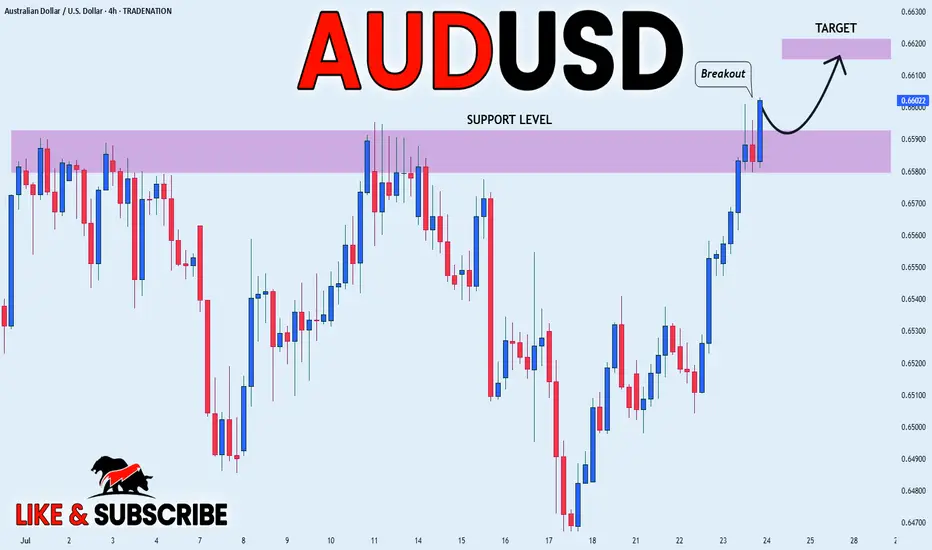
AUD_USD BULLISH BREAKOUT|LONG|
✅AUD_USD is going up
Now and the pair made a bullish
Breakout of the key horizontal
Level of 0.6590 and the breakout
Is confirmed so we are bullish
Biased and we will be expecting
A further bullish move up
LONG🚀
✅Like and subscribe to never miss a new idea!✅
Disclosure: I am part of Trade Nation's Influencer program and receive a monthly fee for using their TradingView charts in my analysis.
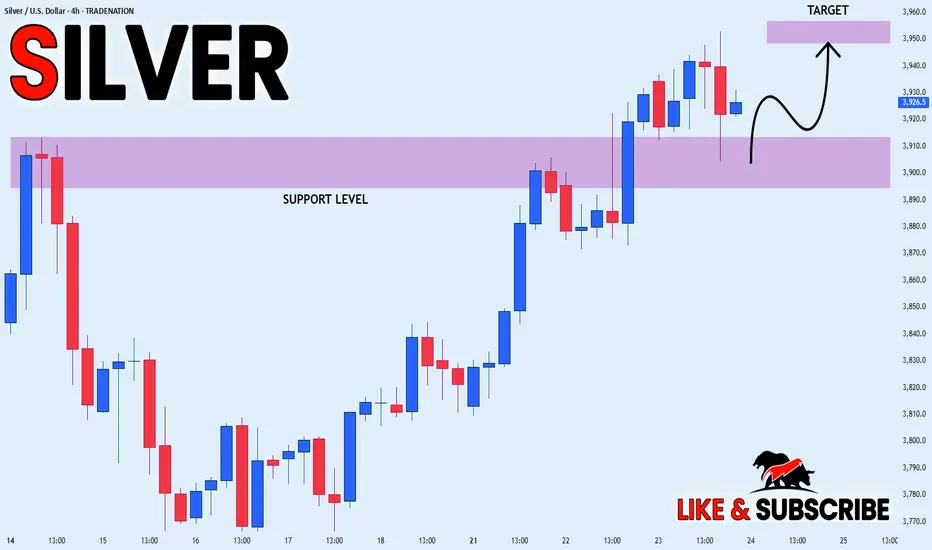
SILVER WILL KEEP GROWING|LONG|
✅SILVER is trading in an
Uptrend and the price made
A retest of the horizontal support
Level of 39.10$ and we are already
Seeing a bullish reaction so we
Are bullish biased and we will be
Expecting a further bullish move up
LONG🚀
✅Like and subscribe to never miss a new idea!✅
Disclosure: I am part of Trade Nation's Influencer program and receive a monthly fee for using their TradingView charts in my analysis.
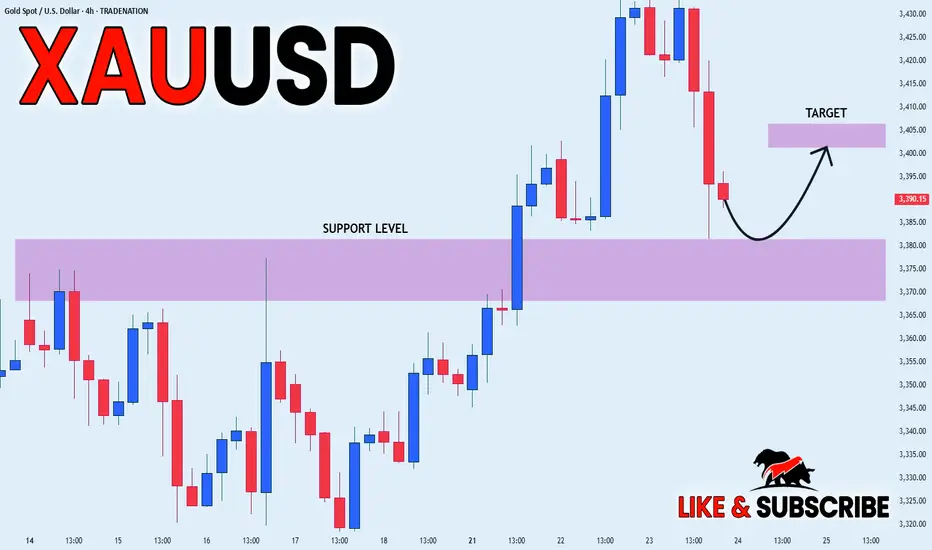
GOLD LOCAL LONG|
✅GOLD went down from
The resistance just as I predicted
But a strong support level is ahead at 3380$
Thus I am expecting a rebound
And a move up towards the target of 3400$
LONG🚀
✅Like and subscribe to never miss a new idea!✅
Disclosure: I am part of Trade Nation's Influencer program and receive a monthly fee for using their TradingView charts in my analysis.
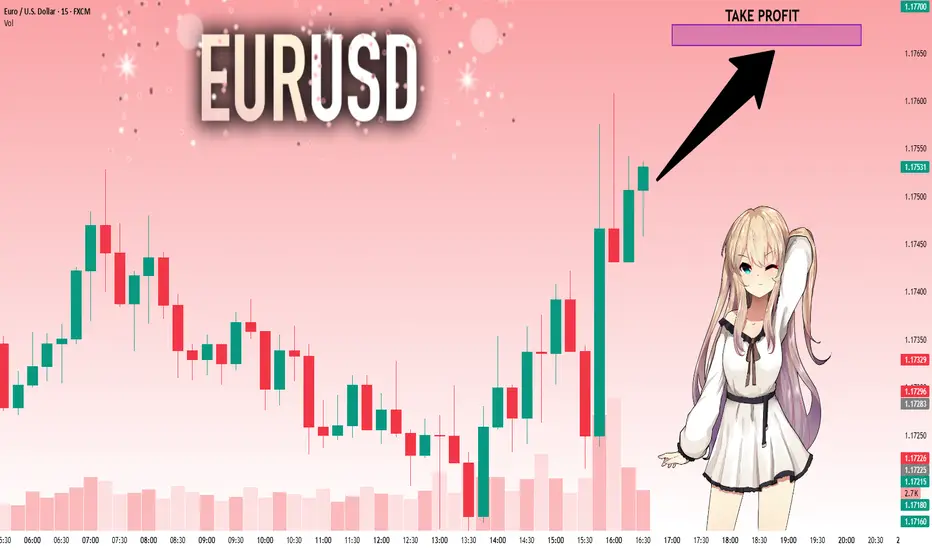
EUR/USD About to Trap the Bears? Final Push Before the Drop! EUR/USD is showing a solid short-term bullish structure, with a move initiated from the demand base around 1.1560, fueling a strong rally toward the current level near 1.1770. Price is now approaching a significant supply zone between 1.1790 and 1.1875, previously responsible for the last major bearish swing. This area also aligns with projected Fibonacci levels (25%-100%), reinforcing its relevance as a possible inflection point.
This movement suggests there’s still room for price to push higher, likely completing the final leg of this bullish cycle before a more convincing short setup develops. At this stage, Fibonacci levels are not acting as firm supports, but rather as hypothetical pullback projections: once price enters the 1.1800–1.1875 area, it will be key to monitor for signs of exhaustion. A rejection here may initiate a bearish retracement toward 1.1670–1.1650, in line with the 62–70.5% fib levels.
Retail sentiment remains highly contrarian: 76% of traders are short, positioning themselves too early against the trend. This imbalance adds fuel for a potential continuation higher, as the market may seek to "squeeze" these premature shorts. Additionally, the COT report confirms growing institutional interest in the euro, with non-commercials increasing their net longs, while USD net long exposure continues to shrink.
Seasonality adds further confluence: late July is historically bullish for EUR/USD, suggesting one final leg up could materialize before a typically weaker August.
✅ Trading Outlook
EUR/USD is technically aligned for a final push toward the 1.1800–1.1875 premium zone, where a potential short opportunity may arise. The rally is currently driven by overextended retail shorts and supportive institutional flows. Only after price interacts with the upper supply zone should reversal signs be evaluated, with correction targets around 1.1670–1.1650. The ideal play: wait for confirmation of bearish intent in August, when seasonal weakness typically kicks in.

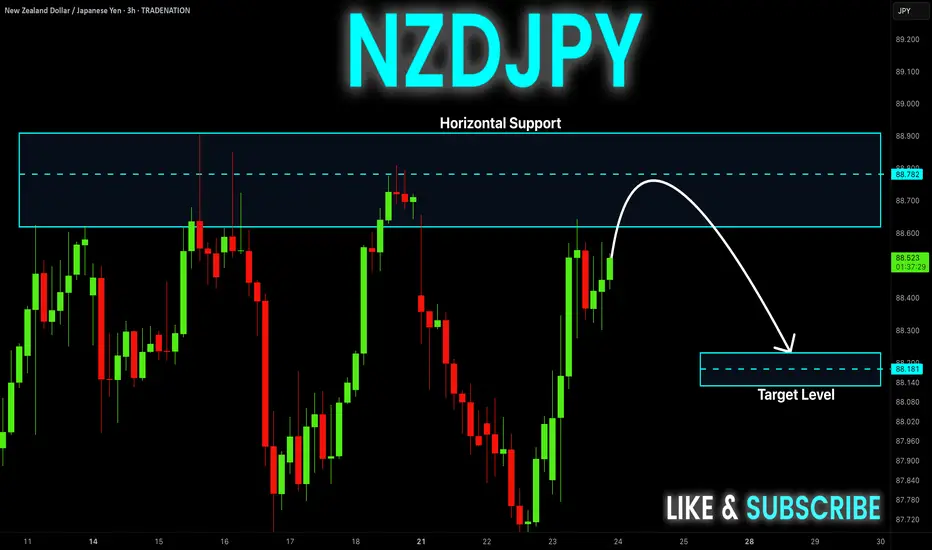
NZD-JPY Resistance Ahead! Sell!
Hello,Traders!
NZD-JPY is trading in an
Uptrend but the pair is locally
Overbought so after the pair
Hits the horizontal resistance
Level of 88.900 we will be
Expecting a local bearish
Move down
Sell!
Comment and subscribe to help us grow!
Check out other forecasts below too!
Disclosure: I am part of Trade Nation's Influencer program and receive a monthly fee for using their TradingView charts in my analysis.
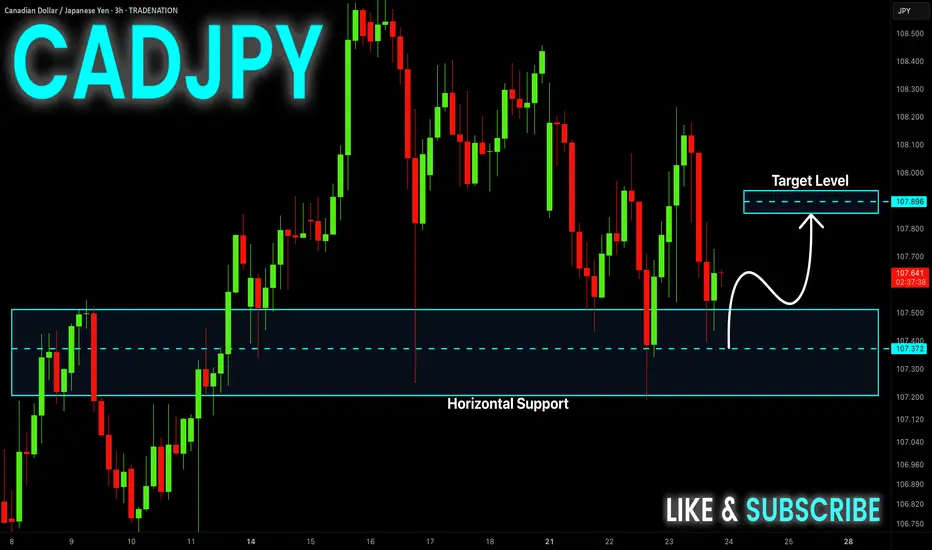
CAD-JPY Local Long! Buy!
Hello,Traders!
CAD-JPY made a retest
Of the horizontal support
Level of 107.400 and we
Are already seeing a bullish
Rebound and we will be
Expecting a further local
Bullish move up
Buy!
Comment and subscribe to help us grow!
Check out other forecasts below too!
Disclosure: I am part of Trade Nation's Influencer program and receive a monthly fee for using their TradingView charts in my analysis.
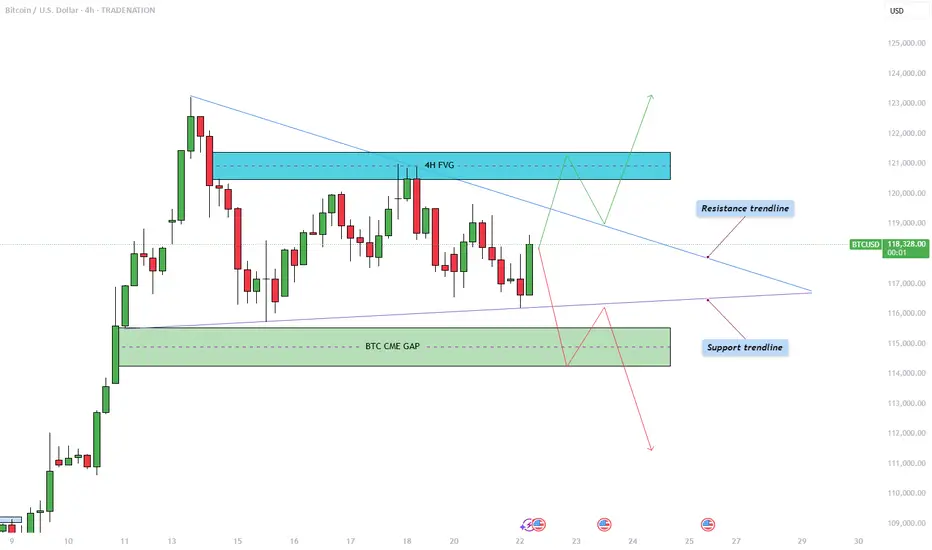
Bitcoin - Triangle pattern consolidation!The Bitcoin price action is currently coiling within a symmetrical triangle pattern on the 4-hour chart, as illustrated in the chart provided. After a significant bullish move earlier this month, BTC has now entered a phase of consolidation, marked by a series of lower highs and higher lows. This has formed a triangle pattern, suggesting an imminent breakout as price nears the apex. The upper boundary of the triangle acts as dynamic resistance, while the rising lower trendline provides firm support. Given the preceding upward momentum leading into this consolidation, the bias slightly favors a breakout to the upside, though the market can always surprise.
Bullish Scenario
In the bullish case, Bitcoin would need to break convincingly above the descending resistance trendline. Should that occur, the next key level to watch lies within the 4-hour bearish Fair Value Gap (FVG) between $120,500 and $121,400. This region represents an area of inefficiency where price moved rapidly in the past, and it is likely to attract selling pressure again. Bulls would ideally aim to reclaim this zone with strong momentum and potentially use it as support in a retest scenario. A successful retest of the triangle’s upper boundary could also trigger a liquidity grab above recent highs, particularly above the all-time high levels.
Bearish Scenario
On the flip side, a bearish breakout would involve BTC breaking below the ascending support trendline. If this happens, the most probable downside target would be the CME gap left behind from two weekends ago, located between $114,300 and $115,500. This price gap occurred due to the discrepancy between Friday’s closing price and Sunday’s opening price on the Chicago Mercantile Exchange, often a magnet for price reversion. After this gap is filled, it is possible that BTC sees a short-term bounce to retest the triangle from below, before potentially continuing lower to address further imbalances in price action.
How to Confirm a Valid Breakout
Trading triangle patterns can be deceptive, as BTC often exhibits false breakouts designed to trap traders on the wrong side. To confirm a valid breakout, it's crucial to observe at least a few 4-hour candles closing decisively above or below the triangle boundaries. Additionally, breakout strength should be accompanied by a noticeable increase in volume. A breakout without volume confirmation is often a sign of a fake move, and entering trades under such conditions can be highly risky.
Final Thoughts
BTC is currently consolidating within this symmetrical triangle formation, signaling a period of indecision and potential volatility ahead. While both bullish and bearish scenarios are plausible, it is essential to wait for clear confirmation before committing to a position. Patience and discipline are key, especially when navigating patterns prone to fake-outs. For now, remaining on the sidelines until a confirmed breakout occurs may be the most prudent strategy.
--------------------------
Disclosure: I am part of Trade Nation's Influencer program and receive a monthly fee for using their TradingView charts in my analysis.
Thanks for your support. If you enjoyed this analysis, make sure to follow me so you don't miss the next one. And if you found it helpful, feel free to drop a like and leave a comment, I’d love to hear your thoughts!
EURUSD: Strong Growth Ahead! Long!
My dear friends,
Today we will analyse EURUSD together☺️
The market is at an inflection zone and price has now reached an area around 1.17463 where previous reversals or breakouts have occurred.And a price reaction that we are seeing on multiple timeframes here could signal the next move up so we can enter on confirmation, and target the next key level of 1.17589.Stop-loss is recommended beyond the inflection zone.
❤️Sending you lots of Love and Hugs❤️
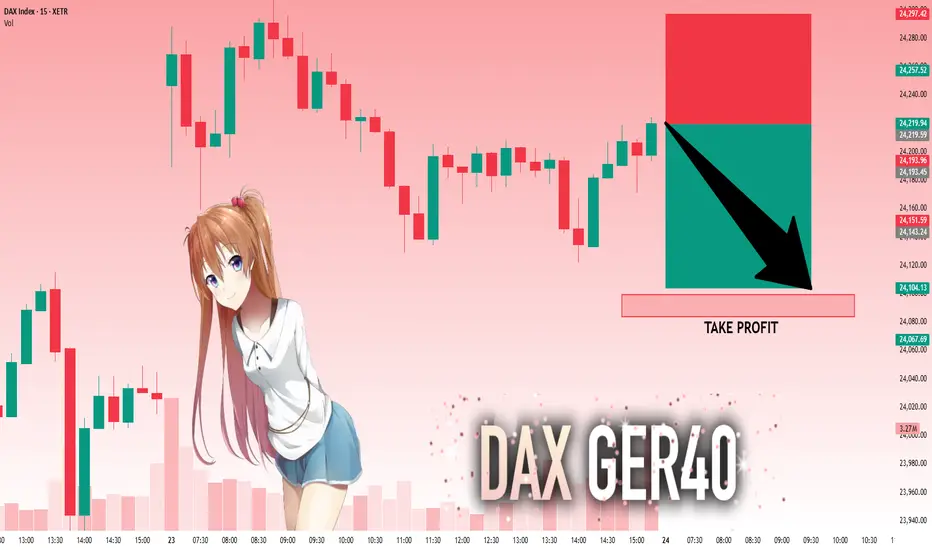
DAX: Target Is Down! Short!
My dear friends,
Today we will analyse DAX together☺️
The recent price action suggests a shift in mid-term momentum. A break below the current local range around 24,219.59 will confirm the new direction downwards with the target being the next key level of 24,099.27.and a reconvened placement of a stop-loss beyond the range.
❤️Sending you lots of Love and Hugs❤️
GOLD: Move Up Expected! Long!
My dear friends,
Today we will analyse GOLD together☺️
The in-trend continuation seems likely as the current long-term trend appears to be strong, and price is holding above a key level of 3,393.33 So a bullish continuation seems plausible, targeting the next high. We should enter on confirmation, and place a stop-loss beyond the recent swing level.
❤️Sending you lots of Love and Hugs❤️
EURUSD: Strong Growth Ahead! Long!
My dear friends,
Today we will analyse GOLD together☺️
The market is at an inflection zone and price has now reached an area around 1.17463 where previous reversals or breakouts have occurred.And a price reaction that we are seeing on multiple timeframes here could signal the next move up so we can enter on confirmation, and target the next key level of 1.17589.Stop-loss is recommended beyond the inflection zone.
❤️Sending you lots of Love and Hugs❤️
SILVER: Will Go Down! Short!
My dear friends,
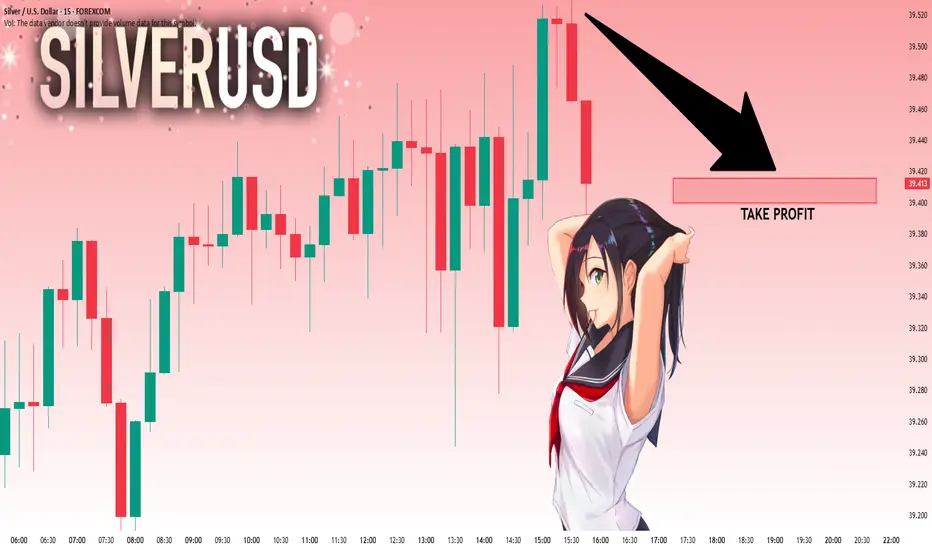
Today we will analyse SILVER together☺️
The price is near a wide key level
and the pair is approaching a significant decision level of 39.520 Therefore, a strong bearish reaction here could determine the next move down.We will watch for a confirmation candle, and then target the next key level of 39.416..Recommend Stop-loss is beyond the current level.
❤️Sending you lots of Love and Hugs❤️
SILVER Bullish Breakout! Buy!
Hello,Traders!
SILVER is trading in a strong
Uptrend and the price made a
Bullish breakout of the key
Horizontal level of 39.10$
So we are bullish biased
And we will be expecting a
Further bullish move up
Buy!
Comment and subscribe to help us grow!
Check out other forecasts below too!
Disclosure: I am part of Trade Nation's Influencer program and receive a monthly fee for using their TradingView charts in my analysis.
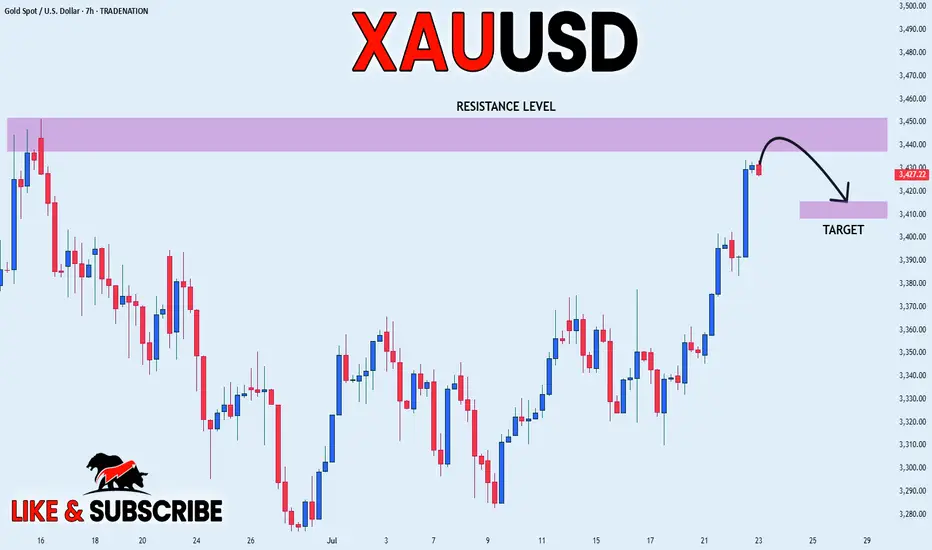
GOLD SHORT FROM RESISTANCE|
✅GOLD is set to retest a
Strong resistance level above at 3450$
After trading in an uptrend for some time
Which makes a bearish pullback a likely scenario
With the target being a local support below at 3414$
SHORT🔥
✅Like and subscribe to never miss a new idea!✅
Disclosure: I am part of Trade Nation's Influencer program and receive a monthly fee for using their TradingView charts in my analysis.
AUD-JPY Will Grow! Buy!
Hello,Traders!
AUD-JPY already made a
Bullish rebound from the
Strong horizontal support
Of 95.610 and as we are
Bullish biased we will be
Expecting a further bullish
Move up
Buy!
Comment and subscribe to help us grow!
Check out other forecasts below too!
Disclosure: I am part of Trade Nation's Influencer program and receive a monthly fee for using their TradingView charts in my analysis.