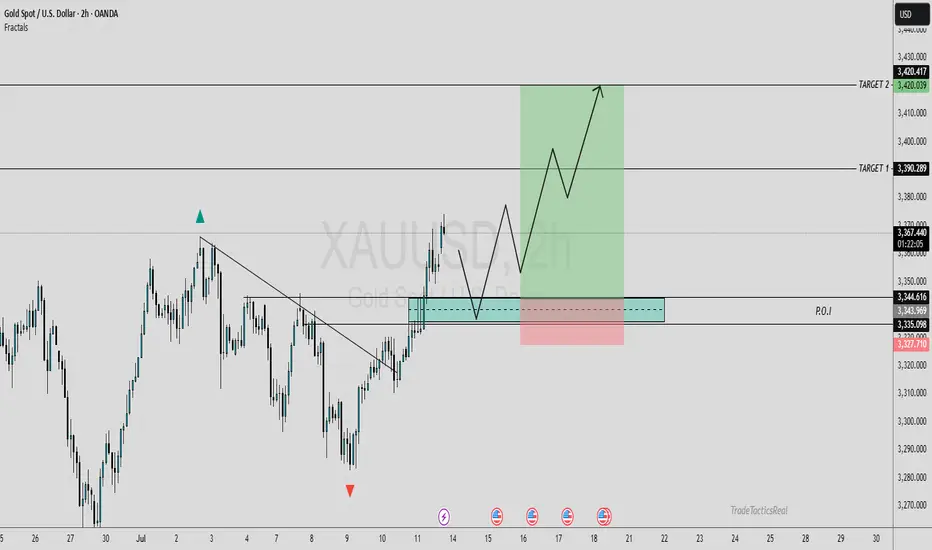
XAUUSD ANALYSISOn gold currently we're analyzing 2H time frame. As we know that current trend was bullish. At this stage, I'm anticipating a retracement towards my Point of Interest (POI), where I’ll be looking for a clear bullish confirmation, ideally through candlestick structure or solid price action. Only upon receiving that confirmation will I consider entering a buy position.
This outlook is based on the higher time frame structure. For now, I'm observing patiently to see how price unfolds. Until the market sweeps the SSL liquidity, I will remain on the sidelines no entries until that key liquidity level has been taken. Confirmation is key.
Always use stoploss for your trade.
Always use proper money management and proper risk to reward ratio.
#XAUUSD 2H Technical Analysis Expected Move.
Ict
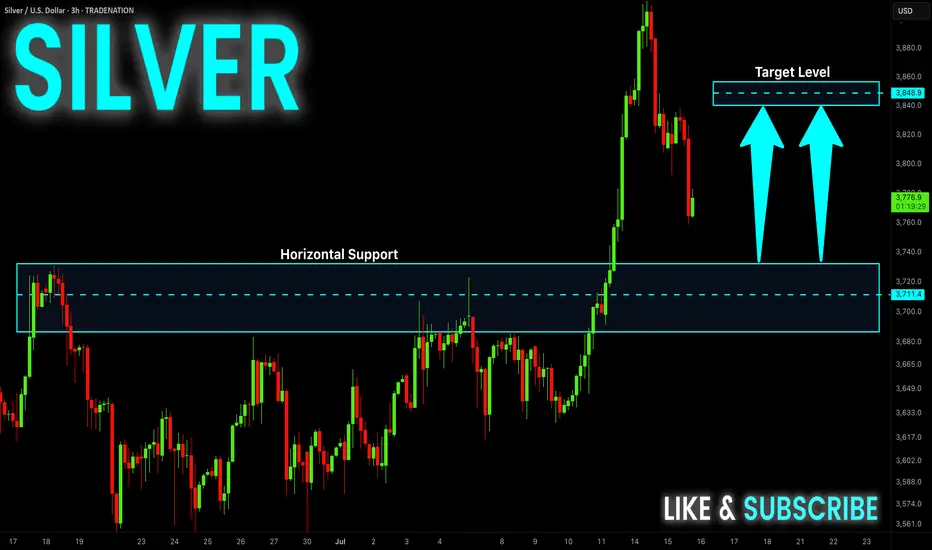
SILVER Support Ahead! Buy!
Hello,Traders!
SILVER is going down now
But the price is trading in a
Long-term uptrend so we are
Bullish biased and after the
Price retests of the horizontal
Support support below
Around 37.20$ we will be
Expecting a bullish rebound
Buy!
Comment and subscribe to help us grow!
Check out other forecasts below too!
Disclosure: I am part of Trade Nation's Influencer program and receive a monthly fee for using their TradingView charts in my analysis.
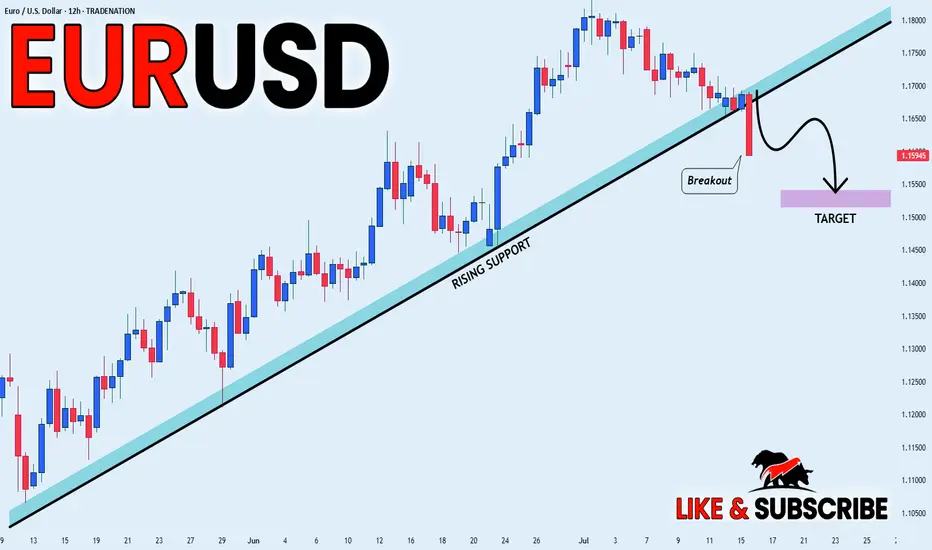
EUR_USD BEARISH BREAKOUT|SHORT|
✅EUR_USD was trading along
The rising support line but
Now we are seeing a strong bearish
Breakout and the breakout is
Confirmed so we are bearish
Biased and we will be expecting
A further bearish move down
After the potential pullback
SHORT🔥
✅Like and subscribe to never miss a new idea!✅
Disclosure: I am part of Trade Nation's Influencer program and receive a monthly fee for using their TradingView charts in my analysis.
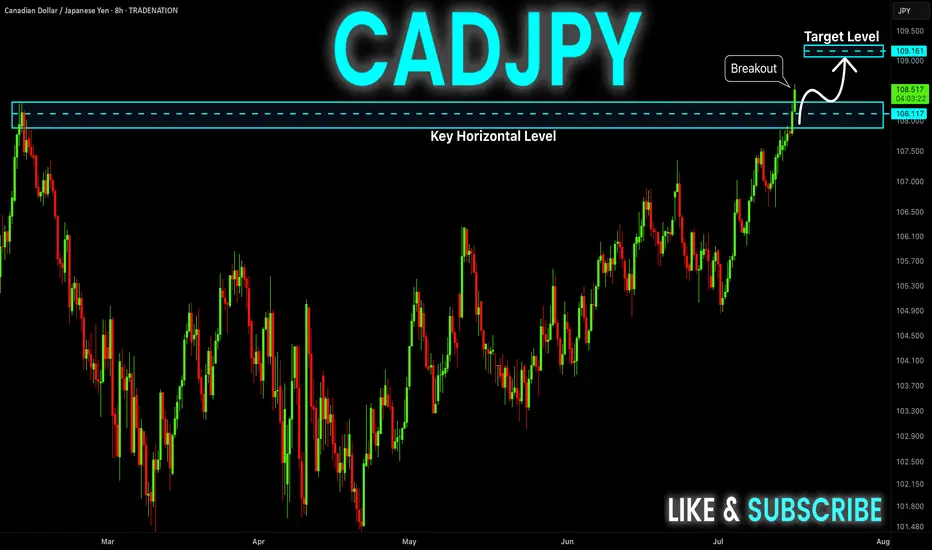
CAD-JPY Strong Bullish Breakout! Buy!
Hello,Traders!
CAD-JPY keeps trading in a
Strong uptrend and the pair
Made a strong bullish breakout
Of the key horizontal level
Of 108.299 so we are bullish
Biased and we will be expecting
A further bullish move up
Buy!
Comment and subscribe to help us grow!
Check out other forecasts below too!
Disclosure: I am part of Trade Nation's Influencer program and receive a monthly fee for using their TradingView charts in my analysis.
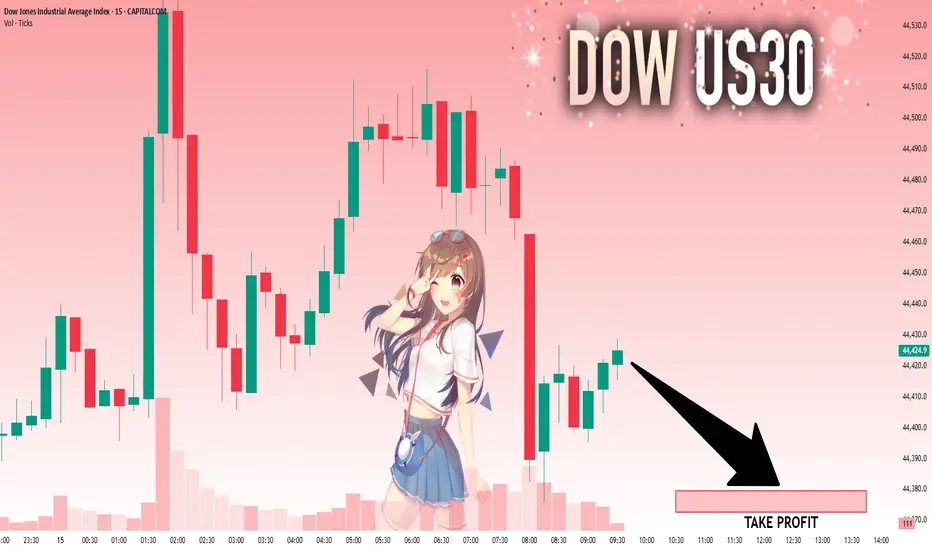
US30: Bears Are Winning! Short!
My dear friends,
Today we will analyse US30 together☺️
The price is near a wide key level
and the pair is approaching a significant decision level of 44,420.7 Therefore, a strong bearish reaction here could determine the next move down.We will watch for a confirmation candle, and then target the next key level of 44,379.6..Recommend Stop-loss is beyond the current level.
❤️Sending you lots of Love and Hugs❤️
SILVER: Next Move Is Down! Short!
My dear friends,
Today we will analyse SILVER together☺️
The recent price action suggests a shift in mid-term momentum. A break above the current local range around 38.253 will confirm the new direction upwards with the target being the next key level of 38.151 and a reconvened placement of a stop-loss beyond the range.
❤️Sending you lots of Love and Hugs❤️

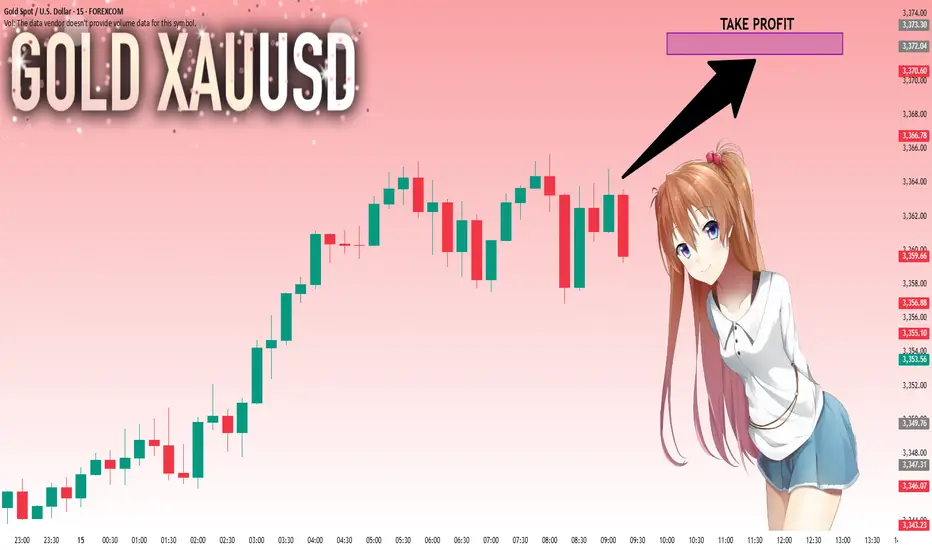
GOLD: Target Is Up! Long!
My dear friends,
Today we will analyse GOLD together☺️
The in-trend continuation seems likely as the current long-term trend appears to be strong, and price is holding above a key level of 3,363.43 So a bullish continuation seems plausible, targeting the next high. We should enter on confirmation, and place a stop-loss beyond the recent swing level.
❤️Sending you lots of Love and Hugs❤️
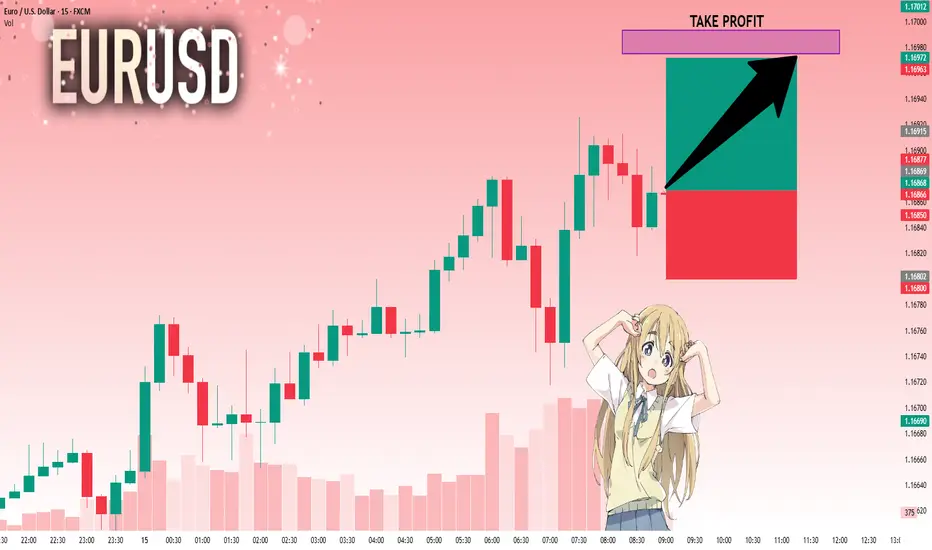
EURUSD: Move Up Expected! Long!
My dear friends,
Today we will analyse EURUSD together☺️
The market is at an inflection zone and price has now reached an area around 1.16869 where previous reversals or breakouts have occurred.And a price reaction that we are seeing on multiple timeframes here could signal the next move up so we can enter on confirmation, and target the next key level of 1.16975.Stop-loss is recommended beyond the inflection zone.
❤️Sending you lots of Love and Hugs❤️
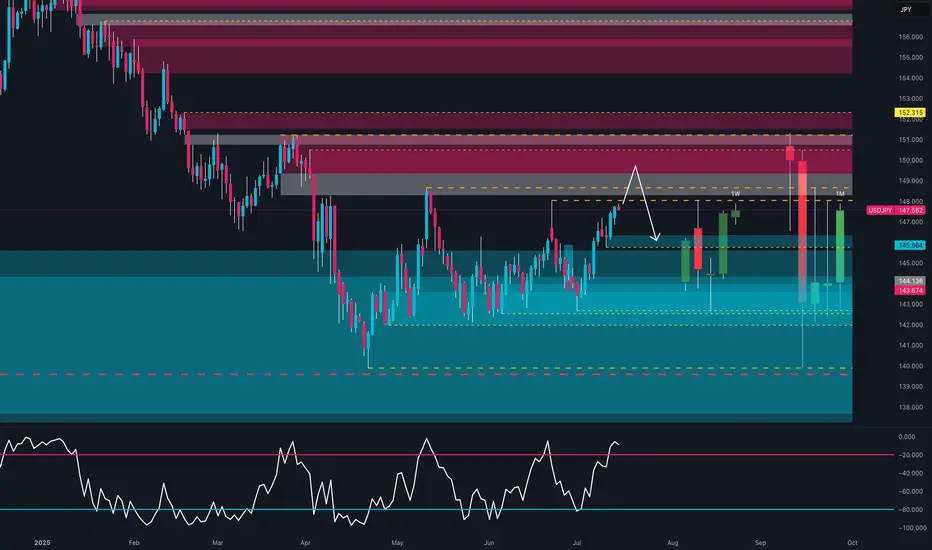
USDJPY – Tactical Short in Weekly Supply or Bullish Breakout?COT & MACRO FLOW (Commitment of Traders)
USD INDEX
Non-commercials still biased short: Longs 16,208 vs Shorts 20,194 (slightly improved, but still negative).
Commercials remain net long, but the open interest is declining → no strong conviction from smart money.
JPY
Non-commercials added significantly to their short exposure (+6,751), while cutting longs (-4,432).
Commercials also cut long exposure heavily (-20,405).
The structure shows institutional bias is clearly bearish on JPY.
Conclusion: JPY weakness confirmed by both commercial and non-commercial flows. USD slightly weaker, but JPY is weaker → supports USDJPY bullish bias.
SEASONALITY (JULY)
USD/JPY tends to be weak in July across most historical averages (5y, 10y, 15y, 20y).
July is historically bearish for USDJPY, especially in the second half of the month.
This seasonality contrasts with COT flows → mixed bias.
RETAIL SENTIMENT
60% of retail traders are SHORT → supports contrarian long view.
Retail volume shows imbalance in positioning, another contrarian bullish signal.
📈 TECHNICAL ANALYSIS (DAILY CHART)
Price is testing a key weekly FVG zone between 148.4 and 149.2.
RSI has re-entered the overbought region, suggesting potential exhaustion.
Price bounced from the monthly bullish order block (143.5–144.0).
A clear move above 149.50 could invalidate short setups.
🧩 TRADE IDEA (SETUP)
Watch for price to retest 148.4–149.50 zone and react.
RSI divergence + seasonality could offer a short opportunity with confirmation (e.g. engulfing on Daily/H4).
If price breaks above 149.5 with volume → look for continuation to 152.00.
✅ FINAL BIAS
Macro and institutional flows remain in favor of USDJPY longs, but:
Seasonality turns bearish in the second half of July
Price is reaching strong resistance
Retail sentiment supports the long thesis
→ Tactical Short from 149-150 only with confirmation. Otherwise, long continuation above 150.
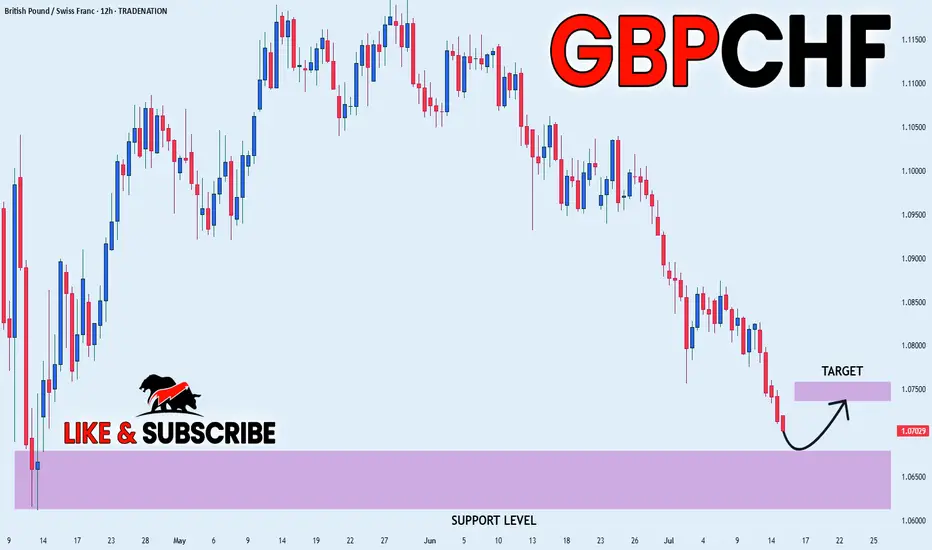
GBP_CHF SWING LONG|
✅GBP_CHF is set to retest a
Strong support level below at 1.0650
After trading in a strong downtrend for some time
Which makes a bullish rebound a likely scenario
With the target being a local resistance above at 1.0750
LONG🚀
✅Like and subscribe to never miss a new idea!✅
Disclosure: I am part of Trade Nation's Influencer program and receive a monthly fee for using their TradingView charts in my analysis.
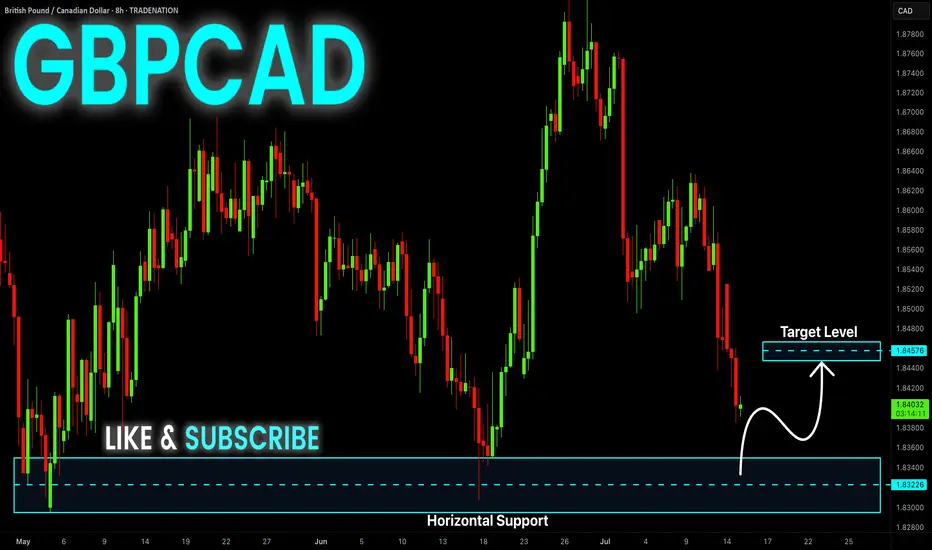
GBP-CAD Support Ahead! Buy!
Hello,Traders!
GBP-CAD keeps falling down
But a strong horizontal support
Level of 1.8322 is ahead so after
The retest we will be expecting
A local bullish rebound
Buy!
Comment and subscribe to help us grow!
Check out other forecasts below too!
Disclosure: I am part of Trade Nation's Influencer program and receive a monthly fee for using their TradingView charts in my analysis.
GOLD: Local Bearish Bias! Short!
My dear friends,
Today we will analyse GOLD together☺️
The price is near a wide key level
and the pair is approaching a significant decision level of 3,349.76 Therefore, a strong bearish reaction here could determine the next move down.We will watch for a confirmation candle, and then target the next key level of 3,341.88..Recommend Stop-loss is beyond the current level.
❤️Sending you lots of Love and Hugs❤️

EURUSD: Will Go Down! Short!
My dear friends,
Today we will analyse EURUSD together☺️
The recent price action suggests a shift in mid-term momentum. A break below the current local range around 1.16802 will confirm the new direction downwards with the target being the next key level of 1.16684.and a reconvened placement of a stop-loss beyond the range.
❤️Sending you lots of Love and Hugs❤️

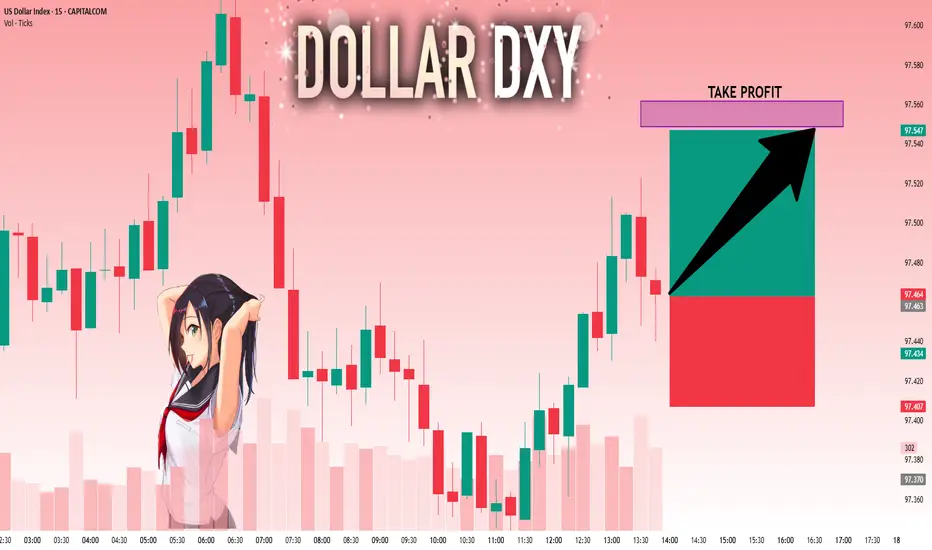
DXY: The Market Is Looking Up! Long!
My dear friends,
Today we will analyse DXY together☺️
The in-trend continuation seems likely as the current long-term trend appears to be strong, and price is holding above a key level of 97.463 So a bullish continuation seems plausible, targeting the next high. We should enter on confirmation, and place a stop-loss beyond the recent swing level.
❤️Sending you lots of Love and Hugs❤️
SILVER: Strong Bullish Sentiment! Long!
My dear friends,
Today we will analyse SILVER together☺️
The market is at an inflection zone and price has now reached an area around 38.768 where previous reversals or breakouts have occurred.And a price reaction that we are seeing on multiple timeframes here could signal the next move up so we can enter on confirmation, and target the next key level of 38.937.Stop-loss is recommended beyond the inflection zone.
❤️Sending you lots of Love and Hugs❤️

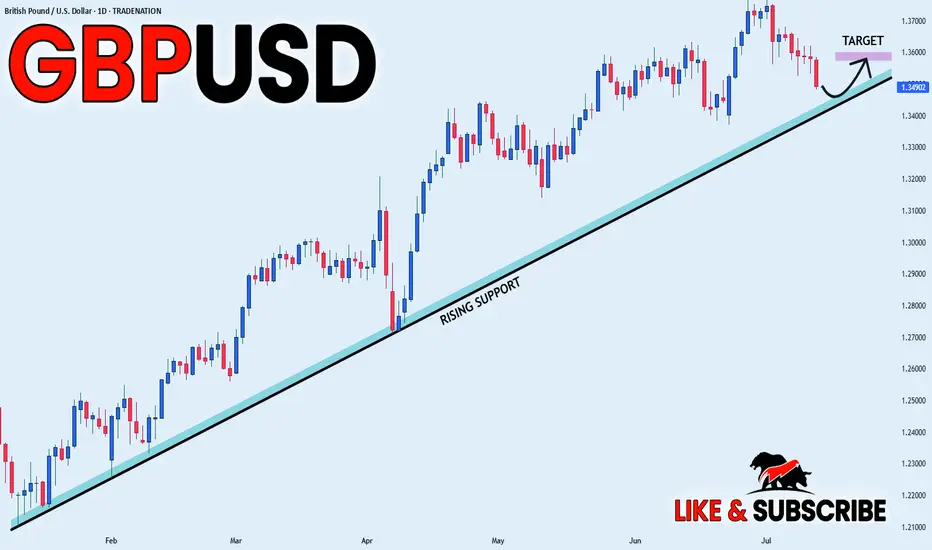
GBP_USD RISING SUPPORT AHEAD|LONG|
✅GBP_USD is going down now
But a strong rising support level is ahead
Thus I am expecting a rebound
And a move up towards the target of 1.3600
LONG🚀
✅Like and subscribe to never miss a new idea!✅
Disclosure: I am part of Trade Nation's Influencer program and receive a monthly fee for using their TradingView charts in my analysis.
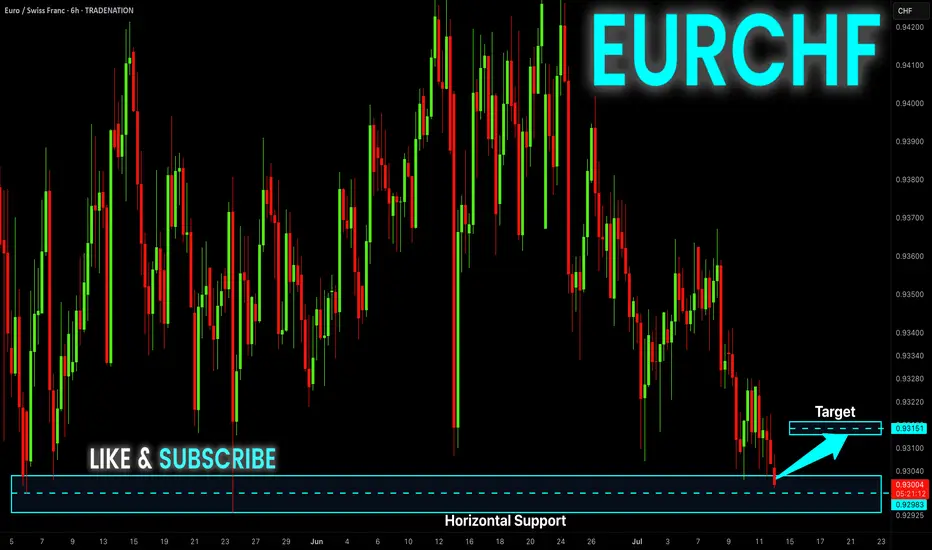
EUR-CHF Local Long! Buy!
Hello,Traders!
EUR-CHF is about to retest
The strong horizontal support
Of 0.9298 and as the pair
Is locally oversold we will be
Expecting a local bullish
Rebound and a move up
Buy!
Comment and subscribe to help us grow!
Check out other forecasts below too!
Disclosure: I am part of Trade Nation's Influencer program and receive a monthly fee for using their TradingView charts in my analysis.
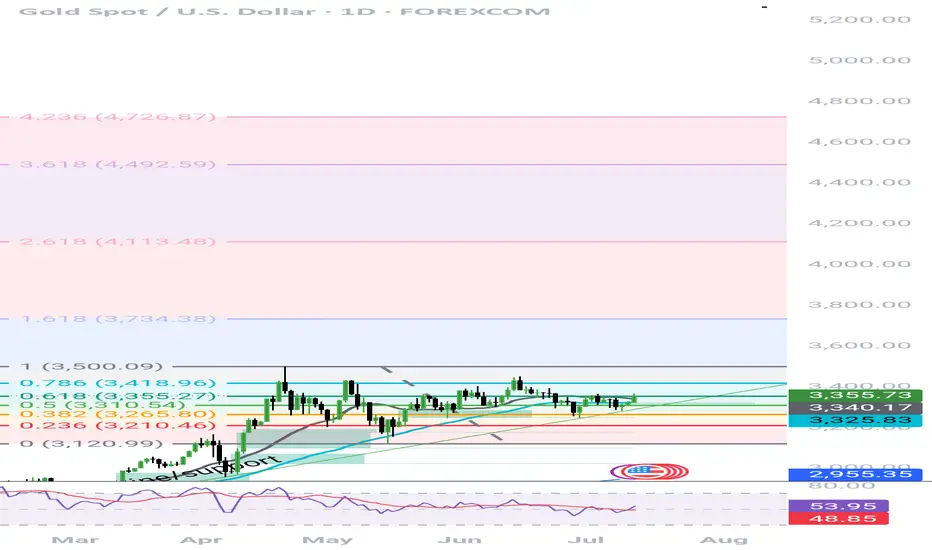
Gold TP'sGold consolidation range has been marked out from wick to wick, tapped into the liquidity area at 3120 area...only up from here...tp's are shown in the photo with 1.618, and the other tp levels above it. I love Fibonacci retracement, learn fair value gaps, learn about liquidity areas, and and learn about candle range theory, you're welcome
ETHUSD: Bulls Are Winning! Long!
My dear friends,
Today we will analyse ETHUSD together☺️
The price is near a wide key level
and the pair is approaching a significant decision level of 2,980.5 Therefore, a strong bullish reaction here could determine the next move up.We will watch for a confirmation candle, and then target the next key level of 3,001.1.Recommend Stop-loss is beyond the current level.
❤️Sending you lots of Love and Hugs❤️

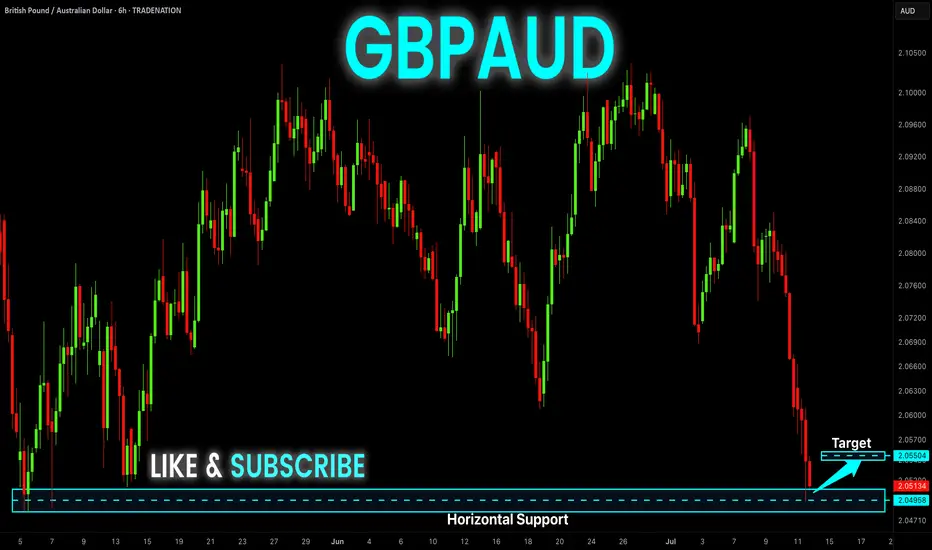
GBP-AUD Risky Long! Buy!
Hello,Traders!
GBP-AUD keeps falling and
The pair is locally oversold
So as the pair is retesting
The horizontal support
Of 2.0480 we will be expecting
A local bullish correction
On Monday
Buy!
Comment and subscribe to help us grow!
Check out other forecasts below too!
Disclosure: I am part of Trade Nation's Influencer program and receive a monthly fee for using their TradingView charts in my analysis.
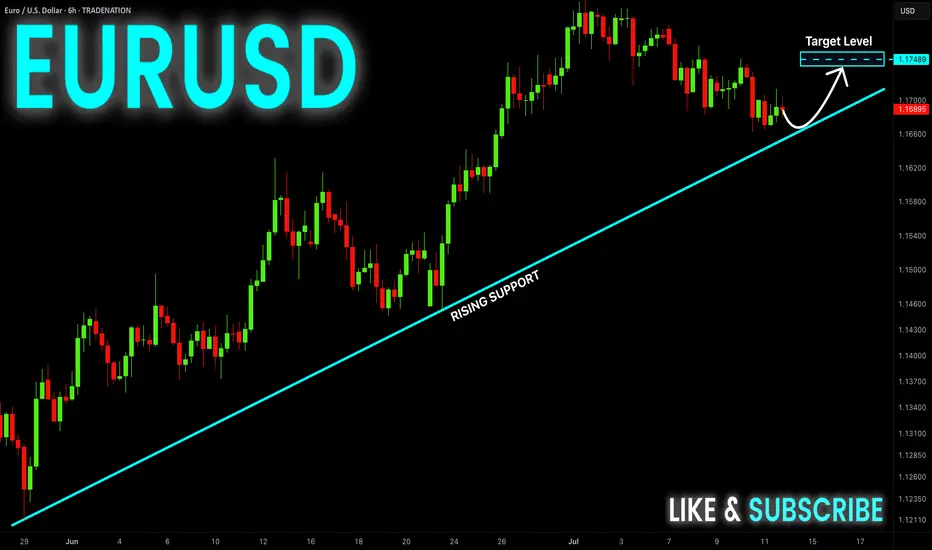
EUR-USD Will Keep Growing! Buy!
Hello,Traders!
EUR-USD keep trading in
An uptrend along the rising support
So as the pair is approaching
A the support we will be
Expecting a bullish rebound
And a move up on Monday
Buy!
Comment and subscribe to help us grow!
Check out other forecasts below too!
Disclosure: I am part of Trade Nation's Influencer program and receive a monthly fee for using their TradingView charts in my analysis.
BTCUSD: Next Move Is Down! Short!
My dear friends,
Today we will analyse BTCUSD together☺️
The recent price action suggests a shift in mid-term momentum. A break below the current local range around 118.878 will confirm the new direction downwards with the target being the next key level of 118.470.and a reconvened placement of a stop-loss beyond the range.
❤️Sending you lots of Love and Hugs❤️

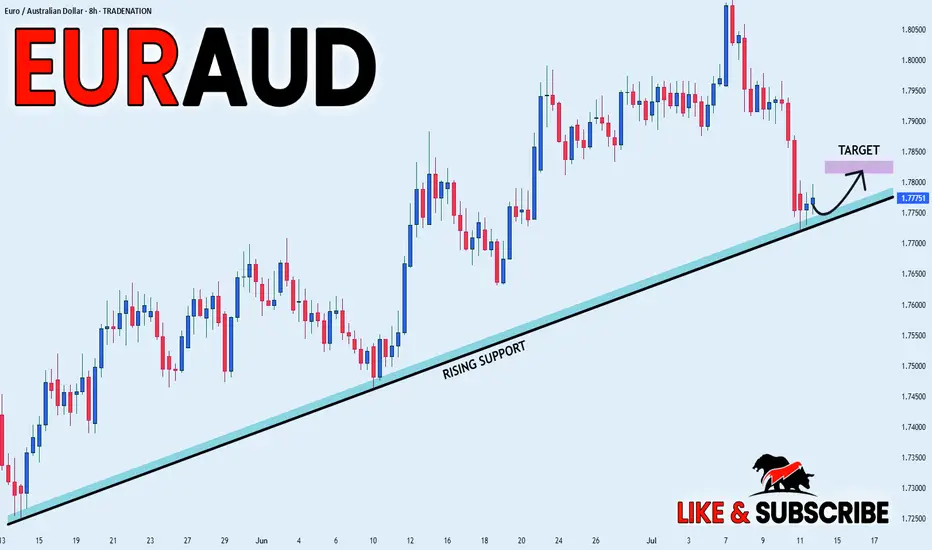
EUR_AUD WILL GO UP|LONG|
✅EUR_AUD is trading in an uptrend
And the bullish bias is confirmed
By the rebound we are seeing
After the pair retested the support
So I think the growth will continue
LONG🚀
✅Like and subscribe to never miss a new idea!✅
Disclosure: I am part of Trade Nation's Influencer program and receive a monthly fee for using their TradingView charts in my analysis.