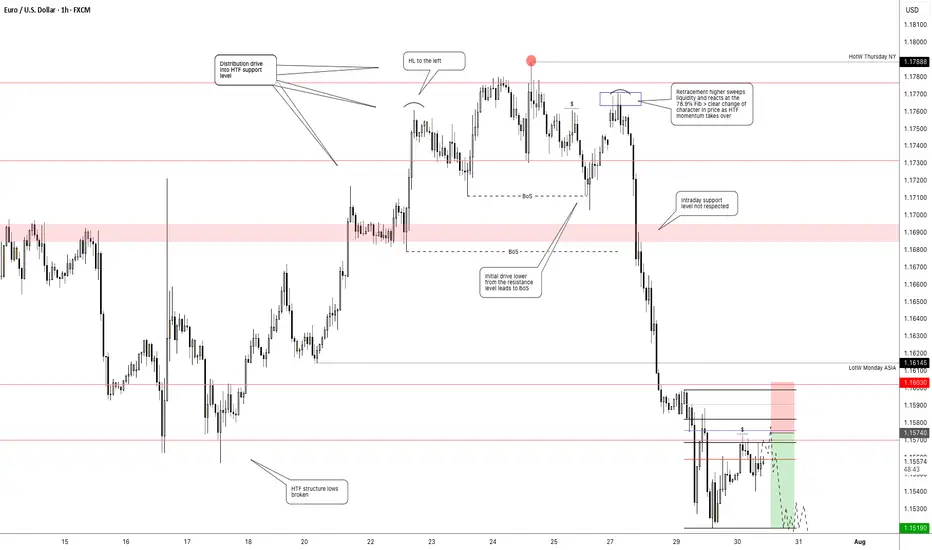
Getting short on EUR/USD!The dollar has looked set for a reversal and coming into the week it didn't hang around at all. I had a bit of a short bias on EUR/USD and was looking for confirmation signal which pretty much came at market open.
Price pushed higher back into the key level taking out a short term high, but was unable to follow through to form a new higher high. Heading into Monday London session, momentum immediately took hold with a clear bearish change of character and price didn't look back > breaking structure and key levels with minimal effort.
I was waiting for a pull back to get short early which didn't occur. But no need to chase price, waiting and patience is part of the game.
Price has now broken another key support level and is set to retest it as resistance. This will be my entry point (see screenshot) > using the 70.5%-78.6% fib retracement level and my stop above Tuesdays high. Keep it simple.
tradingview.sweetlogin.com/proxy-s3
Ictconcepts
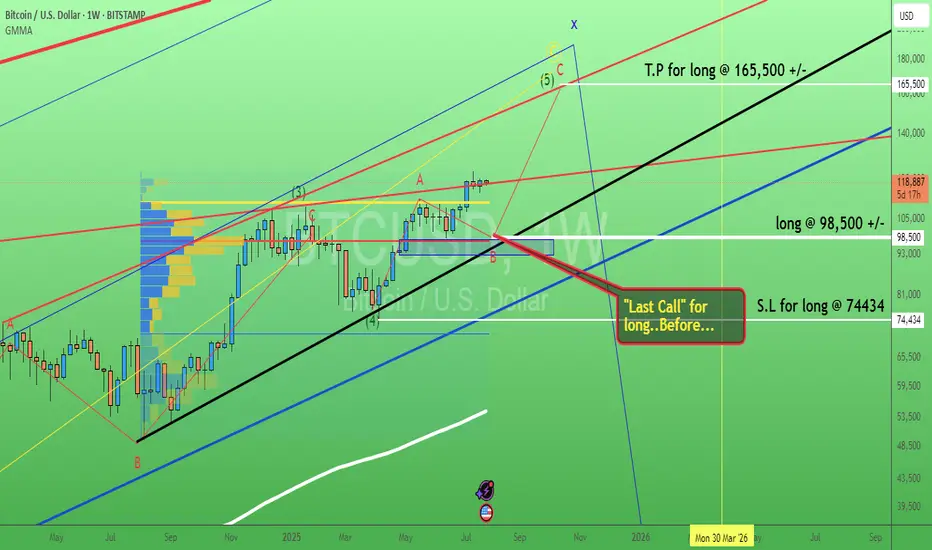
Bitcoin. Last call buy level? 29/July/25BTCUSD probably will have pullback toward confluence zone of 1) Trendline Support 2) Order Block 3) POC of volume before hitting ATH again
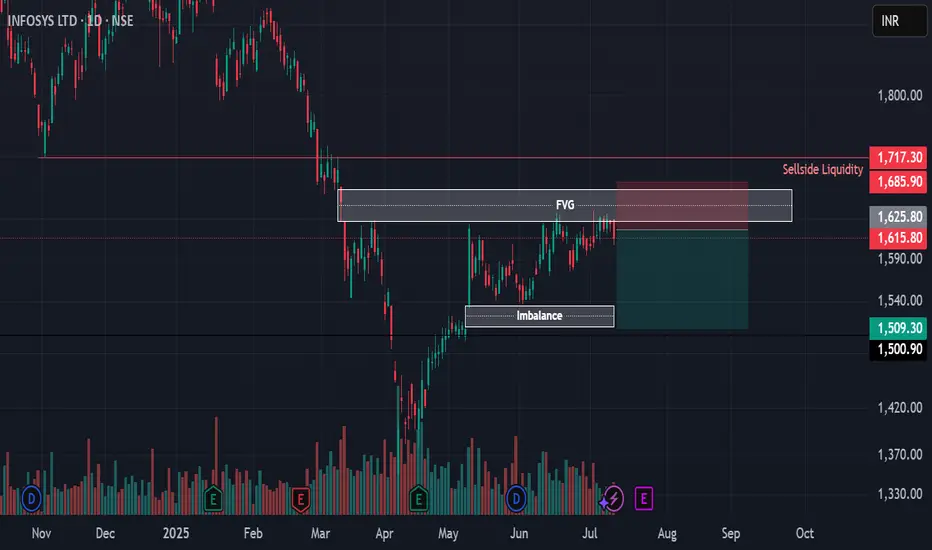
US05Y Bullish ideaWe can see we had rejection after taking out our sell side liquidity and balancing our daily fair value gap. We are still showing strength in the bond market as well with the dollar index. Our DOL is to the upside in the form of buyside liquidity and our daily volume imbalance at 4.073%.
* Fundamentals: We are having a rise in inflation and a stronger interest rate of the dollar against most of the major basket currency pairs, which in the longer term should potentially see us get a stronger dollar and an increase in our bond yields.

July 29, Forex Outlook : High-Reward Setups You Shouldn’t Miss!Welcome back, traders!
In today’s video, we’ll be conducting a Forex Weekly Outlook, analyzing multiple currency pairs from a top-down perspective—starting from the higher timeframes and working our way down to the lower timeframes.
Pairs to focus on this Week:
USDJPY
AUDJPY
CADJPY
EURGBP
GBPCHF
USDCHF
NZDCHF
EURNZD
Our focus will be on identifying high-probability price action scenarios using clear market structure, institutional order flow, and key confirmation levels. This detailed breakdown is designed to give you a strategic edge and help you navigate this week’s trading opportunities with confidence.
📊 What to Expect in This Video:
1. Higher timeframe trend analysis
2. Key zones of interest and potential setups
3. High-precision confirmations on lower timeframes
4. Institutional insight into where price is likely to go next
Stay tuned, take notes, and be sure to like, comment, and subscribe so you don’t miss future trading insights!
Have a great week ahead, God bless you!
The Architect 🏛️📉

#USDJPY: Swing Buy Almost +2000 Pips! Dear Traders,
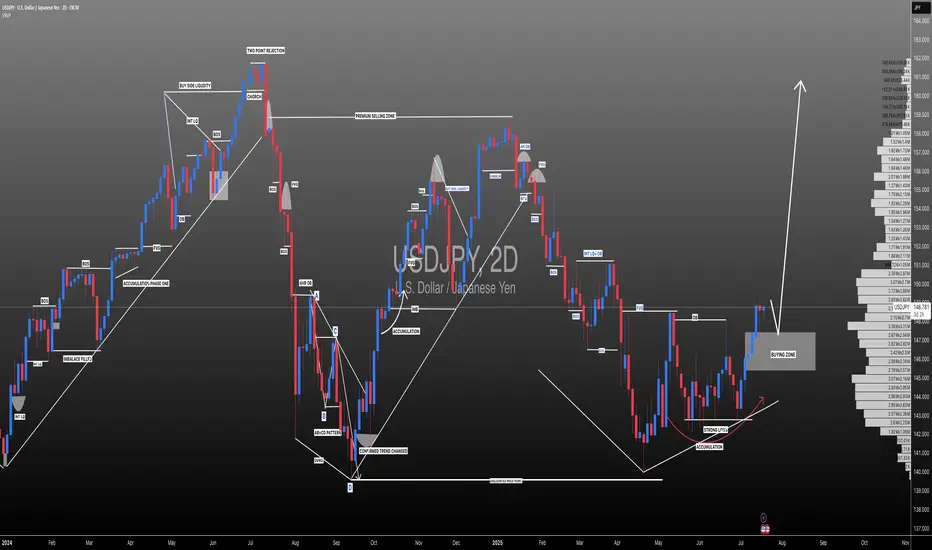
The USDJPY currency pair appears to be in an accumulation phase at the moment, as evidenced by the lack of significant price movement throughout the current week. Several factors contribute to this trend.
Firstly, several significant economic events are scheduled for this week, particularly tomorrow and Friday. These developments will have substantial implications for the future trajectory of the USDJPY pair. Consequently, there’s a possibility that the price may experience a decline before initiating a bullish trend. We’ve recently seen a strong bullish candle, which suggests a strong bullish move in the coming weeks. Additionally, the strong USD could continue rising, while the JPY is dropping.
Secondly, there are two primary areas where the price could reverse its course. The extent to which the USD reacts to the economic data will indicate potential reversal zones.
It’s crucial to conduct your own analysis before making any financial decisions. This chart should be used solely for educational purposes and does not guarantee any specific outcome.
Regarding the stop loss, as this is a swing trade, it’s advisable to employ a larger stop loss if the price reaches entry zones. The take profit level can be determined based on your entry type and analysis.
We wish you the best of luck in your trading endeavours and emphasise the importance of trading safely.
Please share this analysis with others through likes, comments, and social media platforms. If you have any questions or require further assistance, don’t hesitate to comment below. We’re here to provide support.
Team Setupsfx_
❤️🚀
Weekly Trade Outlook | Lessons in Discipline, Risk & PerspectiveGreetings Traders,
In today’s video, I’ll be walking you through my end-of-week trade outlook, breaking down every setup I took throughout the week. This session is designed to offer insight into how I apply risk management, trading rules, and maintain psychological discipline in real-time market conditions.
Whether you're struggling with emotional trading, inconsistency, or overtrading, this video will give you a fresh perspective on how structure, faith, and discipline can shape a sustainable trading approach.
Remember: respect your trading rules, pray over them daily, and ask God for the strength to remain disciplined—so you don’t become your own worst enemy in the market.
Let’s grow together,
The Architect 🏛️📈

Simple EURGBP Analysis (MMC) – Bullish Continuation or Reversal?🕵️♂️ Chart Overview – 30-Min Timeframe (OANDA)
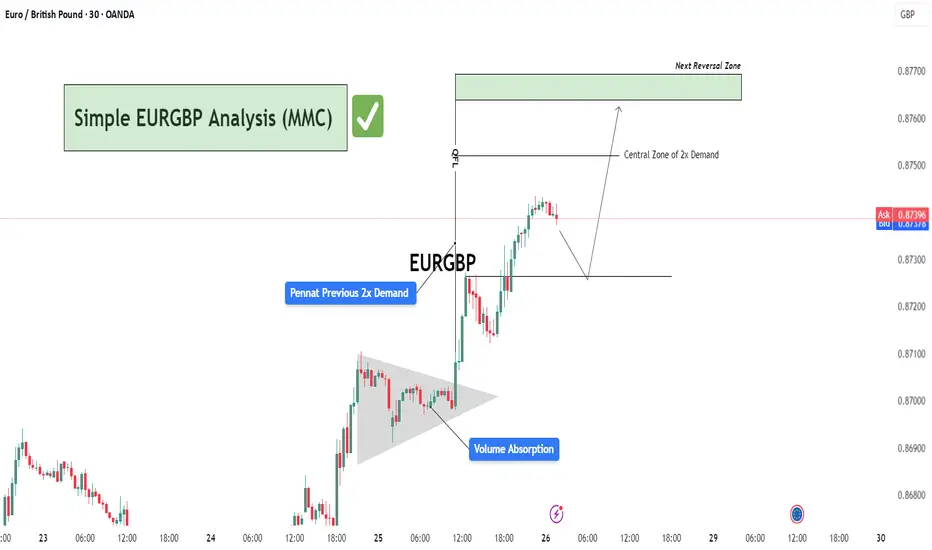
This EURGBP chart illustrates a classic bullish continuation structure following a volume absorption phase and pennant formation, leading into a vertical price expansion toward a potential reversal zone. The technical flow demonstrates smart money accumulation and re-accumulation before a sharp bullish leg.
🔷 Phase 1: Bullish Accumulation via Pennant Formation
The chart begins with a tight consolidation structure marked as a pennant, typically a continuation pattern.
This area coincides with “Previous 2x Demand”, hinting at a strong institutional buying interest.
The Volume Absorption label suggests that sell-side liquidity was efficiently absorbed—often a precursor to bullish breakouts.
📈 Phase 2: Breakout & Price Expansion
Price breaks out of the pennant aggressively, validating the absorption theory.
The post-breakout rally continues with minimal retracement, showcasing impulsive bullish momentum.
The QFL (Quasimodo Failure Level) is also marked—this serves as a structural footprint left by trapped sellers.
🟩 Next Levels to Watch: Reversal or Re-Entry Zones
As the price approaches the green "Next Reversal Zone" (0.87650–0.87700), watch for potential exhaustion or a reaction.
The Central Zone of 2x Demand (just below 0.87500) could act as a re-entry level for continuation long setups.
Anticipated short-term correction before continuation, as depicted by the projected path.
🧠 Strategic Insight & Trade Planning
Aggressive Bulls: May target breakout pullbacks near the Central Zone of Demand for intraday continuation.
Conservative Traders: Should wait for a clean reaction from the green Reversal Zone. If rejection is confirmed, short opportunities with tight stops become favorable.
Watch the price behavior around 0.87300–0.87500—this will likely dictate whether continuation or correction prevails.
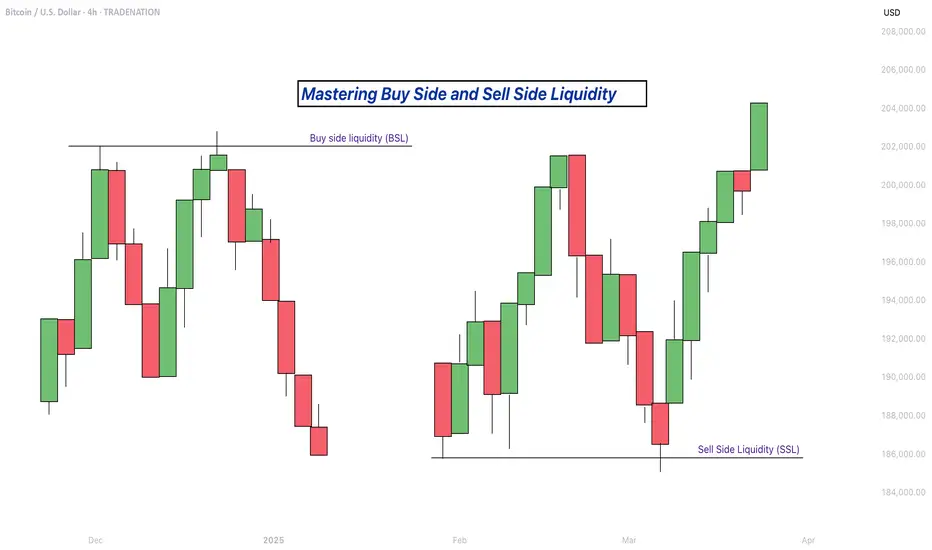
Mastering Buy Side and Sell Side Liquidity - How to trade it!In trading, understanding liquidity is one of the keys to predicting where the market might go next. The Inner Circle Trader (ICT) method teaches traders how to recognize where big players like banks and institutions are likely to enter or exit trades. Two important ideas in ICT trading are buy side liquidity and sell side liquidity. Once you understand what these terms mean and how to spot them on a chart, you can start using them to find better trading opportunities.
What will be discussed?
- What is Buy Side Liquidity?
- What is Sell Side Liquidity?
- How do you see Buy and Sell Side Liquidity?
- Examples
- How to trade BSL and SLL Liquidity?
What is Buy Side Liquidity
Buy side liquidity is found above market highs. It refers to all the stop loss orders from people who are holding short positions. When the market is going down, some traders sell (or go short) and place their stop losses above recent highs to protect themselves. These stop losses are actually buy orders because closing a short position requires buying. Big institutions know this, so they push price upward to trigger those stop losses and grab that liquidity. That’s why you’ll often see the market spike above a recent high before reversing. That spike is the market grabbing buy side liquidity.
What is Sell Side Liquidity
Sell side liquidity is the opposite. It’s found below recent lows. This is where traders who are buying (going long) place their stop losses. If someone buys a market, they’ll usually put a stop loss just below a previous low. That stop loss is a sell order. Smart money looks at these areas as pools of sell side liquidity. So when the market moves down quickly and breaks a recent low, it’s likely collecting those sell stop orders. After that, you’ll often see a reversal because the liquidity has been taken.
How do you see Buy and Sell Side Liquidity?
You can spot buy side and sell side liquidity by looking at the chart and identifying recent highs and lows where many traders might have placed stop losses. These are usually obvious swing highs and swing lows. If you look at a chart and see a clean high where price previously reversed, that’s likely where traders are placing stops. That makes it a target for buy side liquidity. Same for a recent low, if it’s a clean level where people might have bought in the past, that low probably holds sell side liquidity. The more obvious the level looks, the more likely it’s full of stops and therefore a liquidity target.
Examples
How to trade BSL and SLL Liquidity?
Trading liquidity means watching for the market to run above a recent high (to take buy side liquidity) or below a recent low (to take sell side liquidity), and then looking for signs of reversal. Once liquidity has been taken, the market often changes direction.
When you’re trading the ICT concept of liquidity, the key is not just spotting where liquidity lies, but also knowing when price is likely to reverse after that liquidity has been taken. Reversals don’t happen randomly, they leave clues on the chart. Here’s how you can recognize those signs in a simple way:
1. Market Structure Break
This is one of the clearest signs of a reversal. Let’s say the market grabs sell side liquidity by breaking below a recent low. If price then quickly starts moving up and breaks above the last lower high, that’s a break in structure. It shows that sellers are losing control and buyers are stepping in. It’s the first confirmation that the direction might be changing.
2. Rejection Wicks or Strong Candles
After price runs into liquidity (above a high or below a low), watch the candlesticks closely. If you see a long wick rejecting the level, or a strong candle in the opposite direction right after the liquidity grab, that’s a clue. It means price went there, collected the orders, and got rejected fast. That rejection shows the market might be reversing.
3. Fair Value Gaps (FVGs)
Fair value gaps are small “windows” left in price when it moves quickly in one direction. After liquidity is taken and price starts reversing, it often leaves an FVG behind. If price pulls back into that gap and holds, that can be a great entry point. FVGs act like magnets and support zones in ICT.
4. Displacement
Displacement is a strong, impulsive move that breaks structure. It usually happens right after liquidity is taken. If price moves very fast in the opposite direction after hitting a liquidity level, that’s a good sign smart money is behind the move and it’s not just random noise. That strong push is a hint that a new trend might be forming.
5. Change in Character (CHOCH)
This is a shift in how the market behaves. For example, price might be making lower highs and lower lows (a bearish trend), but after liquidity is taken, it suddenly starts making higher highs and higher lows. That change in character tells you the trend might be reversing.
-------------------------
Disclosure: I am part of Trade Nation's Influencer program and receive a monthly fee for using their TradingView charts in my analysis.
Thanks for your support. If you enjoyed this analysis, make sure to follow me so you don't miss the next one. And if you found it helpful, feel free to drop a like 👍 and leave a comment 💬, I’d love to hear your thoughts!
AUDJPY: Bullish Structure Shift Signals Institutional Buy ZoneGreetings Traders,
In today’s analysis of AUDJPY, we observe a recent bullish market structure shift (MSS), signaling potential for continued upward movement. With this in mind, we aim to capitalize on buying opportunities at key institutional points of interest to target higher premium prices.
Higher Timeframe Context:
The weekly timeframe maintains a clear bullish narrative. This long-term bias is now supported by a bullish MSS on the H4 timeframe, offering strong confluence and alignment across both macro and intermediate structures. This increases our confidence in expecting further bullish continuation.
Key Observations on H4:
Weekly Fair Value Gap (FVG) Support: Price recently pulled back into a weekly FVG and has rebalanced that inefficiency. This reaction aligns with the H4 MSS, reinforcing the weekly FVG as a strong institutional support zone.
Reclaimed Bullish Order Block: After the MSS, price retraced into a bullish reclaimed order block—an area where previous institutional positioning occurred. Since price has now reclaimed this level, it becomes a high-probability zone for renewed buying interest in the direction of the dominant trend.
Lower Timeframe Confirmation: This reclaimed order block will serve as our primary zone of interest to seek confirmations on the lower timeframes for precise entries.
Trading Plan:
Entry Strategy: Wait for bullish confirmation within the reclaimed H4 order block zone before entering long positions.
Target: The primary objective is the H4 liquidity pool situated at premium prices, which the market is likely to be drawn toward.
For a detailed market walkthrough and in-depth execution zones, be sure to watch this week’s Forex Market Breakdown:
As always, execute with discipline and align your trade management with your overall plan.
Kind Regards,
The Architect 🏛️📈

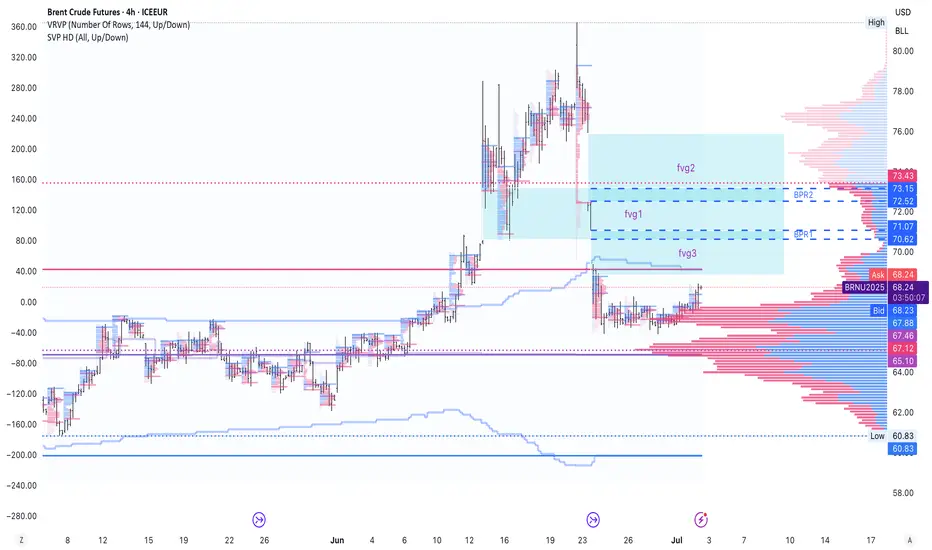
to identify BPRs on Brent Oil FuturesI am not good at the ICT price action style. So I got 2 questions for traders that know this well.
1. Did i draw the correct BPRs? I use both bars and volume profile to filter FVGs
2. Do you only use BPRs to do after break trend following or position closing, or you can actually use them in resistance reversal entry?
Need your help and advice mates.
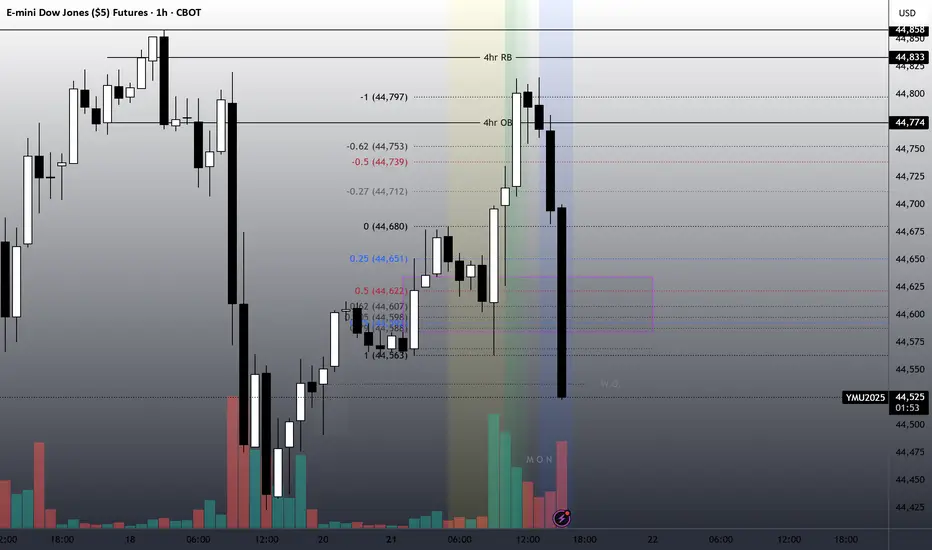
Today is the dayI found a "reaper" block today.
Were Bullish.
The Rejection block is measured from High to Low.
Tp to 1 Standard deviation.
Price knocks out buyers back into reaper FVG.
Price enters zone on top of a 1hr Orderblock at 10am.
A reaper is a Fair value gap in a discount of the impulsive price leg of a bullish breaker along with a Bias.
July 21, Forex Outlook : Don’t Miss These High-Reward Setups!Welcome back, traders!
In today’s video, we’ll be conducting a Forex Weekly Outlook, analyzing multiple currency pairs from a top-down perspective—starting from the higher timeframes and working our way down to the lower timeframes.
Pairs to focus on this Week:
EURUSD
USDJPY
AUDJPY
CADJPY
EURJPY
GBPCHF
USDCHF
NZDCHF
EURNZD
Our focus will be on identifying high-probability price action scenarios using clear market structure, institutional order flow, and key confirmation levels. This detailed breakdown is designed to give you a strategic edge and help you navigate this week’s trading opportunities with confidence.
📊 What to Expect in This Video:
1. Higher timeframe trend analysis
2. Key zones of interest and potential setups
3. High-precision confirmations on lower timeframes
4. Institutional insight into where price is likely to go next
Stay tuned, take notes, and be sure to like, comment, and subscribe so you don’t miss future trading insights!
Have a great week ahead, God bless you!
The Architect 🏛️📉

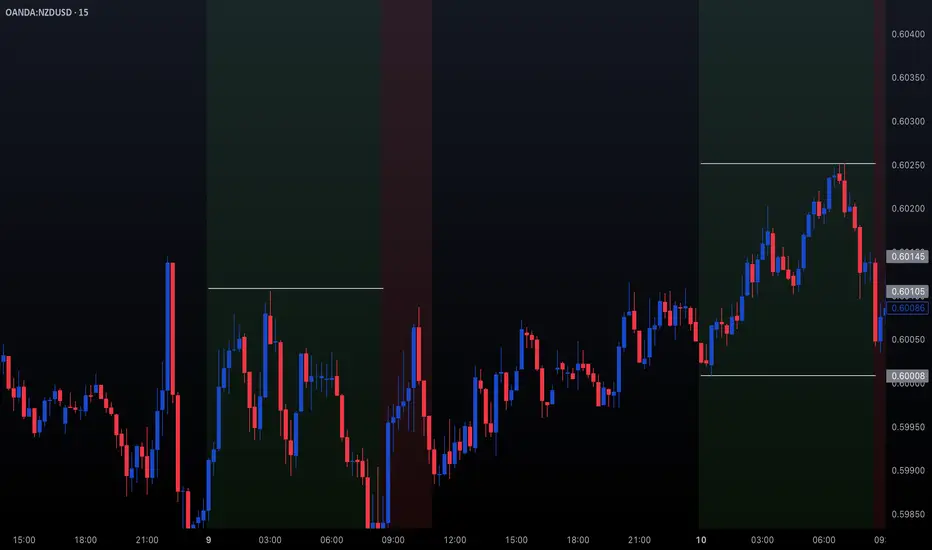
Trading NZDUSD | Judas Swing Strategy 10/07/2025Last week, we saw a textbook Judas Swing play out on OANDA:NZDUSD and this one checked every single box on our trading checklist. Let’s walk through the trade step by step
After a slow Asian session, NYO brought the kind of liquidity grab we look for. Price swept the low of our Judas swing zone, trapping early sellers and triggering stop hunts classic Judas behavior. As always, our first thought wasn’t to jump in it was to observe.
Once we spotted that liquidity sweep, our next confirmation came quickly: a clean break of structure to the upside. That shift in market sentiment was the green light to start prepping our entry. But, as we’ve learned from experience, patience is a trader’s superpower.
Instead of chasing the move, we waited for price to retrace into our Fair Value Gap (FVG) a key element in our Judas Swing checklist. No FVG touch, no trade. This time, price dipped right into our FVG zone. The moment the candle that entered the FVG closed, we executed with confidence.
Risk: 1%
Reward: 2%
Risk/Reward Ratio: 1:2
After executing the trade, there was a minor drawdown nothing major, just about 4 pips. Price never came close to our stop loss. Then came the move we were waiting for. OANDA:NZDUSD moved in our direction, and in an hour and 40 minutes, we hit our full target. A clean +2% gain added to the week’s tally.
This trade is a perfect example of how the Judas Swing strategy thrives especially after false moves into liquidity zones.
It was a clean setup:
- Sweep of liquidity
- Break of structure
- Retrace into FVG
- Controlled risk, solid R:R
If you’re still taking trades without a structured plan, now’s the time to consider building one. Strategies like this don’t just work because of entries they work because of discipline, timing, and consistency. We don’t trade everything. We trade the setups that check every box.
Gold Trading Idea: Short Opportunity on 15-Min Descending ChanneHello TradingView Community,
Following up on my Gold analysis from Monday, the price action has respected the levels I outlined (check my previous posts for the breakdown), delivering solid trade opportunities except yesterday's news-driven volatility. Today, we're eyeing a short setup on Gold based on the 15-minute timeframe.
Technical Analysis:
Gold is moving within a descending channel on the 15-min chart.
I've identified equal highs and a small FVG (Fair Value Gap) aligning with the 61.8% Fibonacci retracement of the channel's range.
This confluence zone is where I expect the price to react, potentially clearing liquidity above the channel before reversing.
Trade Plan:
Entry: Wait for the price to reach the confluence zone (equal highs + 61.8% Fib + FVG) and show a clear reaction (e.g., rejection or reversal pattern) before entering a short position.
Take Profit: Targeting 3310 level.
Risk Management: If the price fails to reach the zone and breaks lower, I'll stay out to avoid chasing trades. Patience is key here.
Stay disciplined, traders! Let the price come to our zone, and always manage your risk.
Follow for more setups, like this post if you found it helpful, and drop your thoughts in the comments below! Let’s discuss!
#Gold #XAUUSD #ShortSetup #TechnicalAnalysis

July 13, Forex Outlook : This Week’s Blueprint to Profit!Welcome back, traders!
In today’s video, we’ll be conducting a Forex Weekly Outlook, analyzing multiple currency pairs from a top-down perspective—starting from the higher timeframes and working our way down to the lower timeframes.
Currency Pairs:
EURUSD
USDCAD
AUDUSD
EURGBP
EURJPY
GBPCHF
USDCHF
NZDCHF
NZDUSD
EURNZD
Our focus will be on identifying high-probability price action scenarios using clear market structure, institutional order flow, and key confirmation levels. This detailed breakdown is designed to give you a strategic edge and help you navigate this week’s trading opportunities with confidence.
📊 What to Expect in This Video:
1. Higher timeframe trend analysis
2. Key zones of interest and potential setups
3. High-precision confirmations on lower timeframes
4. Institutional insight into where price is likely to go next
Stay tuned, take notes, and be sure to like, comment, and subscribe so you don’t miss future trading insights!
Have a great week ahead, God bless you!
The Architect 🏛️📉

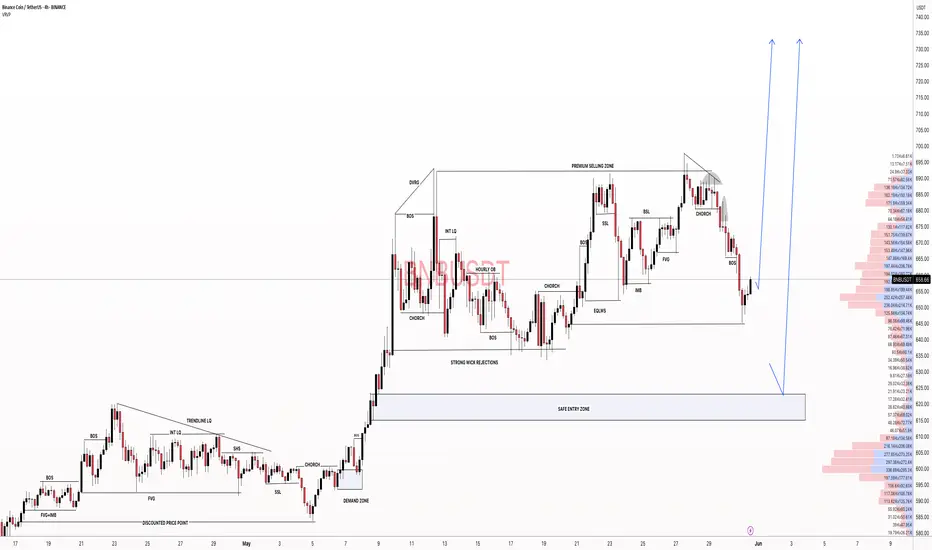
#BNBUSDT: A Major Bull Move Incoming $1000 Target! Binance coin is currently in consolidation phase, with no clear direction of where it will go. We consider two possible areas where it may reverse. Both of these areas have a chance to hit $1000, which we believe the price could head towards once reversed.
If you like our idea, please like and comment!
Good luck and trade safely,
Team Setupsfx_
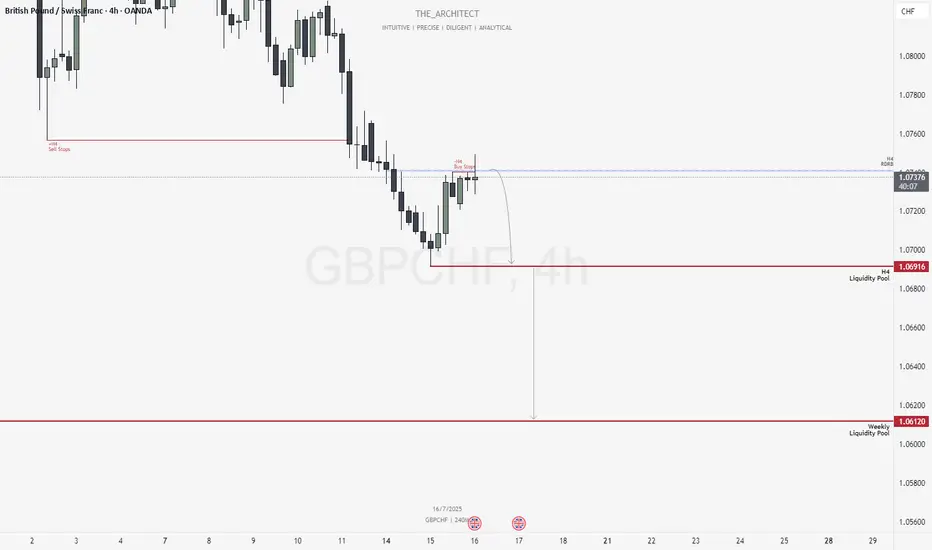
GBPCHF: Bearish Structure Aligns for Potential Sell Setups!Greetings Traders,
In today’s analysis of GBPCHF, we observe that the institutional order flow is currently bearish, and as such, we aim to align with this bias by identifying selling opportunities from key institutional resistance zones.
Higher Timeframe Context:
Weekly TF:
The weekly timeframe, which serves as our macro bias, is firmly bearish. This sentiment is reinforced on the H4 timeframe—our intermediate structure—which is also delivering consistent lower highs and lower lows. The alignment between these two timeframes strengthens our conviction to trade in the direction of institutional bearish order flow.
Key Observations on H4:
Re-delivered & Re-balanced Price Zone: Price has retraced into a previously balanced area that has now been re-delivered into, signaling institutional interest. Rejection from this zone adds to our bearish bias.
Buy Stop Raid: Price action has swept H4 buy stops in this area, providing confirmation that smart money may have used this liquidity for order pairing into short positions.
Entry Zone: The current rejection suggests a high-probability shorting opportunity from this region, provided confirmation on the lower timeframes.
Trading Plan:
Entry Strategy: Await confirmation at the current H4 resistance for short entries.
Targets: First target is the H4 liquidity pool located at discount prices. The longer-term objective is the weekly liquidity pool, which represents the primary draw on liquidity.
Continue to monitor price action closely, maintain patience for confirmation, and manage risk according to your trading plan.
Kind Regards,
The Architect 🏛️📉
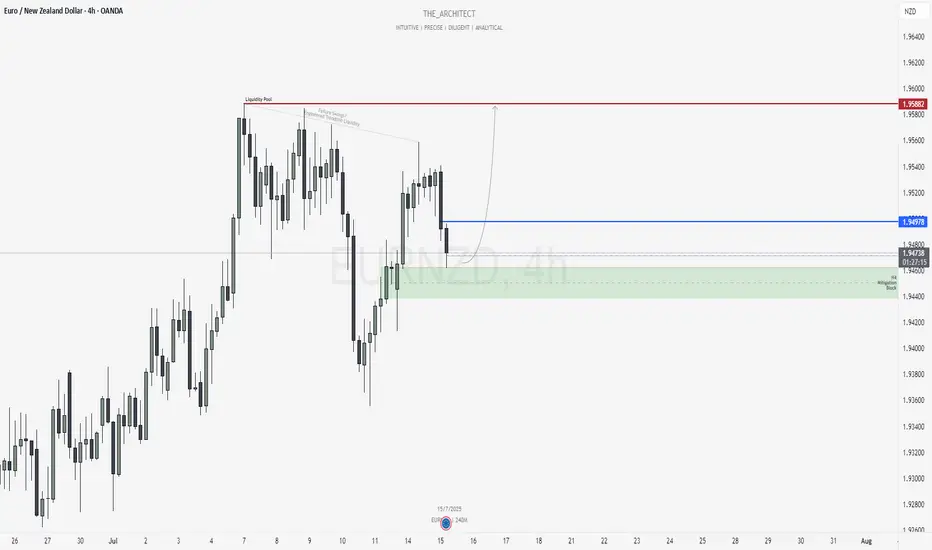
EURNZD: Bullish Setup Targeting Engineered Highs!Greetings Traders,
In today’s analysis of EURNZD, we observe that the market is currently operating within bullish institutional order flow. It is therefore essential that we align our bias with this narrative by focusing on buying opportunities.
Market Context:
Higher Timeframe Alignment:
The weekly timeframe is showing a bullish draw on liquidity, and this is confirmed by the H4 (intermediate) timeframe, which is also structurally bullish. This alignment between higher and intermediate timeframes provides strong confluence for long positions.
Mitigation Block Support:
Price has recently retraced into an H4 Mitigation Block—a key institutional support zone. This area represents a region where previous sell-side activity was initiated. Now that price has broken above it, institutions are likely using this retracement to mitigate prior sell positions and establish new buy orders.
Trade Idea:
Entry Strategy:
Look for confirmation on the lower timeframes within the H4 mitigation block to initiate long positions in alignment with institutional order flow.
Target Objective:
The primary target is the relatively equal highs residing in premium pricing. These levels coincide with engineered trendline liquidity and failure swings, making them highly attractive profit-taking zones for institutions—where significant buy-side liquidity is expected to be absorbed.
Stay patient and execute only upon clear confirmation signals.
Kind Regards,
The Architect 🏛️📊
Weekly Equities Trade Idea: CRCL Puts (Update)Hello Traders!
I'm providing an update to the CRCL trade idea from Monday July 14th. Here's what I'm watching:
- Price to open within the range from Tuesday July 15th
- Potential imbalance resolve from Monday July 14th at $204.70
- If price breaks Friday July 11th's high at $206.80 the trade is invalidated
Cheers,
DTD

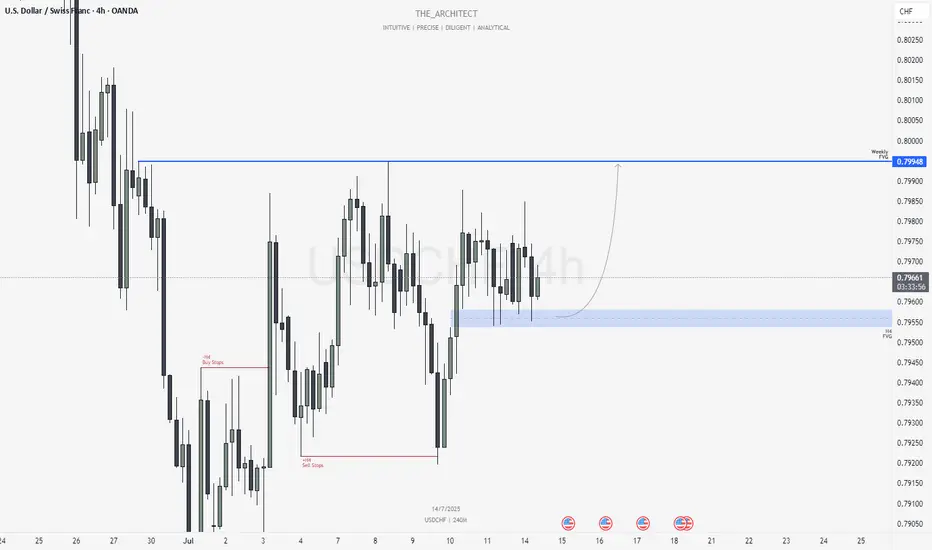
USDCHF: H4 Bullish Order Flow Targeting Weekly FVGGreetings Traders,
In today’s analysis of USDCHF, we observe that the H4 timeframe is currently delivering bullish institutional order flow. As a result, our directional bias is aligned with seeking buying opportunities that reflect this bullish momentum.
Market Context:
Higher Timeframe Objective:
The current draw on liquidity is aimed at a Weekly Fair Value Gap, which now serves as our primary upside target. Since the higher timeframe narrative is bullish, it’s essential that our intermediate timeframe—the H4—confirms this bias, which it does through consistent bullish structure.
Institutional Support Zone (H4):
As price continues to form higher highs and higher lows, it has now retraced into an H4 Fair Value Gap, functioning as an institutional support zone. Notably, this area has been retested multiple times, further reinforcing its strength and significance.
Trading Plan:
Entry Strategy:
Monitor the lower timeframes for confirmation signals within the H4 Fair Value Gap. Look for bullish price action cues before executing buy orders.
Target:
The primary objective remains the Weekly Fair Value Gap, which represents a key area of institutional interest and a likely zone for price to be drawn into.
July 13, Forex Outlook : This Week’s Blueprint to Profit!
Stay patient, follow your confirmations, and align with the flow of smart money.
Kind Regards,
The Architect 🏛️📊
Short-term Bear Case for CRCLHello Traders!
As part of my weekly equity trade analysis, I will be uploading my recordings of what I am seeing and intending to trade for the week. A quick summary of what's in the video is as follows:
- CRCL is a high beta stock that seems to not be moving in tandem with its peers as of late
- I am expecting volatility due to market data and monthly options expiration
- CRCL has formed a new bearish order block below another bearish order block and is wedged with a weekly bearish setup. We are anticipating expansion out of this range to the downside
- I am waiting for a re-test of $199-$205 for a full move to $155-$145
Cheers,
DTD

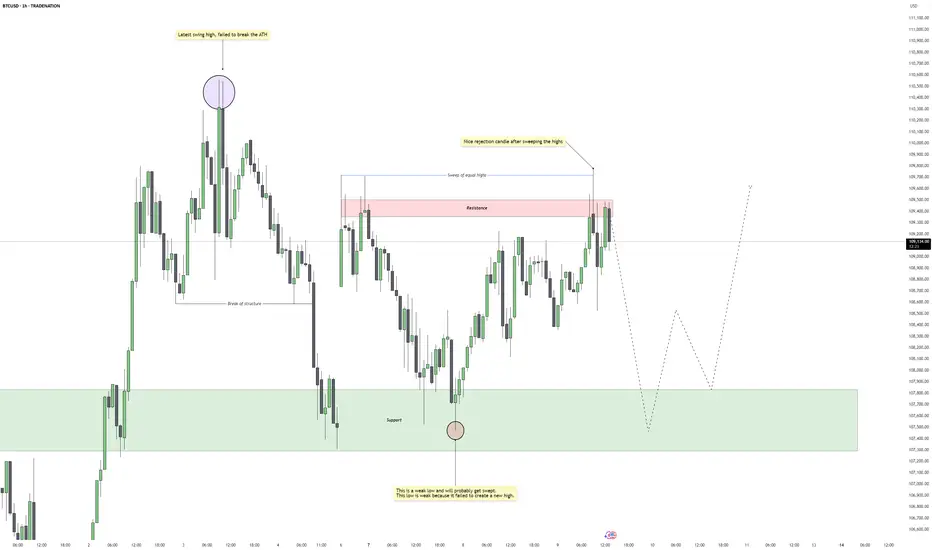
Bitcoin – Rejection Confirms Trap, Next Stop: $107kBitcoin attempted to take out the swing high around 110.5k but failed to clear the previous all-time high, resulting in a sharp rejection. This failure marks a significant turning point, suggesting a lack of bullish momentum at premium levels. The rejection came after a sweep of equal highs within a well-defined resistance zone, indicating a potential liquidity grab.
Highs Swept, But No Breakout
After dropping into support around the 107.5k region, price managed to push up and form a new swing high, but once again met heavy selling pressure after sweeping the prior equal highs. That sweep and the subsequent rejection give this structure the character of a classic liquidity trap, where smart money runs the highs only to reverse.
Weak Lows Below
The support zone has now been tapped multiple times, and the most recent low is structurally weak. It failed to produce a higher high, which makes it vulnerable to a clean stop hunt. Given this context, these lows are likely to be targeted next, as price seeks out sell-side liquidity resting beneath.
Expected Path Forward
I’m expecting further downside to unfold from here. The rejection from resistance, paired with the weak internal structure, suggests Bitcoin will take out the weak lows near 107.5k. Once those lows are swept, I expect a bullish reaction from the same demand zone, setting up a potential long opportunity back into the 109k–110k area. The plan is to look for signs of a reversal after the sweep, such as a 5M market structure shift or a fair value gap entry setup.
Liquidity Map and Trade Plan
The current price action is best viewed through the lens of liquidity. The highs were engineered to trap breakout buyers and then rejected. Now, the weak lows offer the next logical draw on liquidity. My focus is on short-term downside targeting that 107.2k–107.5k support region, followed by a potential bullish reversal setup once that liquidity is cleared.
Conclusion
This is a clean example of a failed breakout, followed by engineered liquidity moves in both directions. As long as price respects the current structure, my bias remains short into the weak lows, followed by a high-probability long setup once those lows are swept and the market shifts.
Disclosure: I am part of Trade Nation's Influencer program and receive a monthly fee for using their TradingView charts in my analysis.
___________________________________
Thanks for your support!
If you found this idea helpful or learned something new, drop a like 👍 and leave a comment, I’d love to hear your thoughts! 🚀