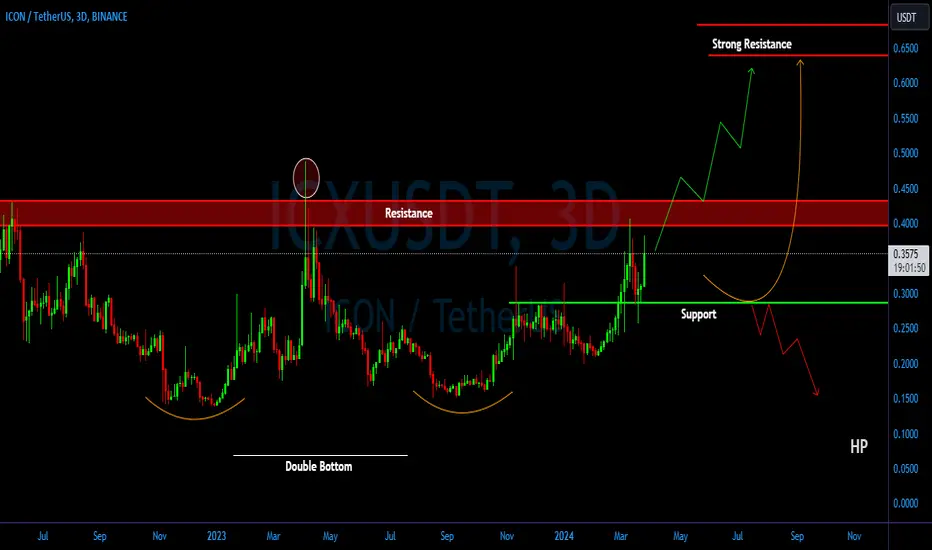
ICX/USDT A successful break the pattern, will indicate a bullish💎 ICX has undeniably attracted significant attention in the market with the formation of a double-bottom pattern.
💎 There is potential for ICX to attempt a breakout above the resistance neckline of this pattern. A successful breakout could pave the way for significant upward movement towards our target strong resistance area.
💎 However, if ICX fails to break above the resistance, there is a possibility of rejection, leading the price back to the support area around 0.285 to gather new momentum.
💎 ICX must bounce from the support area to make another attempt at breaking above the resistance of the double bottom pattern. Failure to bounce, or worse, a breakdown below the support, could signal further downward movement for ICX.
Icxusdt
#ICXIt has left the descending channel in the daily time and is currently moving in a corner pattern, which can continue its growth with a pullback to the area of 19 cents in the weekly time until the neckline.

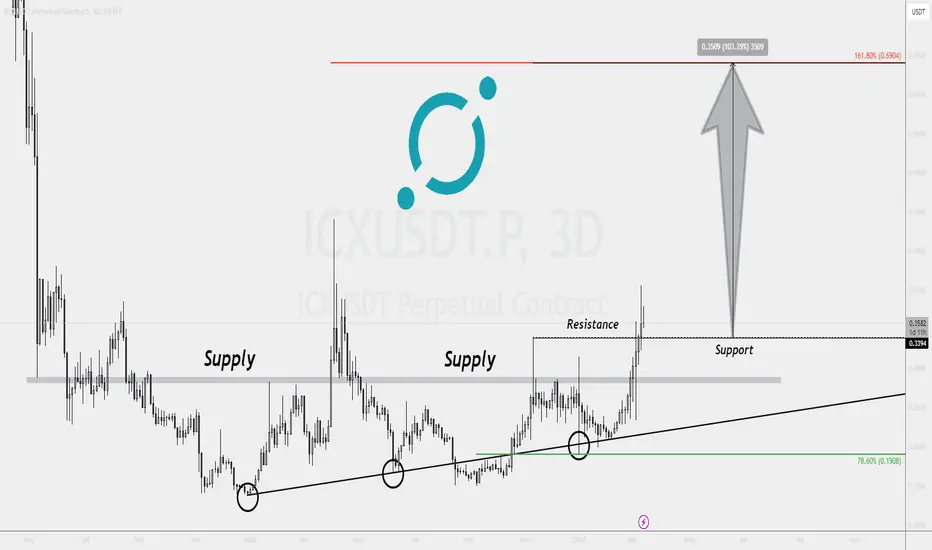
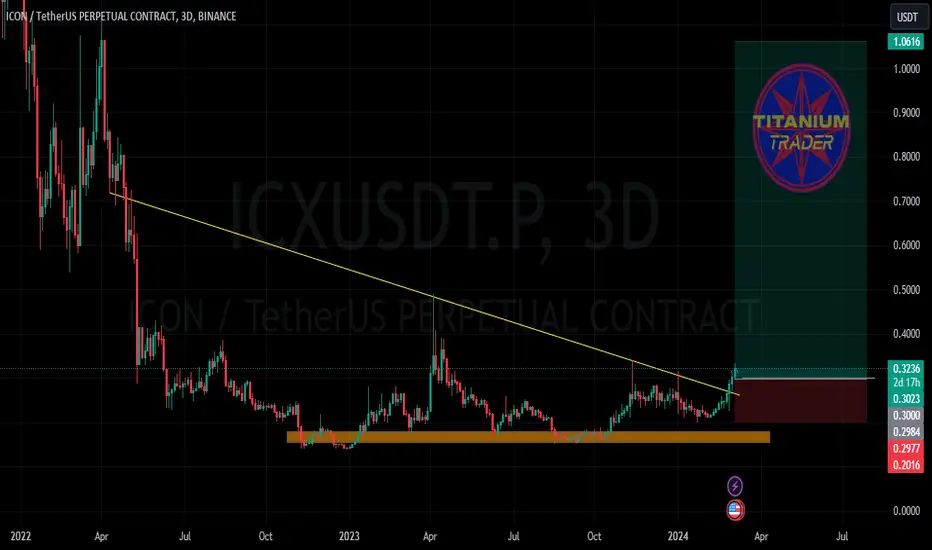
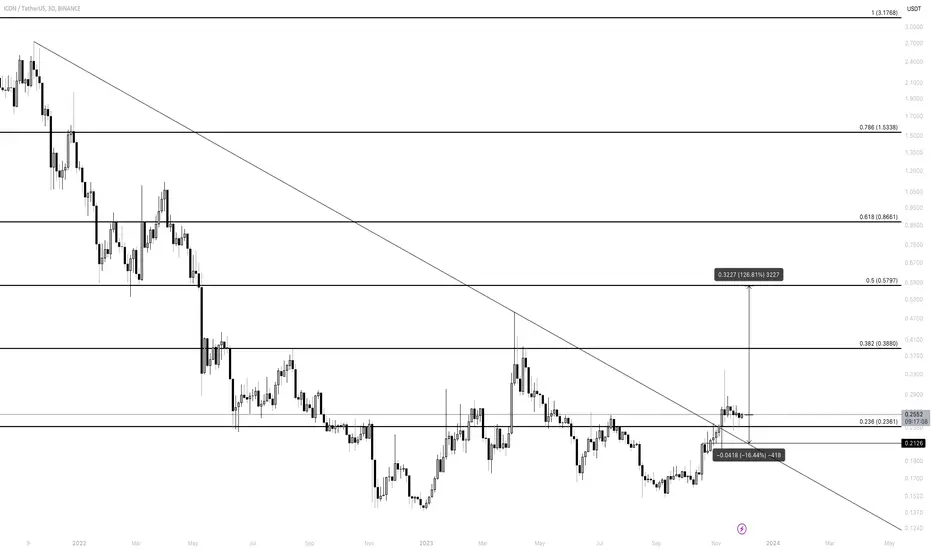
ICXUSDT Momentum Shifts and 100% Upside PotentialAfter giving a respectful nod to the long-term downtrend trendline, ICXUSDT went ahead and broke free from the supply zone. The recent resistance at $0.33 is now playing the role of a supportive ally.
What does all this mean? Well, it's looking like ICXUSDT is on an exponential bullish streak. And you know what that means? We're likely to see this uptrend continue its momentum.
Now, let's talk upside targets. The ever-reliable 161.8% Fibonacci retracement level seems like a reasonable goal. And if we hit that mark, get ready for a jaw-dropping 100% price surge for ICON!
ICX should moon soonAs we can see ICX had nice move to the upside recently. I still think this is not end of bulls atm.
This can go in next days, week or two... playing spot.
NOT A FINANCIAL ADVICE
ALWAYS USE STOPLOSS AND MANAGE YOUR RISK
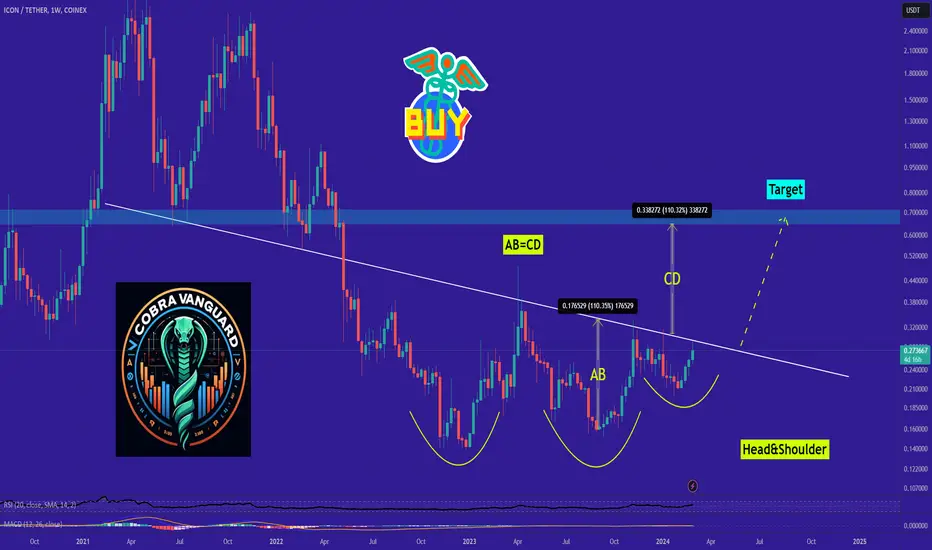
ICX Road Map🗺️!!! situation+next targets.Hi.
COINEX:ICXUSDT
✅Today, I want to analyze ICX for you in a Weekly time frame so that we can have a MID-term view of ICX regarding the technical analysis. (Please ✌️respectfully✌️share if you have a different opinion from me or other analysts).
ICX has formed an inverse head and shoulders pattern. If price followed this pattern and will soon reach to 0.70 . The expected movement is measured as the price movement (AB=CD).
✅ Due to the Ascending structure of the chart...
- High potential areas are clear in the chart.
Stay awesome my friends.
_ _ _ _ _ _ _ _ _ _ _ _ _ _ _ _ _ _ _ _ _ _ _ _ _ _ _ _ _ _ _ _ _
✅Thank you, and for more ideas, hit ❤️Like❤️ and 🌟Follow🌟!
⚠️Things can change...
The markets are always changing and even with all these signals, the market changes tend to be strong and fast!!
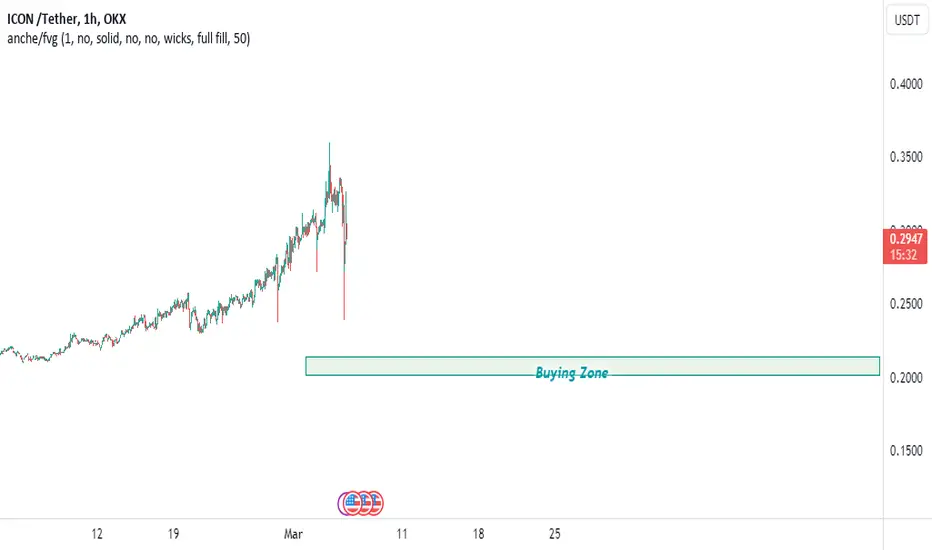
#ICX more Than 80 % Pump Coming..#ICX more Than 80 % Pump Coming.. Placed buying orders at buying zone..Market will retrace soon. It's a fake dump.
ICX/USDT Seems Poised for Bull Run? ICX Analysis💎ICXUSDT is showcasing dynamic market movements, poised on the edge of breaking free from its descending channel pattern.
💎At present, #ICoin is undergoing sideways consolidation within a demand zone, which was once a supply area. There's a significant chance for the price to rebound from this zone and initiate an upward trend, aiming for the bearish OB area as its next milestone.
💎If ICX does not manage to rebound and instead falls below the demand zone, it might withdraw to the Bullish OB area, situated around the $0.196 mark, in search of renewed drive for an ascent.
💎The Bullish OB area has historically been a key point for triggering notable recoveries upon its examination. Yet, a failure of this zone, substantiating a bearish trend, could lead ICX to seek bullish signals from an even lower stance.
💎In the event ICX doesn't leverage upward momentum from this subsequent level, it would likely sustain its descent. Rest assured, we're here to assist you in navigating through these market shifts.

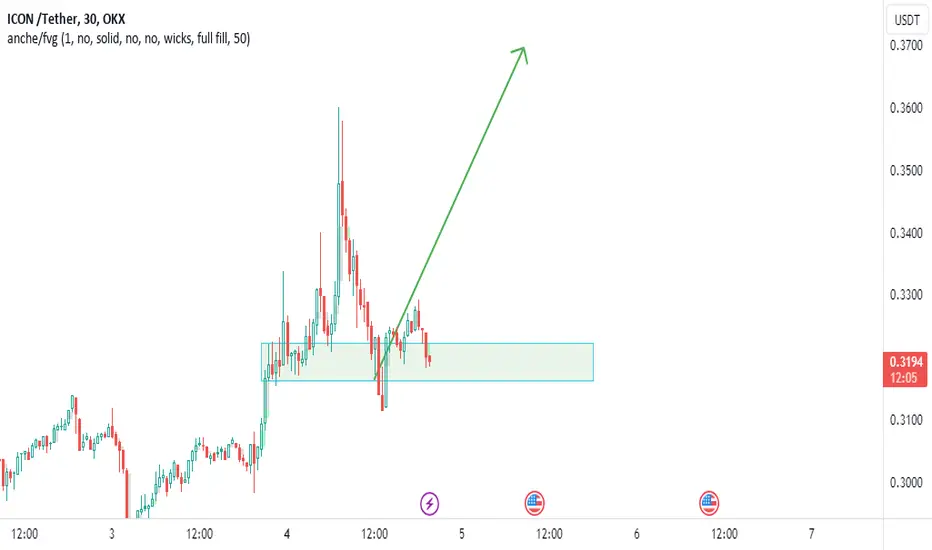
#ICX Long For 20-25 % Move#ICX Long For 20-25 % Move.. Not Sure but ICX can move 20-25 % from the Zone. My entry is 0.3192..Lets See.
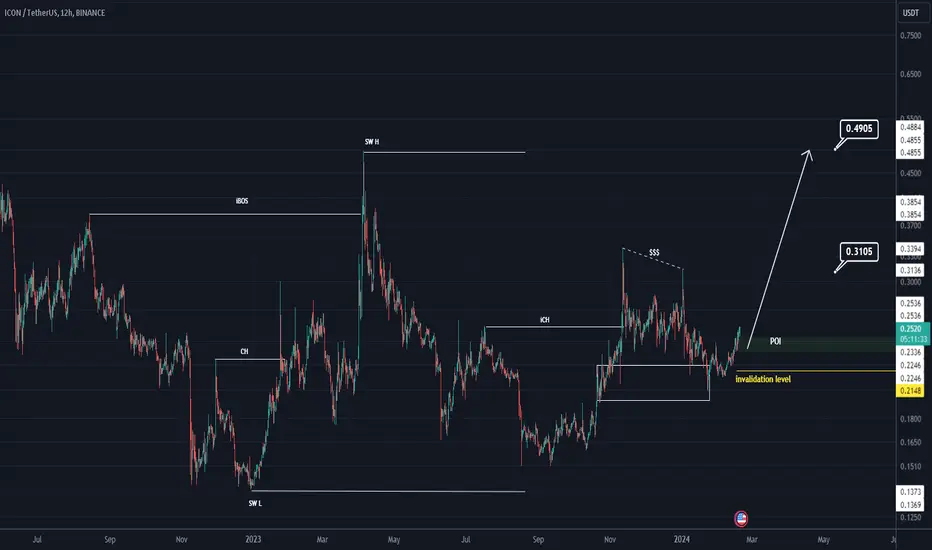
ICX will be pumped soonIt has a boolean structure. It can be pumped while maintaining the green range.
It is expected to sweep the minimum liquidity pool indicated on the chart. The targets are clear on the chart.
Closing 1 daily candle below the invalidation level will violate the analysis
For risk management, please don't forget stop loss and capital management
When we reach the first target, save some profit and then change the stop to entry
Comment if you have any questions
Thank You
ICX 3D HUGE BULISH BREAKOUT 3X GAINICX coin made a huge bullish wave in 3d charts and broke descending channel. If bullish rally continues, we might see 3x growth soon.
Icx/Usdt Breakout Alert
🚀 ICX/USDT Breakout Confirmed!🚀
I'm anticipating a price surge in the upcoming days, with an expected bullish movement of 40-80% soon. 📈 Let's see! 🤞
Disclaimer:This is not financial advice. Do your own research! 🧐

ICXUSD 1W#ICX ~ 1W
Make purchases gradually after breaking through this resistance line, minimum target 20%++
ICX/USDT Break this area, next stop is Bullish Flag resistance!💎 ICX has recently exhibited significant market dynamics. Presently, ICX is encountering resistance in the supply area, where it has historically faced rejection.
💎 However, if ICX manages to successfully break out above this area, it could trigger a bullish momentum, potentially leading to the continued upward movement toward the resistance trendline of the Bullish Flag pattern.
💎 A breakout from this pattern could pave the way for further gains, possibly reaching our target area.
💎 Conversely, if ICX fails to break above the supply area, there's a possibility of price rejection, leading to a downward movement towards the support area or even the demand area.
💎 The demand area holds crucial significance as it often serves as a pivotal level for price action. A bounce from this area could indicate renewed buying interest and potential for another attempt to break out above the supply.
💎 However, if ICX fails to hold above the demand area, it would signal weakness and potentially lead to a bearish trend reversal, with the price likely heading further downwards.

ICX soon can break above the Bullish channelICX soon can break above the Bullish channel. We might see a small bounce off the Resistance line r the upper band of the channel.
🔵Entry Zone 0.2494 - 0.2570
🔴SL 0.2285
🟢TP1 0.2682
🟢TP2 0.2921
🟢TP3 0.3135
Risk Warning
Trading Forex, CFDs, Crypto, Futures, and Stocks involve a risk of loss. Please consider carefully if such trading is appropriate for you. Past performance is not indicative of future results.
If you liked our ideas, please support us with your likes 👍 and comments.

ICX deviation?ICXusdt looks good here to be longed.
Looks like a clean deviation holding here can send big.
LL Longed 0.2150.
Tight stops. If doesn't hold 0.2100 or looks really bad.
Targeting higher.
Note: Not a financial Advice.
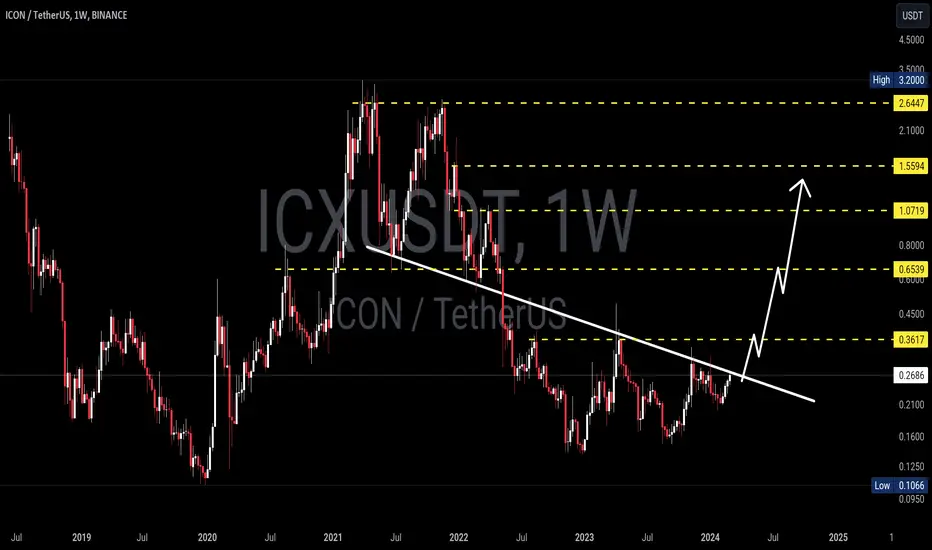
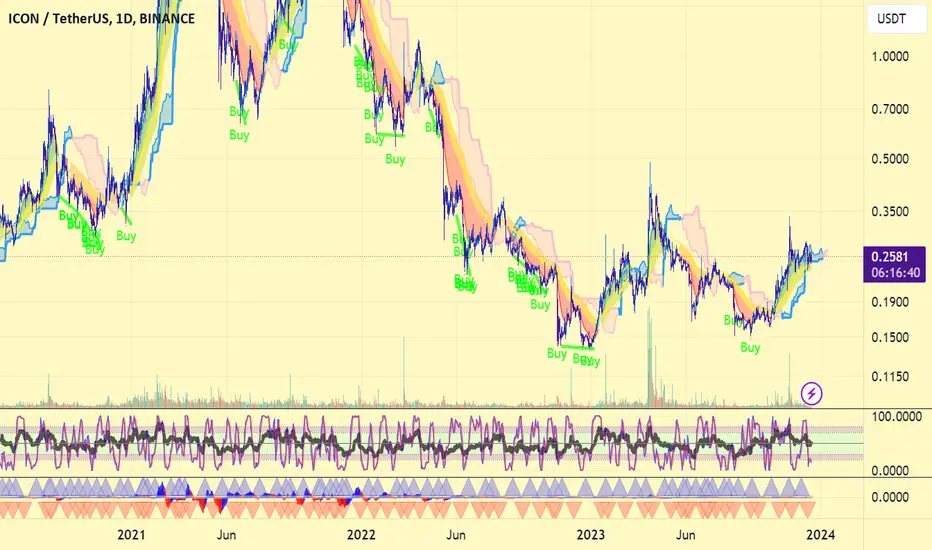
ICX vs USD long-term viewHi,
this is my long-term view for ICX vs USD.
The patterns are very clear.
Very long accumulation phase, with 2 doble bottoms.
Excellent reversal pattern for an explosive move to the upside!
Thank you and happy trading!
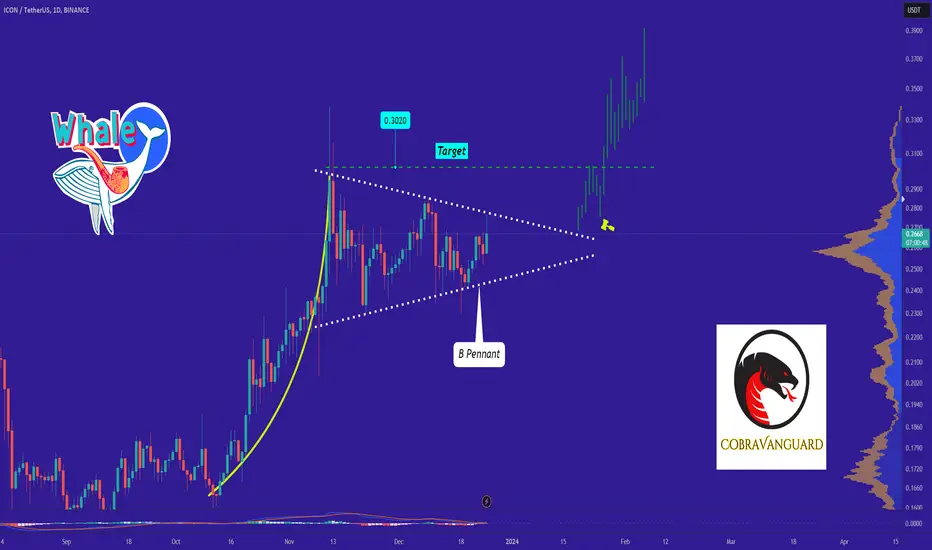
🚧ICXUSDT is Bullish now🚧 & many Traders don't see it 👀!!!Hi every one
➡️ICX has done a Impressive Movement recently but the odds of another bullish Movement is Pretty high because the pattern which ICX is in, Is a Bullish Pennant Pattern! Since The break out has not happened, there is no confirmation of a Bullish Movement But If It happens, we Can Expect a Bullish Movement as much as the Measured Price movement (Pennant pole) to happen!
🟡Summery:
-ICX has been Bullish Recently!
-The odds of another Bullish Movement is High!
-Bullish Pennant is Visible on The chart!
-No break out yet!
🤑Stay awesome my friends.
_ _ _ _ _ _ _ _ _ _ _ _ _ _ _ _ _ _ _ _ _ _ _ _ _ _ _ _ _ _ _ _ _
✅Thank you, and for more ideas, hit ❤️Like❤️ and 🌟Follow🌟!
⚠️Things can change...
The markets are always changing and even with all these signals, the market changes tend to be strong and fast!!
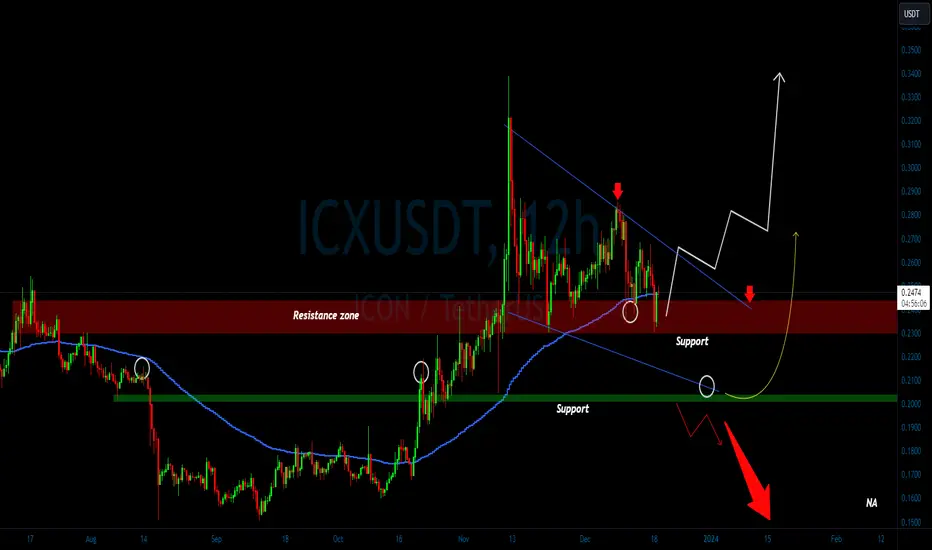
ICXUSDT Evaluating Key Support? What next 👀 ICON Analysis💎 Paradisers, let's delve into #ICXUSDT as it's currently demonstrating a noteworthy market behavior. Positioned at a critical support level, it is hinting at its upcoming market direction.
💎 Focusing on #ICON recent activity, it's steadfastly holding onto the key support level at $0.2305. Should the price maintain its momentum here, there’s a strong chance we’ll witness an upward movement. Additionally, it is tracing a descending channel pattern. A break above this pattern could further cement the bullish scenario.
💎 However, in the ever-dynamic crypto market, we must be prepared for various outcomes. If #ICX dips below this key support level, we might need to pivot our strategy, eyeing a potential bullish rebound from a lower support level at $0.2022.
💎 And here's an essential point: if #ICX breaks through the $0.2022 support level, it could indicate a shift towards a bearish trend, with market sentiment potentially moving to the sell side. 🌴💰
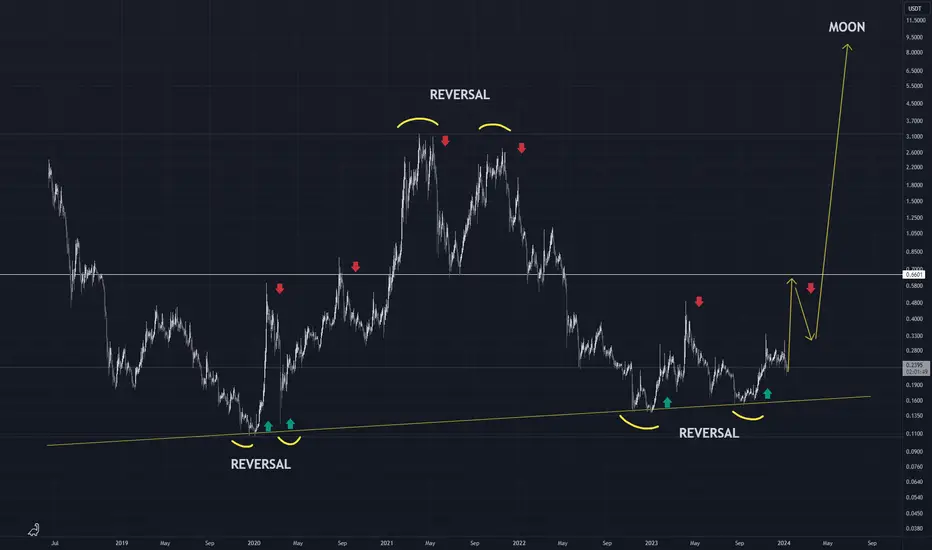
#ICX will moon soon?Main net upgrade is incoming..
Good, long time accumulation. W bounce in higher time frame.
Good looking HTF chart.
NOT FINANCIAL ADVICE.
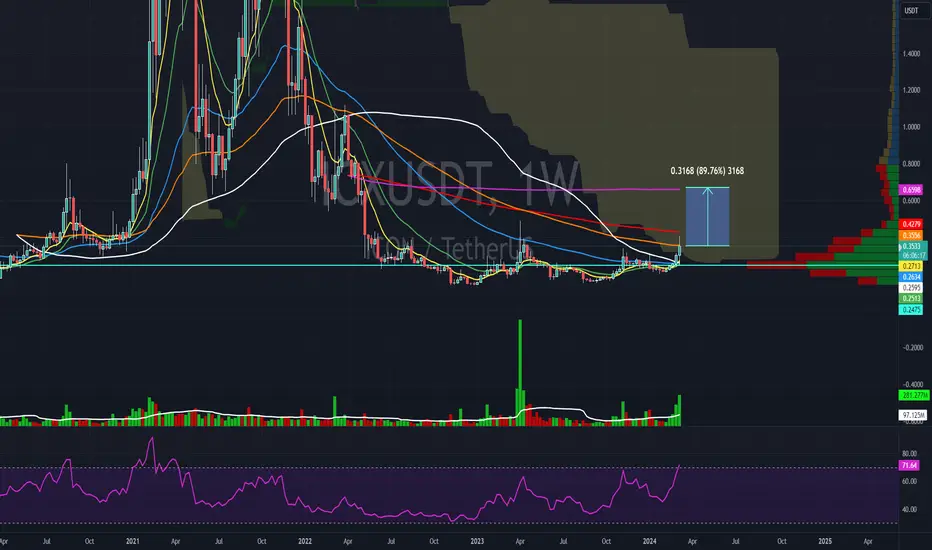
ICX coin is ready to fly!Hello trader! Today I have a new idea for you. Like and subscribe to the channel, there is a lot of useful information there.✅
I decided to take the ICX coin to the spot.
Previously I tried to long this coin locally, but when I expanded the chart and looked at the global picture, I saw something interesting)
Technical: the price has broken through the global countertrend line and is now in a small accumulation in the support zone of 0.236 Fibonacci.
I decided to take 2.5% of the deposit from current to spot, BUT! There is a suspicion that with a possible correction, BTC may begin to throw alts down 10-15%; the ICX will just test the countertrend line. I left there an additional 2.5% of the deposit.
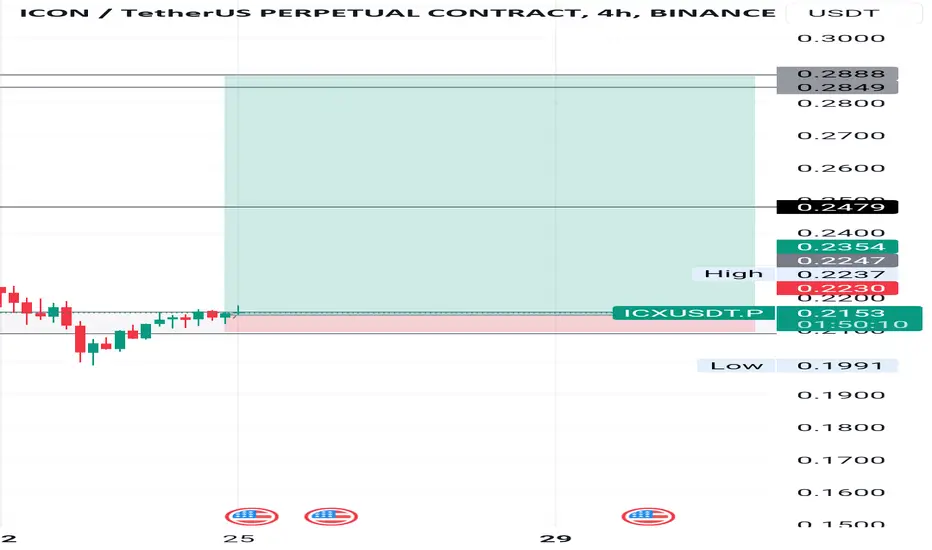
Retesting the trend line and growth!Hello trader! Today I have a new idea for you. Like and subscribe to the channel, there is a lot of useful information there.✅
Technical: the asset price on the local chart may retest the trend line, from where I expect to see a rebound. I am entering a position now with a small gain at the trend line.
Deal plan:
▪️Entrance - 0.2484/0.24$
▪️Stop - 0.2231$
▪️Take - I will update.
Guys, try to respect the risks - this is an altcoin that can show strong volatility at the moment!

#ICX 0.8 On The Way#ICX 0.8 On The Way.. I am in with this trade with low leverage. Please support us if you earning with our ideas. Soon we'll start our premium services.
Thanks!
NAMASTE !
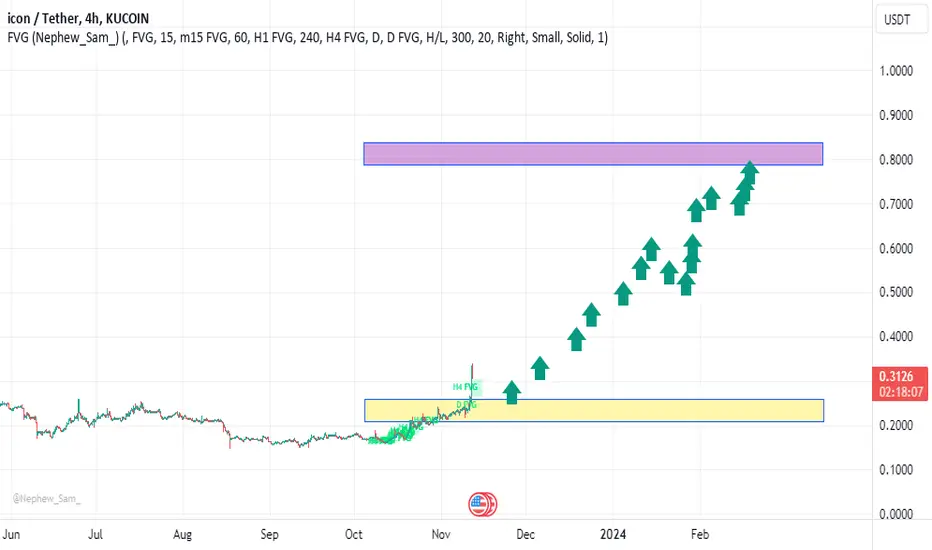
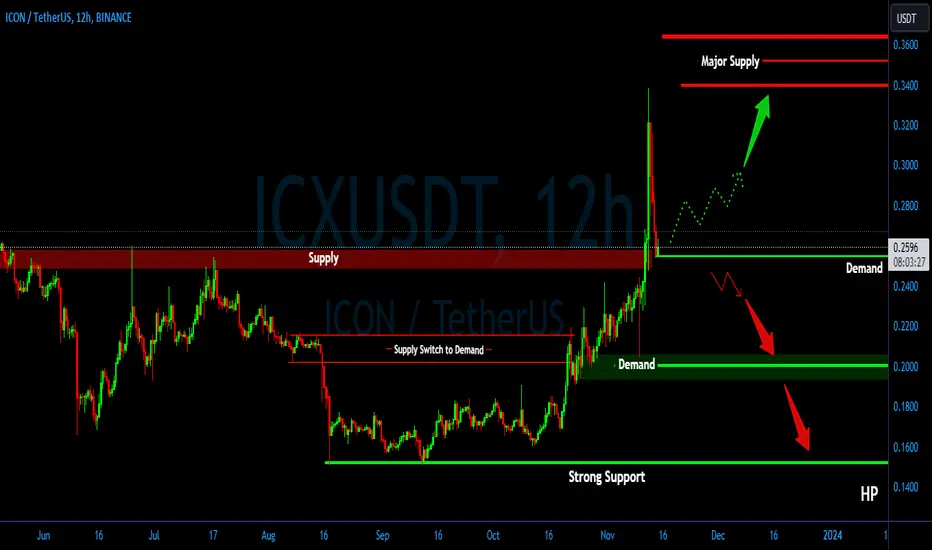
ICX/USDT Need to bouncing to continue the upward movement !!💎 ICX has undoubtedly captured significant attention in the market. Currently, it has perfectly broken out of the rounding bottom in the supply area with substantial volume. ICX is currently undergoing a retesting phase in the demand area, which precedes the supply zone.
💎 If the retesting phase in the demand area proves successful, there is a likelihood that ICX's price will bounce, the probability of continuing its upward trajectory and reaching our target in the major supply area.
💎 However, if ICX encounters difficulties during the retesting phase at the demand zone and struggles to maintain its position, resulting in a breakdown, the scenario shifts to a bearish movement.
💎 In such a case, ICX may retracement to the next lower demand area. At this point, ICX would require a bounce to reclaim the area around $0.26 to sustain its upward movement. Failure to reclaim this area could lead to a continued downward movement, possibly returning to the strong support zone.