Trade Signal | ICON (ICX) coin is ready for upto 15% pumpHi dear friends, hope you are well and welcome to the new trade setup of ICON (ICX) coin with US Dollar pair.
Our last successful trade of ICX was the below one:
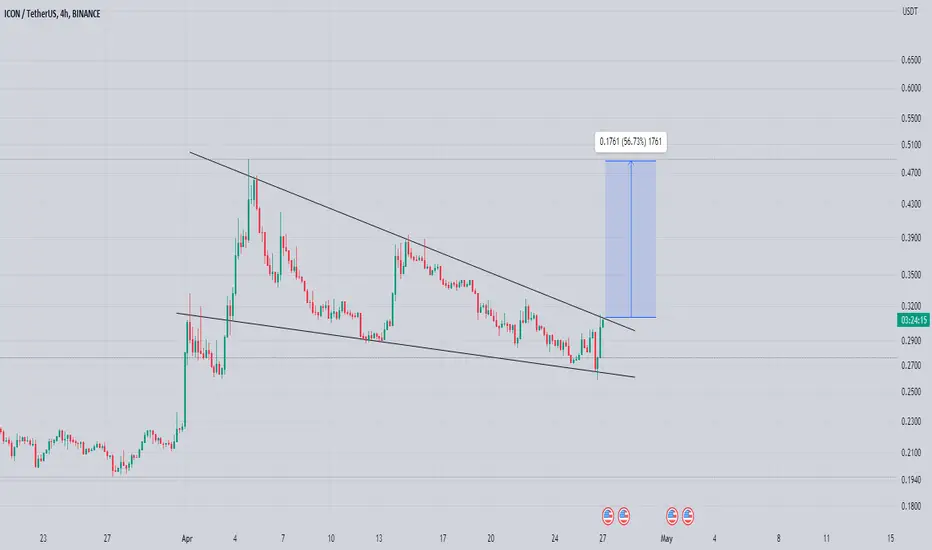
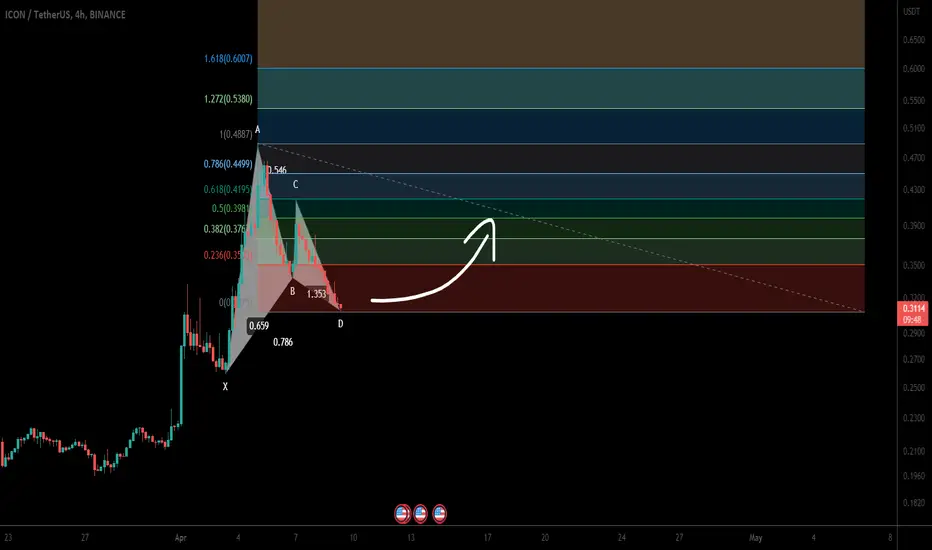
Now on a on a 4-hour time frame, ICX has formed a bullish Gartley move for the next price reversal.
Note: Above idea is for educational purpose only. It is advised to diversify and strictly follow the stop loss, and don't get stuck with trade.
Icxusdt

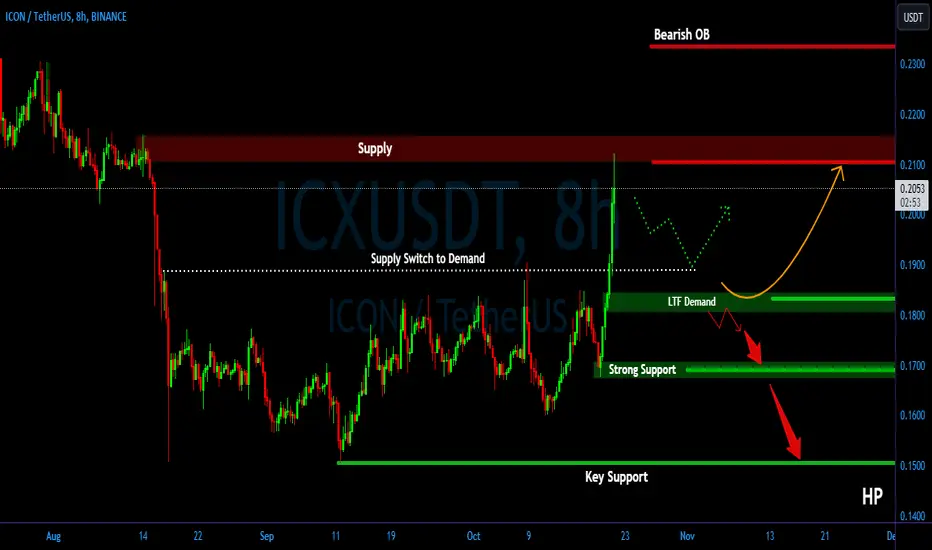
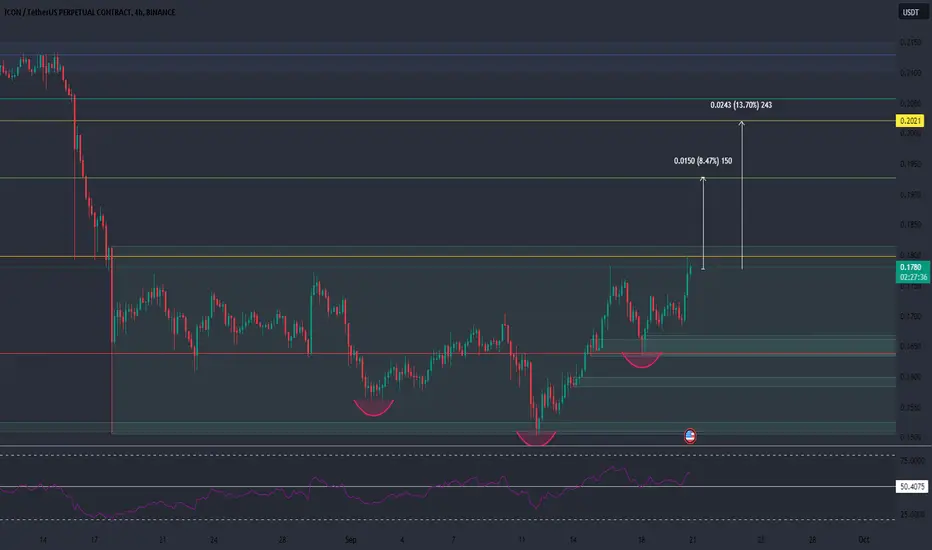
ICX/USDT Upward Momentum ??? The second pump is coming!💎 ICX has undoubtedly piqued our interest. Recently, ICX managed to break free from the consolidation phase and also surpassed the supply zone. This ascent was marked by a significant upward surge, bypassing the initial need for a retesting phase.
💎 However, ICX faced a stern rejection at the supply zone ranging from $0.210 to $0.216. It's plausible that ICX might retreat for a retesting phase, eyeing the Demand level at $0.188 or the lower timeframe (LTF) demand at $0.185.
💎 Upon reaching this demand zone, it's crucial for ICX to rally, crafting a bullish rejection candle to signal readiness for a resurgence and another attempt at breaching the supply zone.
💎 However, there's a downside risk. If ICX reaches the demand zone but fails to forge a rejection candle, instead crumbling through the demand level, it could spell a bearish phase for ICX. This scenario could potentially drive the price further down toward a robust support level, or even as low as the key support threshold.
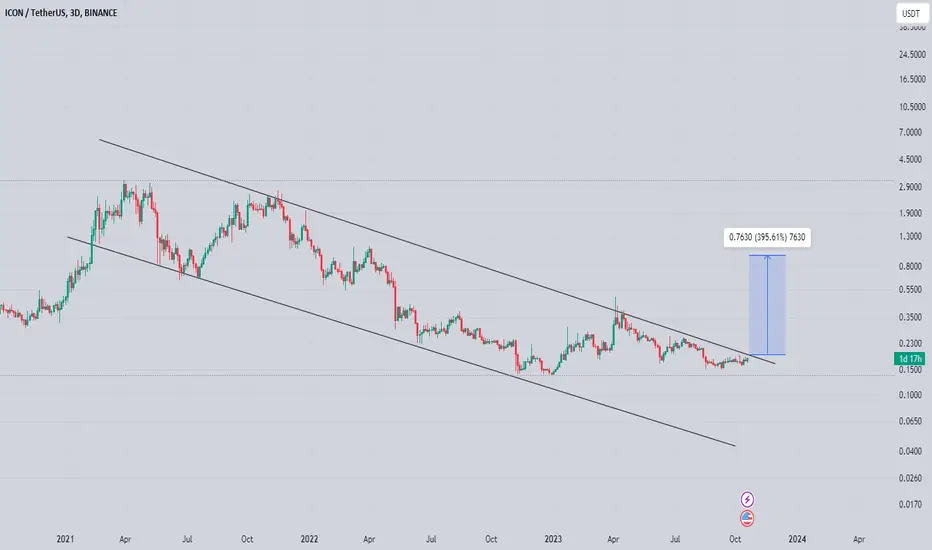
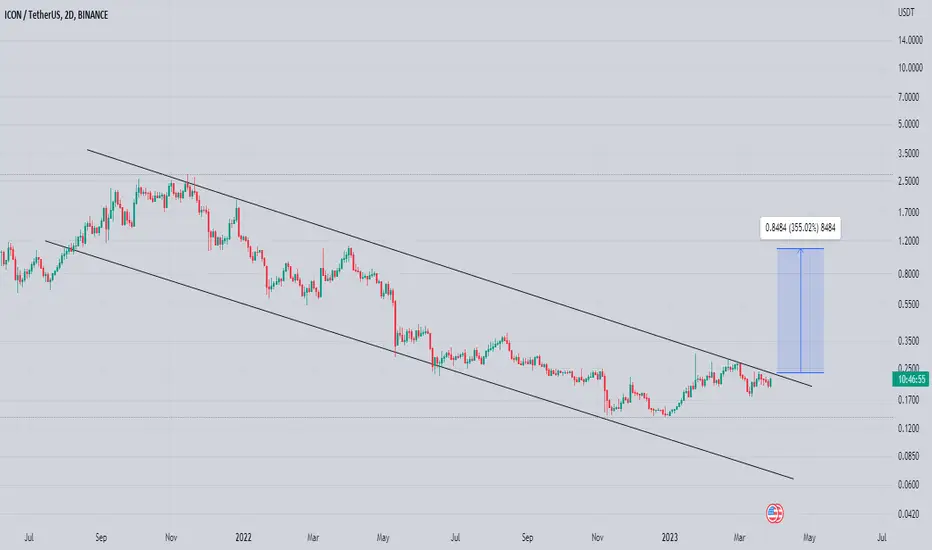
icx on verge of massive breakout seems like getting ready for massive breakout
formed descending channel and testing multi year trendline expecting breakout soon incase of successful breakout expecting bullish rally towards 1$ in coming weeks icx needs volume to take off
Beyond K-Defense to K-Coin...Hello?
Hello traders!
If you "Follow" us, you can always get new information quickly.
Please also click “Boost”.
Have a good day.
-------------------------------------
(ICXUSDT chart)
It seems that the coin market in our country (Republic of Korea) is particularly prone to fraud.
I don't think there is anyone who hasn't suffered damage at least once because of this.
I, too, am one of those who have suffered damage.
I believe that ICX is the coin that has survived with almost no noise in this market environment.
(1M charts)
The key is whether the price can be maintained by rising in the 0.1796-0.2908 range or higher.
(1W chart)
The key is whether it can receive support in the 0.1602-0.1953 range and rise above 0.2609.
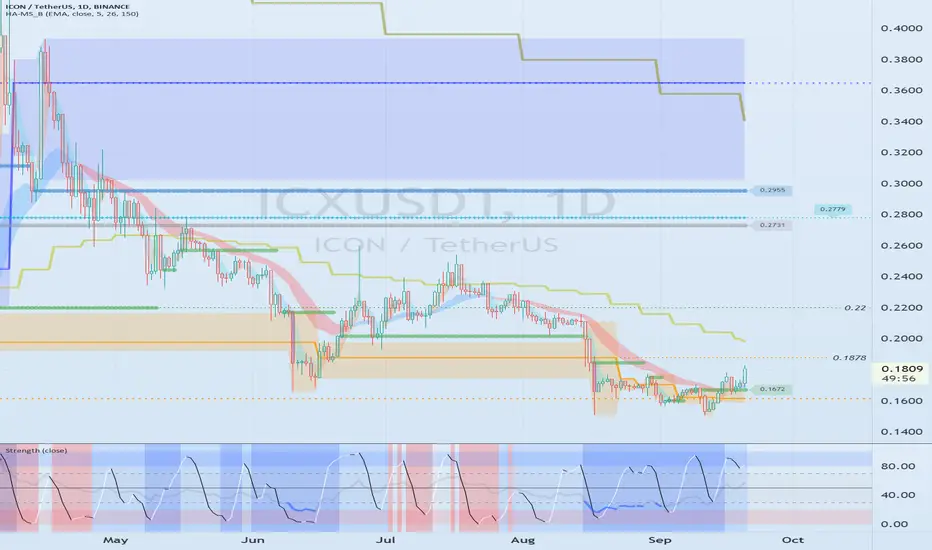
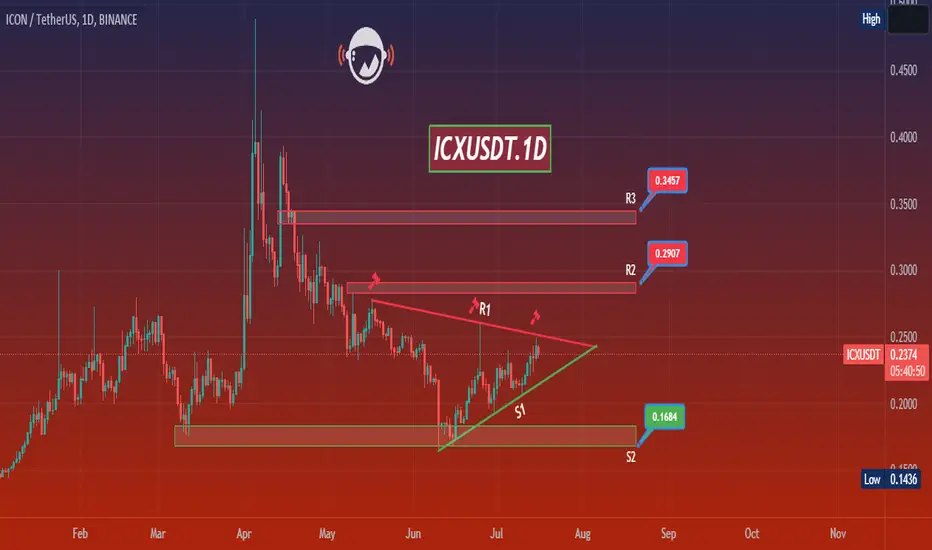
(1D chart)
The key is whether the price can be maintained by rising above 0.1878.
If that happens, it is expected to lead to a move to rise above 0.2731-0.2779.
However, we need to check whether it can exceed the 0.22 range.
--------------------------------------------------
- The big picture
The full-fledged upward trend is expected to begin when the price rises above 29K.
This is the section expected to be touched in the next bull market, 81K-95K.
-------------------------------------------------- -------------------------------------------
** All explanations are for reference only and do not guarantee profit or loss in investment.
** Trading volume is displayed as a candle body based on 10EMA.
How to display (in order from darkest to darkest)
More than 3 times the trading volume of 10EMA > 2.5 times > 2.0 times > 1.25 times > Trading volume below 10EMA
** Even if you know other people’s know-how, it takes a considerable amount of time to make it your own.
** This chart was created using my know-how.
---------------------------------
ICX SHORT SETUPHi, dear traders. how are you ? Today we have a viewpoint to SELL/SHORT the ICX symbol.
For risk management, please don't forget stop loss and capital management
When we reach the first target, save some profit and then change the stop to entry
Comment if you have any questions
Thank You

ICXUSDTHello Crypto Lovers, This is a 1D frame analysis for ICXUSDT As we can see, the price has come back to its resistance line and we can consider two scenarios. Scenario one: it is possible that the price will not be able to settle above the first resistance line and we should consider a pullback. Scenario two: if the price is able to settle above the first resistance line, it can move towards the resistance zones. If it is able to break and settle above the resistance line, those who do not want to take more Warning: This is just a suggestion and we do not guarantee profits. We advise you to analyze the chart before opening any positions. Take care
icx did 20%As mentioned in previous ICX chart idea that you can go Long on breakout. And now it did 20% after breakout and 12% profit after retest

LTO - very good time to buydon't sell under 0.20$
weekly very undersold... from this time on I am just buying crypto, not selling and trading anymore... gonna wait for 2024... even if it falls under 0.03 I am just gonna DCA into it

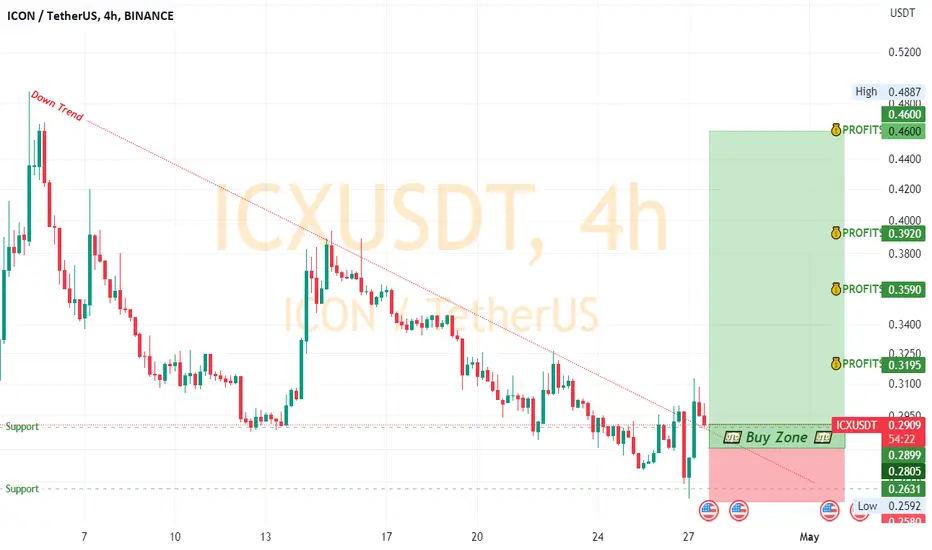
ICX ANALYSIS (4H)Hi, dear traders. how are you ? Today we have a viewpoint to BUY/LONG the ICX symbol.
For risk management, please don't forget stop loss and capital management
When we reach the first target, save some profit and then change the stop to entry
Comment if you have any questions
Thank You
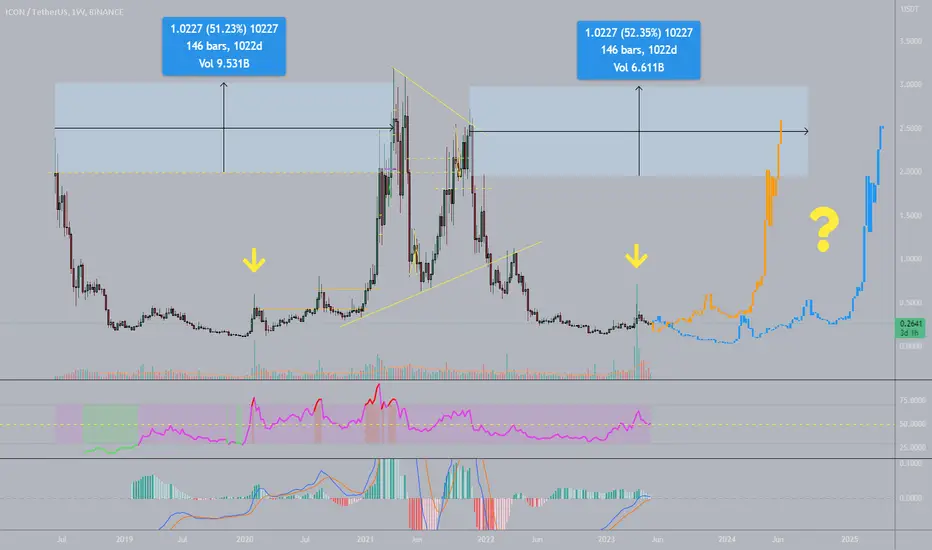
ICX: is it still alive?I've stopped to follow ICX but today I ended up on a DEX where years ago I moved a small bag of them I own, so I went back to check the chart. I know ICX blockchain is used in Korea (for ID cards or something like that) but I really have no idea if there are chances for another run. Anyone knows something?
Assuming history will repeat (I'm not a big fan of this theory but it's the only think I can suppose right now) I foresee two options:
1) orange forecast: based using the highest volume on the weekly as a pivot for the upcoming rise of price
2) blue forecase: based on time from last peak and ruling out the big dump between the two weekly peaks
If scenario 1 is right we should test ATH in June 2024 while if the correct scenario is the number 2 then 2024 will see an uprise of prices but it should take 2025 to get to past ATH and probably 2026 for new highs.
I tend to think that scenario number 2 is the more likely assuming ICX is not a dead coin.
If anyone of you is informed on this coin please share your knowledge.
Thanks
ICX ANALYSIS (4H)Hi, dear traders. how are you ? Today we have a viewpoint to BUY/LONG the ICX symbol.
For risk management, please don't forget stop loss and capital management
When we reach the first target, save some profit and then change the stop to entry
Comment if you have any questions
Thank You

ICON (ICX) formed bullish Gartley for upto 124% massive pumpHi dear friends, hope you are well and welcome to the new trade setup of ICON (ICX) coin with US Dollar pair.
Recently we caught almost 33% pump of ICX as below:
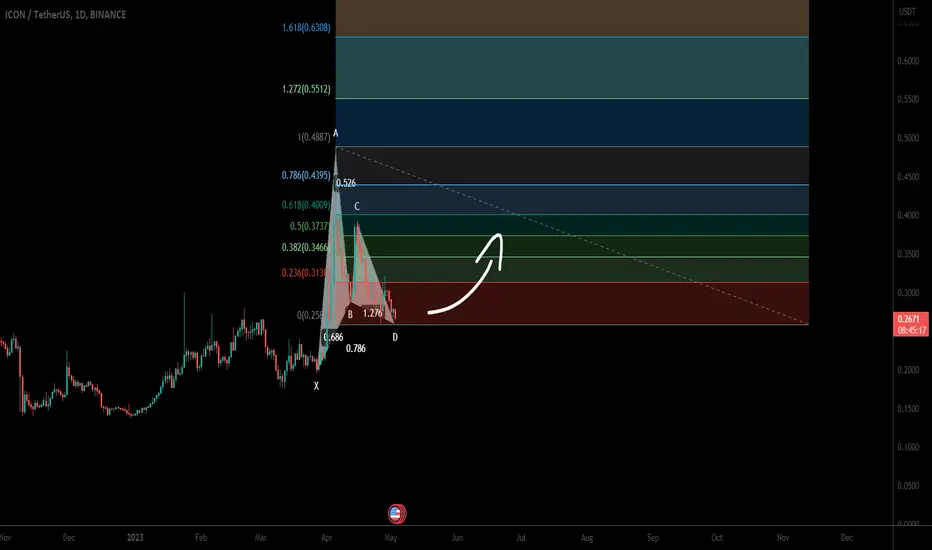
Now on a daily time frame, ICX has almost formed another bullish Gartley for the next price reversal.
Note: Above idea is for educational purpose only. It is advised to diversify and strictly follow the stop loss, and don't get stuck with trade
ICXUSDTICXUSDT
Volume 24h - 24-04-2023 IS : HKEX:80 ,758,196 - 330.01%
Rested on the support
Retest the trend now
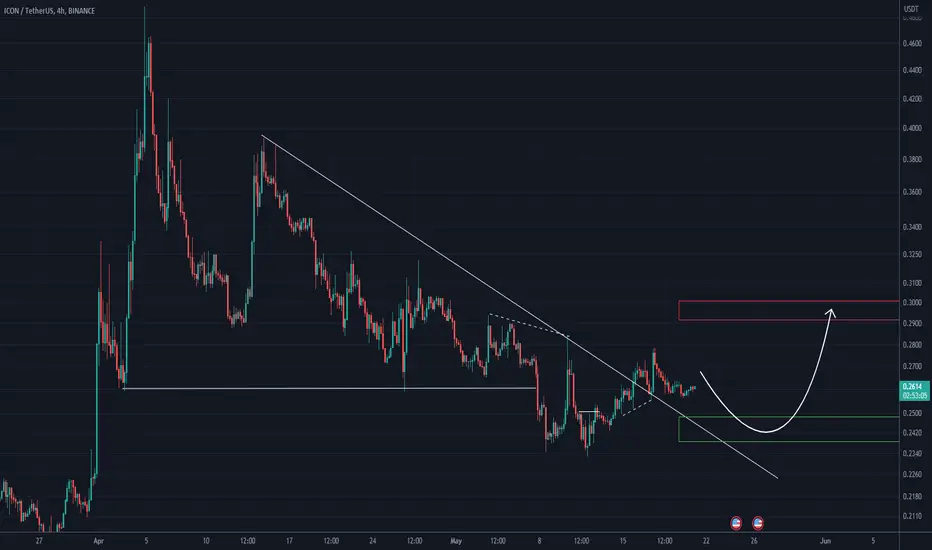
Icx Getting ready For another bullish Impulse Icx Getting ready for Another bullish impulse Formed Falling Wedge In h4 Timeframe Incase IOf breakout expecting Another 45 to 50% Bullish Wave
Icx Coin Analysis
Getting Ready For Another Breakout Incase Of Breakout Expecting 50 - 55% Bullish Impulse Keep Eyes On Icx For breakout
ICX CAN GO UPPERHi, dear traders. how are you ? Today we have a viewpoint to BUY/LONG the ICX symbol.
For risk management, please don't forget stop loss and capital management
When we reach the first target, save some profit and then change the stop to entry
Comment if you have any questions
Thank You

Today we review ICX. Will it reach the Fibonacci level of 0.618?Hello everyone! Today let's take a look at the cryptocurrency ICON.
At the beginning of April, the asset had a rapid growth, resulting in a 130% increase in price, breaking the strong Fibonacci level of 0.236 and further 0.382. However, the asset failed to consolidate above the latter and began to correct.
Currently, the asset is approaching the Fibonacci level of 0.238, where the uptrend line is also located.
Therefore, it is possible to look for an entry point to a position in the range of $0.28-0.29.
The targets are the next Fibonacci levels at $0.46-$0.97 (+57%, +230% profit).
This is not a financial recommendation, and everything you do is done at your own risk.


CON (ICX) formed bullish Gartley for upto 73.50% rallyHi dear friends, hope you are well and welcome to the new trade setup of ICON (ICX) coin with US Dollar pair
Previously I shared a long-term trade setup for ICX, which is still in play as below:
Now on a 4-hr time frame, ICX has formed a bullish Gartley move for another price reversal.
Note: Above idea is for educational purpose only. It is advised to diversify and strictly follow the stop loss, and don't get stuck with trade
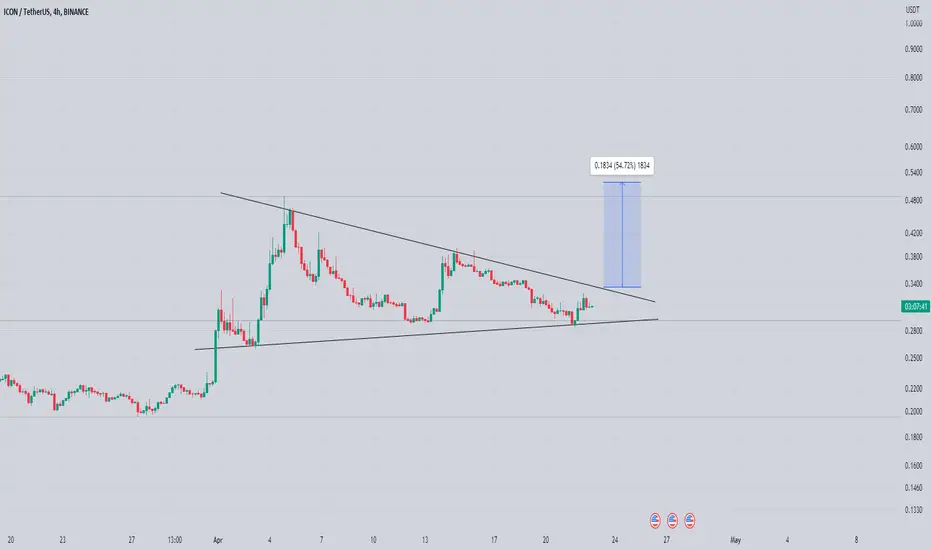
Icx Coin Analysis Seems Like Icx Has already bottomed Out
Formed descending channel & Building Up for Massive Breakout Incase Of successful breakout expecting 280 to 300% bullish Move
ICON ICX price rising and knows no grief) Who is pushing it up?The fact that the trading volumes of the ICONUSDT pair have grown significantly since the beginning of the year clearly indicates the increased interest of "big money" in the project.
What's going on there? Share your thoughts in the comments.
In our opinion, the main price intrigue on the ICONUSDT chart will take place in the region of $0.42-0.43
In this price zone, it will be clearly visible whether buyers will be able to break through and continue the growth of the ICON price above $0.60 in a short time.
Or is it possible that a correction to $0.28 is needed to continue the "healthy price growth" and only then will the price rise to $0.60 and higher
_____________________
Did you like our analysis? Leave a comment, like, and follow to get more

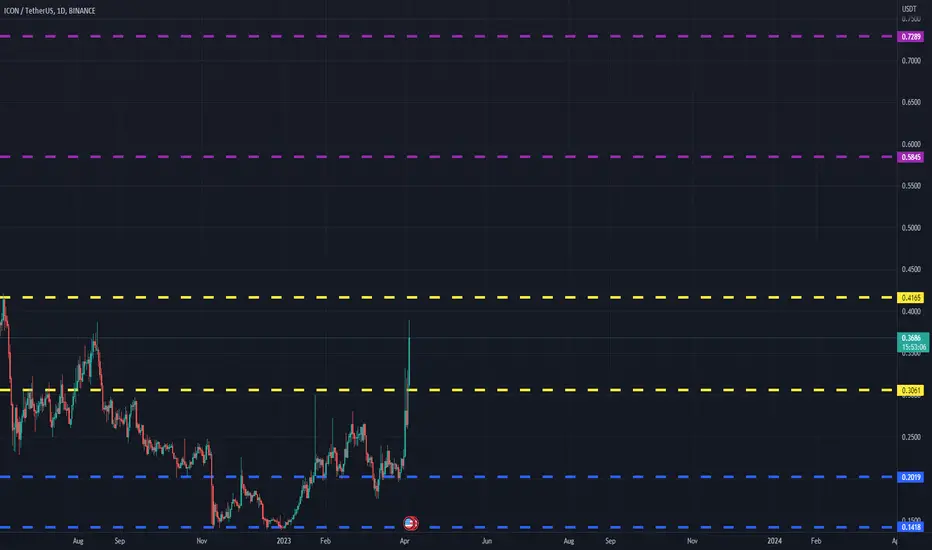
ICXUSDT(ICON) Daily tf Range Updated till 04-04-23ICXUSDT(ICON) Daily timeframe range. it had a clean break through #0.3061 now a free space till #0.4165 and already close to that. the daily candle is as healthy as it gets. a little bit of more can help it to cross #0.4165 which can lead it too upper levels.