IDBINANCE:IDUSDT
#ID/ USDT
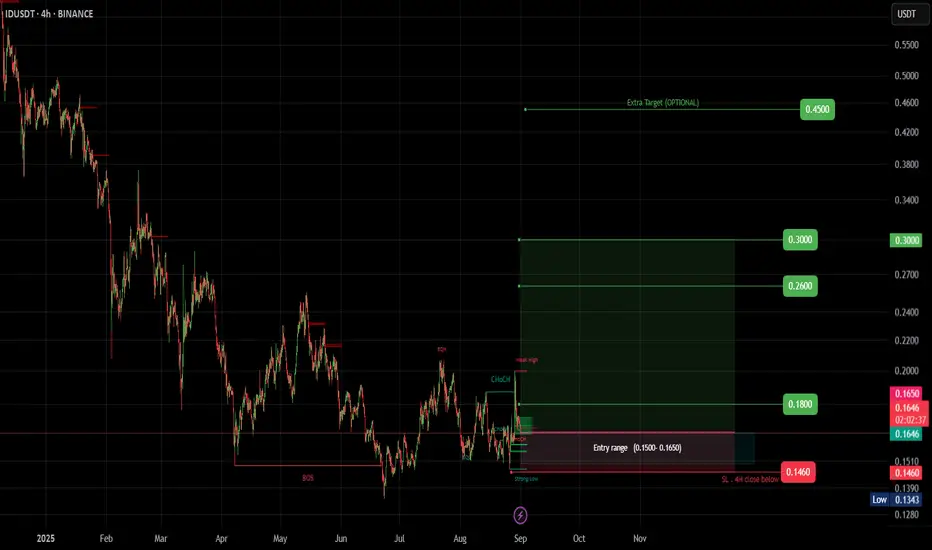
Entry range (0.1500- 0.1650)
SL 4H close below 0.1460
T1 0.18
T2 0.26
T3 0.30
Extra Target is optional 0.45
_______________________________________________________
Golden Advices.
********************
* collect the coin slowly in the entry range.
* Please calculate your losses before the entry.
* Do not enter any trade you find it not suitable for you.
* No FOMO - No Rush , it is a long journey.
IDUSDT
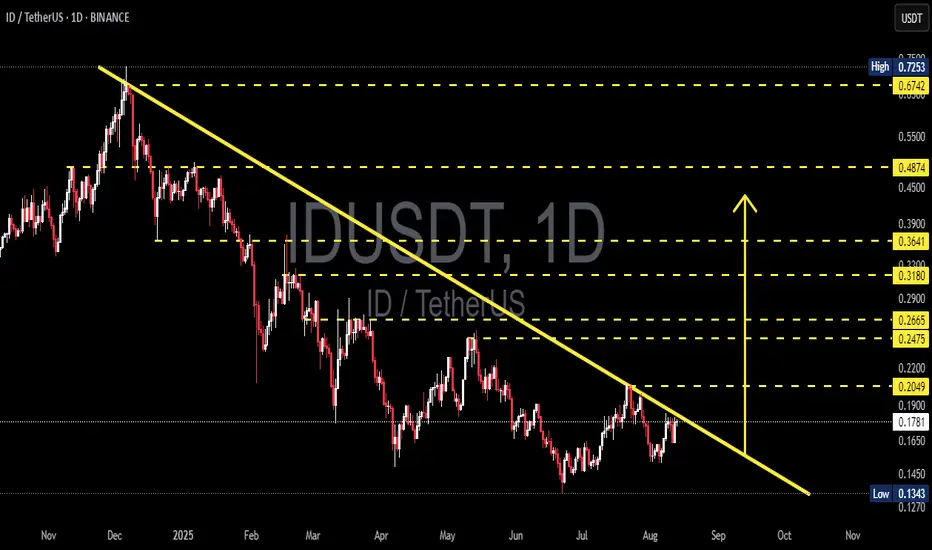
ID/USDT — Final Battle at the Multi-Month Downtrend Line!📌 Market Structure Overview
Since peaking in late 2024, ID/USDT has been trapped under a relentless multi-month downtrend line lasting almost 10 months. Every rally attempt has been shut down at this descending wall.
Now, the market is at a critical inflection point — price is pressing right against the trendline and sitting in the decision zone between 0.190–0.205.
A breakout here would not only be a technical victory for the bulls but could also trigger a shift in market psychology from seller dominance to buyer control.
---
📊 Key Levels to Watch
Major Resistances: 0.2049 → 0.2475 → 0.2665 → 0.3180 → 0.3641 → 0.4874 → 0.6742
Supports: 0.177–0.180 → 0.165 → 0.134–0.145 (major demand zone)
---
📐 Pattern & Sentiment Analysis
The dominant structure is a classic Descending Trendline Resistance, showing consistent lower highs under seller pressure.
However, there’s an early sign of sentiment shift — a higher low compared to the July bottom, suggesting that buyers are stepping in earlier and absorbing supply.
If price can close a daily candle above the trendline and 0.2049, we could see the start of a trend reversal rally toward higher resistance levels.
---
🚀 Bullish Scenario
1. Trigger: Daily close above the trendline + 0.2049.
2. Confirmation: Retest of 0.19–0.205 holds as new support.
3. Upside Targets:
Initial: 0.2475
Mid-term: 0.2665 → 0.3180
Extended: 0.3641 (psychological zone)
4. Invalidation: Closing back below 0.190 or losing 0.177–0.180.
---
📉 Bearish Scenario
1. Trigger: Sharp rejection from the trendline/0.19–0.205 zone.
2. Downside Targets:
First: 0.177–0.180
Next: 0.165
Extreme: 0.134–0.145 (historical low)
3. Invalidation: Sustained breakout above 0.205 with strong volume.
---
⚖️ Perspective & Risk Management
This is a “make or break” moment for ID/USDT.
Don’t rely solely on intraday spikes — wait for a confirmed daily close to avoid fakeouts.
Use the above S/R levels as tiered take-profit zones and for placing protective stops.
#IDUSDT #ID #Crypto #PriceAction #TechnicalAnalysis #DowntrendBreak #Breakout #SupportResistance #CryptoTrading
$PNUT/USDT Breakout Trade Setup$PNUT / USDT - Breakout Trade Setup.
Entry: $0.2963 - $0.3002
Stop Loss: $0.2682
Targets: $0.3603 / $0.4305 / $0.4891
Breakout & retest of descending trendline
60 %+ upside potential
DYOR | NFA

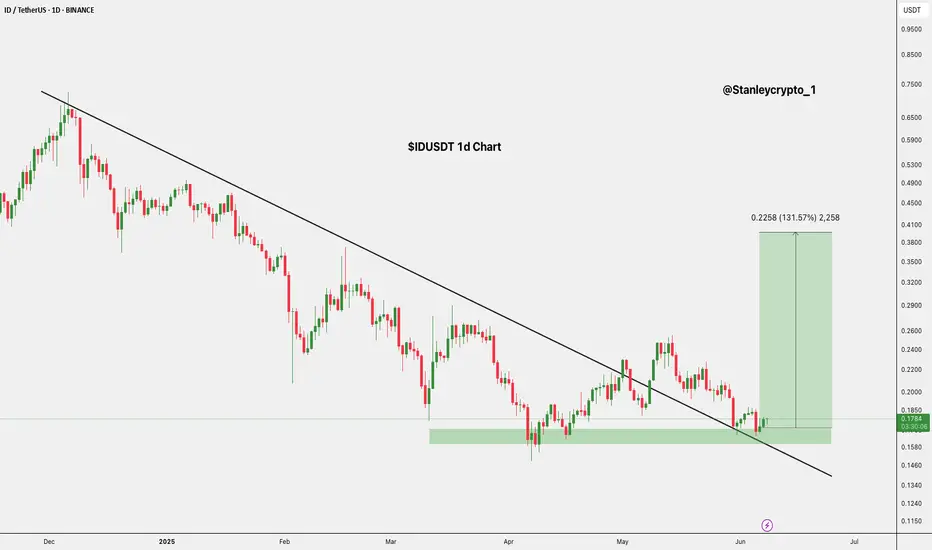
$IDUSDT 1D chart The BINANCE:IDUSDT 1D chart shows a potential breakout from its long downtrend.
Price recently bounced off a strong demand zone at $0.1785 and is now testing above the descending trendline.
If momentum holds, a move toward the $0.4004 target +131% is possible.
Watch for strong volume confirmation to validate the breakout.
DYRO, NFA
IDUSDT Analysis ID ~ 4D Analysis
#ID Buy on retesting this buy zone or buy on successful breakout of the resistance line of this pattern. With a short term target of at least 10%+.

SCRTUSDT UPDATE
SCRT Technical Setup
Pattern: Falling Wedge Breakout
Current Price: $0.2453
Target Price: $0.59
Target % Gain: 160.55%
Technical Analysis: SCRT has broken out of a falling wedge on the 1D chart, indicating a bullish reversal. The breakout is confirmed with strong green candles and volume build-up.
Time Frame: 1D
Risk Management Tip: Always use proper risk management.

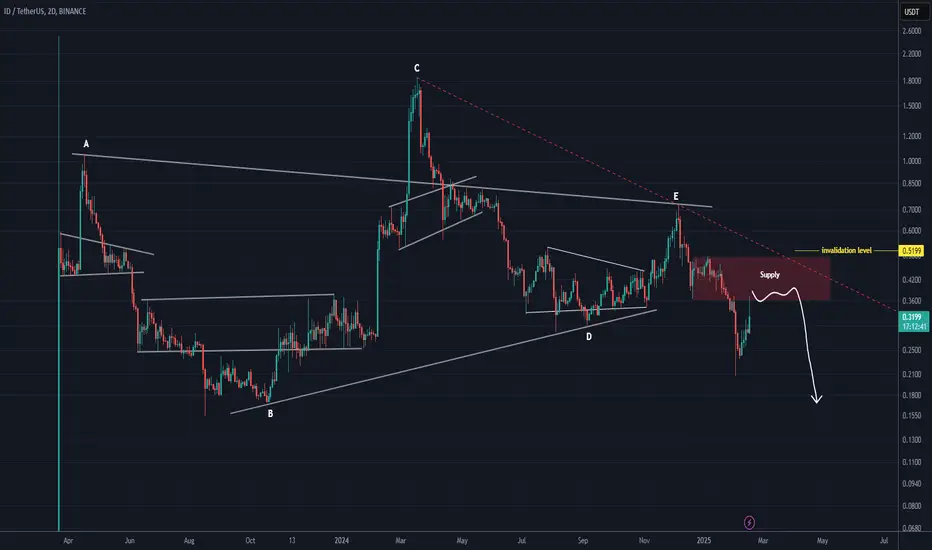
ID is bearish for the mid-term (2D)Before anything, pay attention to the timeframe—it's a 2-day timeframe, so it will take time.
Given that a large-degree bearish triangle has completed, this coin may remain bearish in the mid-term. The red zone is where the next major bearish wave could start.
A daily candle closing above the invalidation level will invalidate this analysis.
For risk management, please don't forget stop loss and capital management
Comment if you have any questions
Thank You
DEGOUSDT UPDATEDEGO/USDT Technical Setup
Pattern: Falling Wedge Breakout
Current Price: $1.808
Target Price: $3.70
Target % Gain: 115.05%
Technical Analysis: DEGO broke out of a falling wedge on the 1D chart, showing bullish momentum with a clean candle close above resistance and follow-through volume. Chart suggests potential continuation toward the measured target.
Time Frame: 1D
Risk Management Tip: Always use proper risk management.

STRAXUSDT UPDATESTRAXUSDT is a cryptocurrency trading at $0.04440, with a target price of $0.07000. This represents a potential gain of over 80%. The technical pattern observed is a Bullish Falling Wedge, indicating a possible trend reversal. This pattern suggests that the downward trend may be coming to an end. A breakout from the wedge could lead to a significant upward movement in price. The Bullish Falling Wedge is a positive indicator, signaling a potential price surge. Investors are showing optimism about STRAXUSDT's future performance. The current price may present a buying opportunity. Reaching the target price would result in substantial returns for investors. STRAXUSDT is positioned for a potential breakout and significant gains.

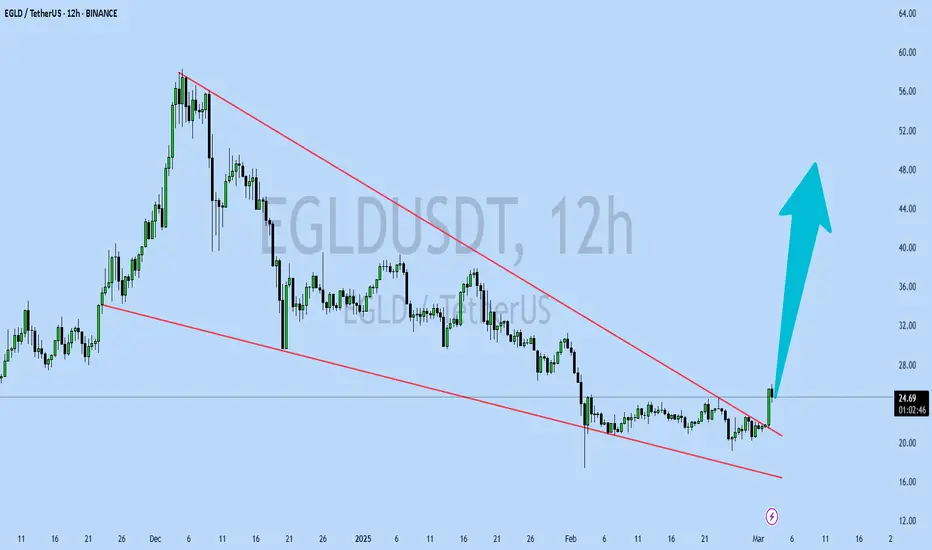
EGLDUSDT UPDATEEGLDUSDT is a cryptocurrency trading at $24.65. Its target price is $48.00, indicating a potential 90%+ gain. The pattern is a Bullish Falling Wedge, a reversal pattern signaling a trend change. This pattern suggests the downward trend may be ending. A breakout from the wedge could lead to a strong upward move. The Bullish Falling Wedge is a positive signal, indicating a potential price surge. Investors are optimistic about EGLDUSDT's future performance. The current price may be a buying opportunity. Reaching the target price would result in significant returns. EGLDUSDT is poised for a potential breakout and substantial gains.
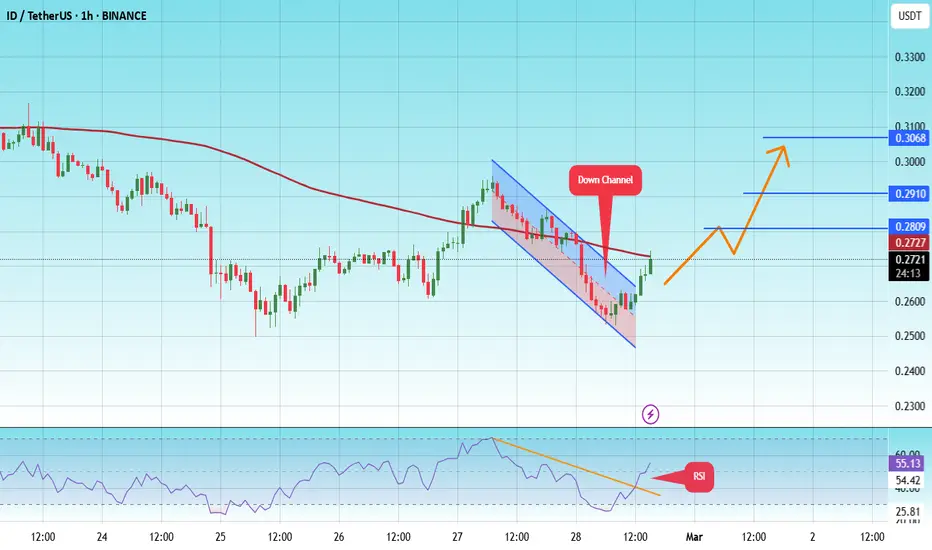
#ID/USDT#ID
The price is moving in a descending channel on the 1-hour frame and is expected to continue upwards
We have a trend to stabilize above the moving average 100 again
We have a descending trend on the RSI indicator that supports the rise by breaking it upwards
We have a support area at the lower limit of the channel at a price of 0.2516
Entry price 0.2720
First target 0.2810
Second target 0.2895
Third target 0.3068
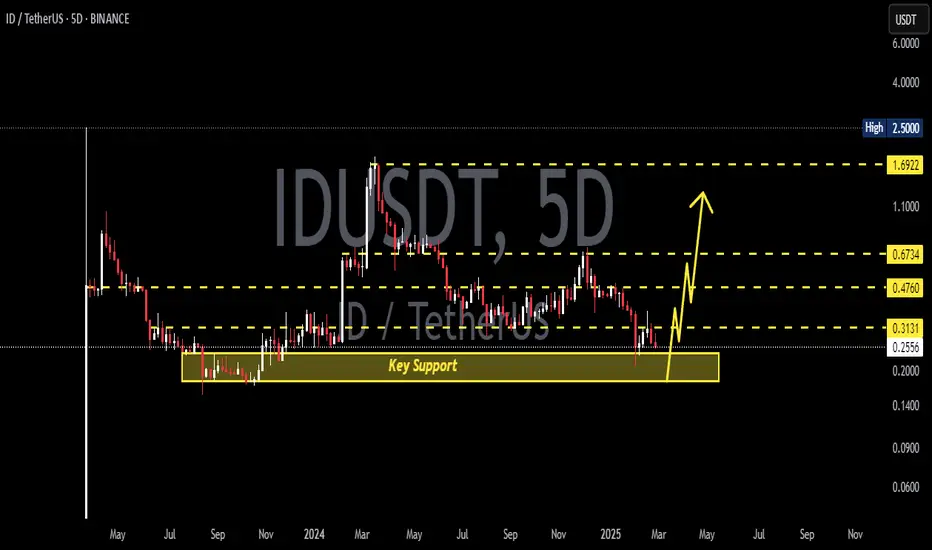
IDUSDT 5DID ~ 5D Analysis
#ID Buy gradually from here with a minimum target of 20%+
The reason, this is the lowest support for now.
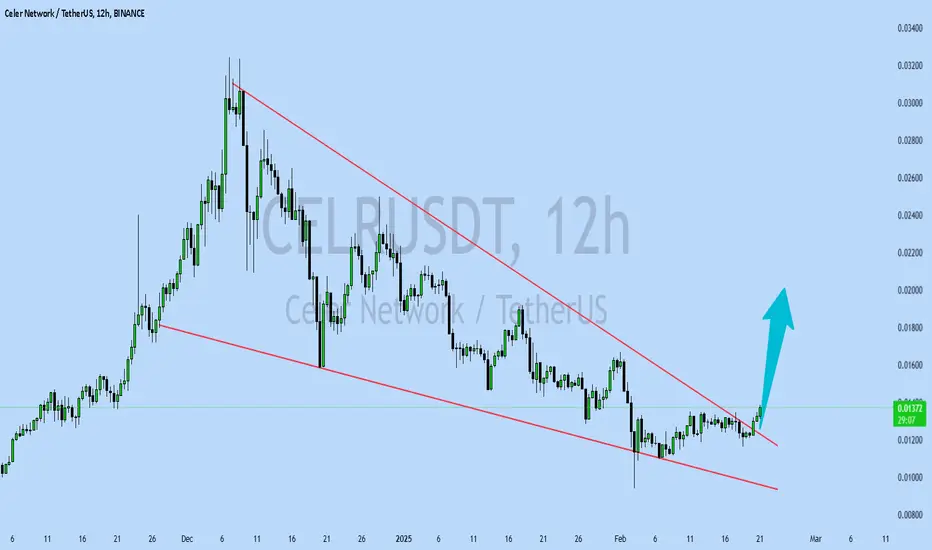
CELRUSDT UPDATECELRUSDT is a cryptocurrency trading at $0.01372. Its target price is $0.02000, indicating a potential 60%+ gain. The pattern is a Bullish Falling Wedge, a reversal pattern signaling a trend change. This pattern suggests the downward trend may be ending. A breakout from the wedge could lead to a strong upward move. The Bullish Falling Wedge is a positive signal, indicating a potential price surge. Investors are optimistic about CELRUSDT's future performance. The current price may be a buying opportunity. Reaching the target price would result in significant returns. CELRUSDT is poised for a potential breakout and substantial gains.
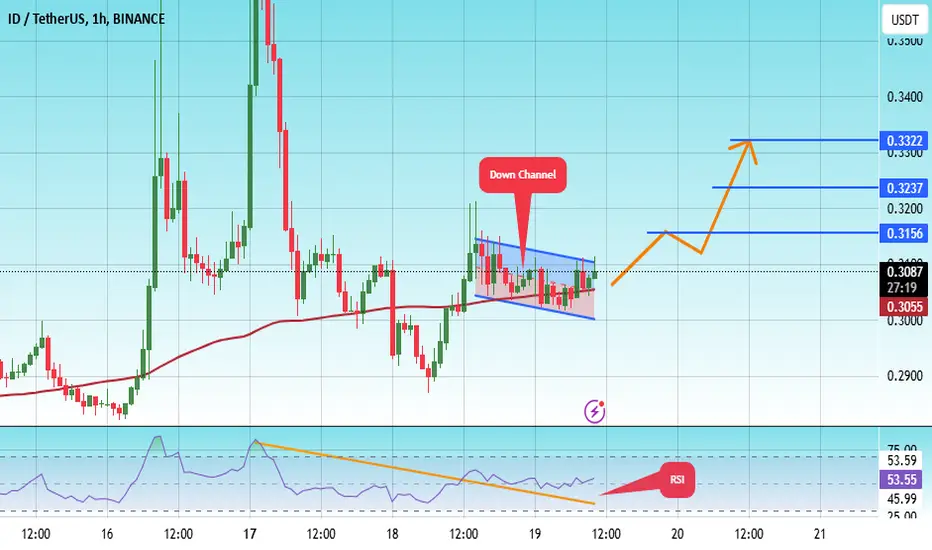
#ID/USDT#ID
The price is moving in a descending channel on the 1-hour frame and is adhering to it well and is heading to break it upwards strongly and retest it
We have a bounce from the lower limit of the descending channel, this support is at a price of 0.3000
We have a downtrend on the RSI indicator that is about to break and retest, which supports the rise
We have a trend to stabilize above the moving average 100
Entry price 0.3322
First target 0.3156
Second target 0.3237
Third target 0.3322
ELFUSDT UPDATEELFUSDT is a cryptocurrency trading at $0.3090. Its target price is $0.5000, indicating a potential 60%+ gain. The pattern is a Bullish Falling Wedge, a reversal pattern signaling a trend change. This pattern suggests the downward trend may be ending. A breakout from the wedge could lead to a strong upward move. The Bullish Falling Wedge is a positive signal, indicating a potential price surge. Investors are optimistic about ELFUSDT's future performance. The current price may be a buying opportunity. Reaching the target price would result in significant returns. ELFUSDT is poised for a potential breakout and substantial gains.

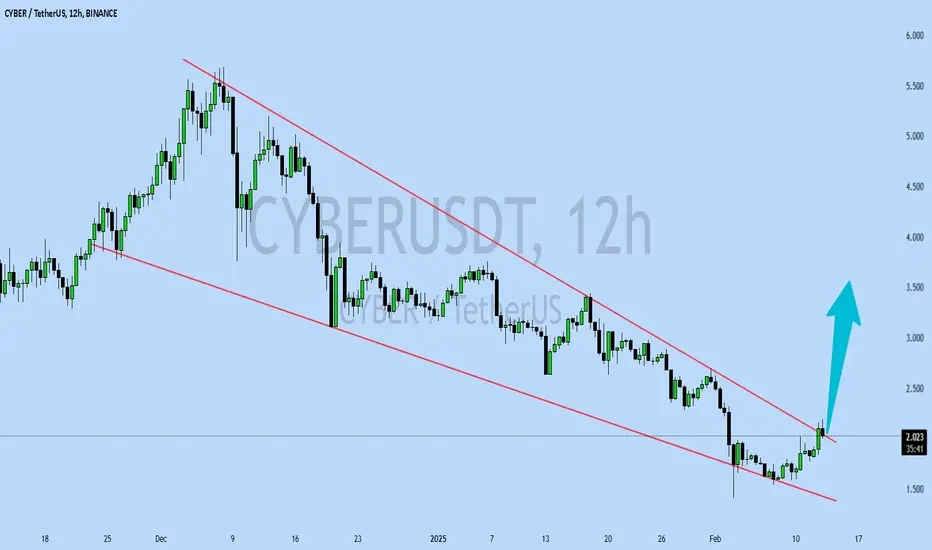
CYBERUSDT UPDATECYBERUSDT is a cryptocurrency trading at $2.026. Its target price is $3.500, indicating a potential 70%+ gain. The pattern is a Bullish Falling Wedge, a reversal pattern signaling a trend change. This pattern suggests the downward trend may be ending. A breakout from the wedge could lead to a strong upward move. The Bullish Falling Wedge is a positive signal, indicating a potential price surge. Investors are optimistic about CYBERUSDT's future performance. The current price may be a buying opportunity. Reaching the target price would result in significant returns. CYBERUSDT is poised for a potential breakout and substantial gains.
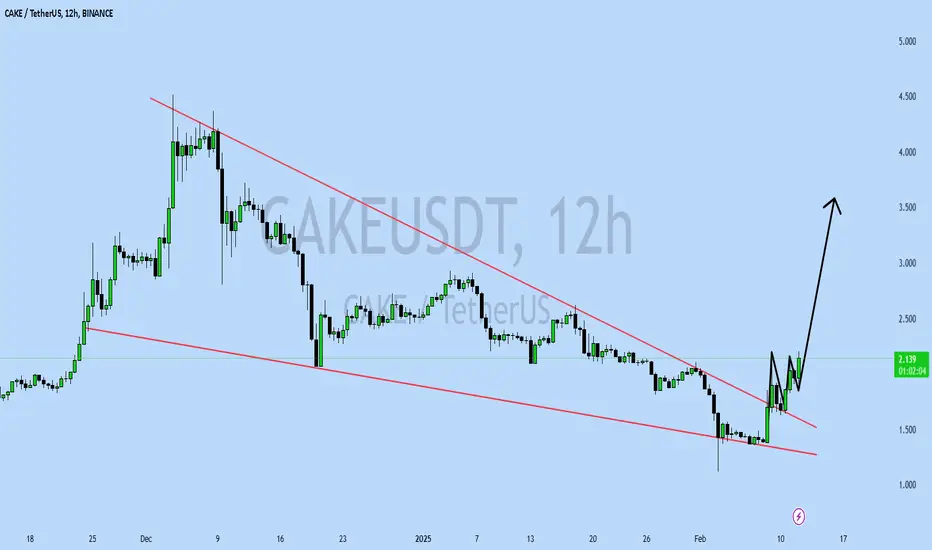
CAKEUSDT UPDATECAKEUSDT is a cryptocurrency trading at $21.85. Its target price is $3.500 is likely incorrect, as it would be a significant price drop. However, assuming the target price is actually higher, a more plausible target would be around $39.41, indicating a potential 80%+ gain. The pattern is a Bullish Falling Wedge, a reversal pattern signaling a trend change. This pattern suggests the downward trend may be ending. A breakout from the wedge could lead to a strong upward move. The Bullish Falling Wedge is a positive signal, indicating a potential price surge. Investors are optimistic about CAKEUSDT's future performance. The current price may be a buying opportunity. Reaching the target price would result in significant returns.
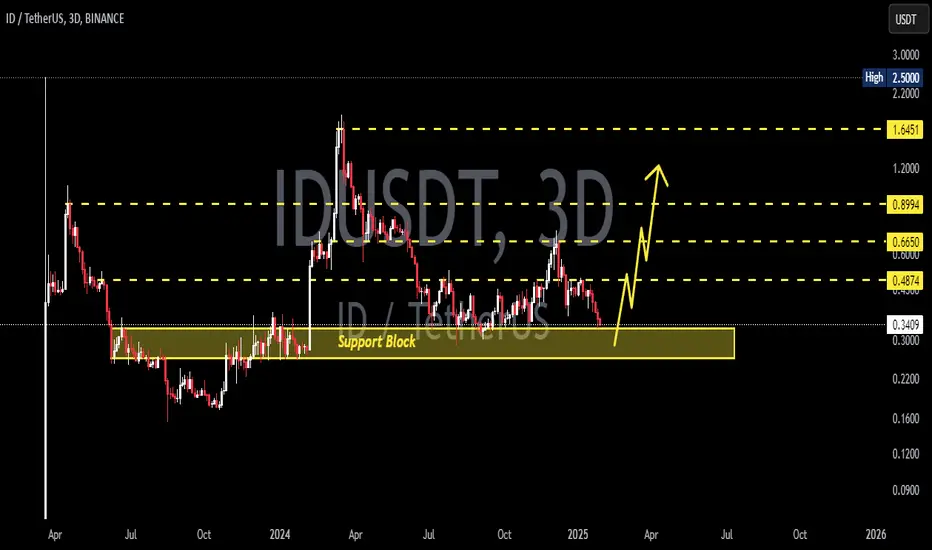
IDUSDT 3DID ~ 3D Analysis
#ID In the 3D time frame, this is a very good support for now, Buy from here if you still have a Conviction on this coin with a minimum target of 20%+
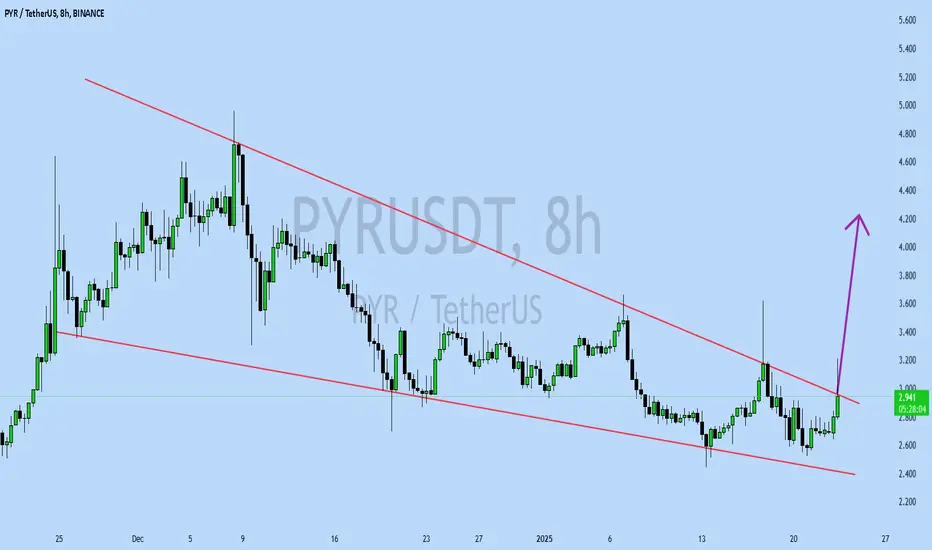
PYRUSDT UPDATEPYRUSDT is a cryptocurrency trading at $2.929. Its target price is $4.200, indicating a potential 45%+ gain. The pattern is a Bullish Falling Wedge, a reversal pattern signaling a trend change. This pattern suggests the downward trend may be ending. A breakout from the wedge could lead to a strong upward move. The Bullish Falling Wedge is a positive signal, indicating a potential price surge. Investors are optimistic about PYRUSDT's future performance. The current price may be a buying opportunity. Reaching the target price would result in significant returns. PYRUSDT is poised for a potential breakout and substantial gains.
VTHOUSDT UPDATEVTHOUSDT is a cryptocurrency trading at $0.002696. Its target price is $0.003800, indicating a potential 45%+ gain. The pattern is a Bullish Falling Wedge, a reversal pattern signaling a trend change. This pattern suggests the downward trend may be ending. A breakout from the wedge could lead to a strong upward move. The Bullish Falling Wedge is a positive signal, indicating a potential price surge. Investors are optimistic about VTHOUSDT's future performance. The current price may be a buying opportunity. Reaching the target price would result in significant returns. VTHOUSDT is poised for a potential breakout and substantial gains.

HBARUSDT UPDATEALGOUSDT is a cryptocurrency with a current price of $0.3900. Its target price is $0.5500, indicating a potential 50%+ gain. The pattern is a Bullish Pennant, a continuation pattern signaling a potential breakout. This pattern suggests a brief consolidation before a strong upward move. The Bullish Pennant is a positive signal, indicating a potential price surge. Investors are optimistic about ALGOUSDT's future performance. The current price may be a buying opportunity. Reaching the target price would result in significant returns. The Bullish Pennant pattern typically leads to a strong upward move. ALGOUSDT is poised for a potential breakout.

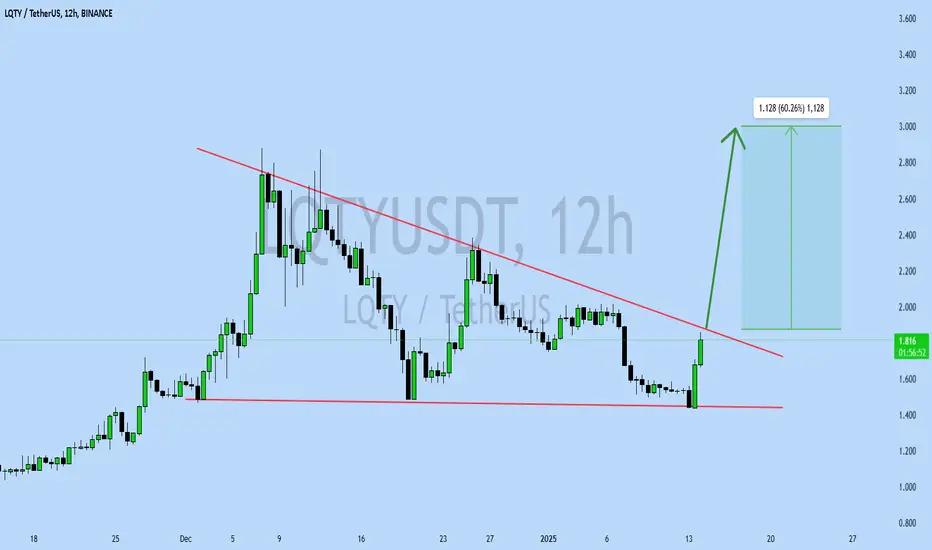
LQTYUSDT UPDATELQTYUSDT is a cryptocurrency trading at $1.830. Its target price is $3.000, indicating a potential 60%+ gain. The pattern is a Bullish Falling Wedge, a reversal pattern signaling a potential trend change. This pattern suggests that the downward trend may be ending. A breakout from the wedge could lead to a strong upward move. The Bullish Falling Wedge is a positive signal, indicating a potential price surge. Investors are optimistic about LQTYUSDT's future performance. The current price may be a buying opportunity. Reaching the target price would result in significant returns. This pattern typically leads to a strong upward move.
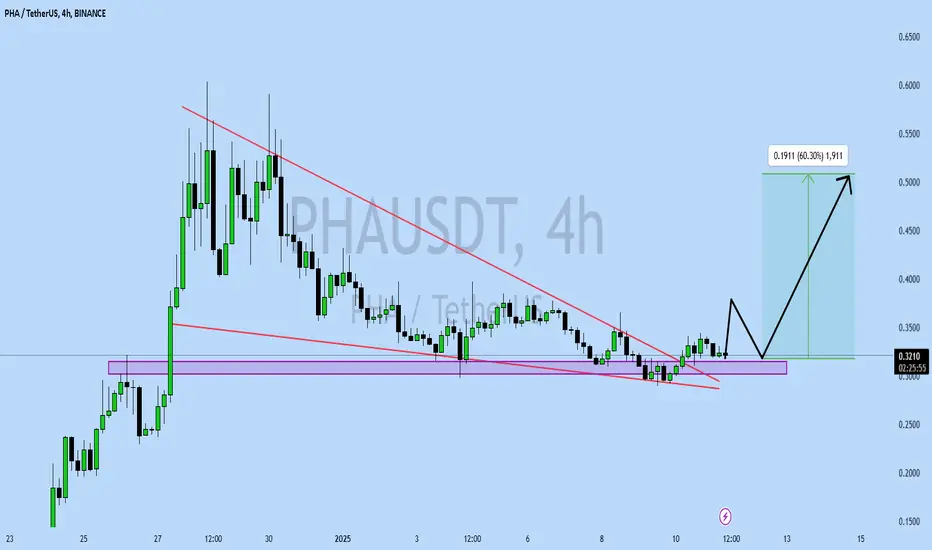
PHAUSDT UPDATEPHAUSDT is a cryptocurrency trading at $0.3209. Its target price is $0.5000, indicating a potential 50%+ gain. The pattern is a Bullish Falling Wedge, a reversal pattern signaling a potential trend change. This pattern suggests that the downward trend may be ending. A breakout from the wedge could lead to a strong upward move. The Bullish Falling Wedge is a positive signal, indicating a potential price surge. Investors are optimistic about PHAUSDT's future performance. The current price may be a buying opportunity. Reaching the target price would result in significant returns. This pattern typically leads to a strong upward move.