ID/USDT — Final Battle at the Multi-Month Downtrend Line!📌 Market Structure Overview
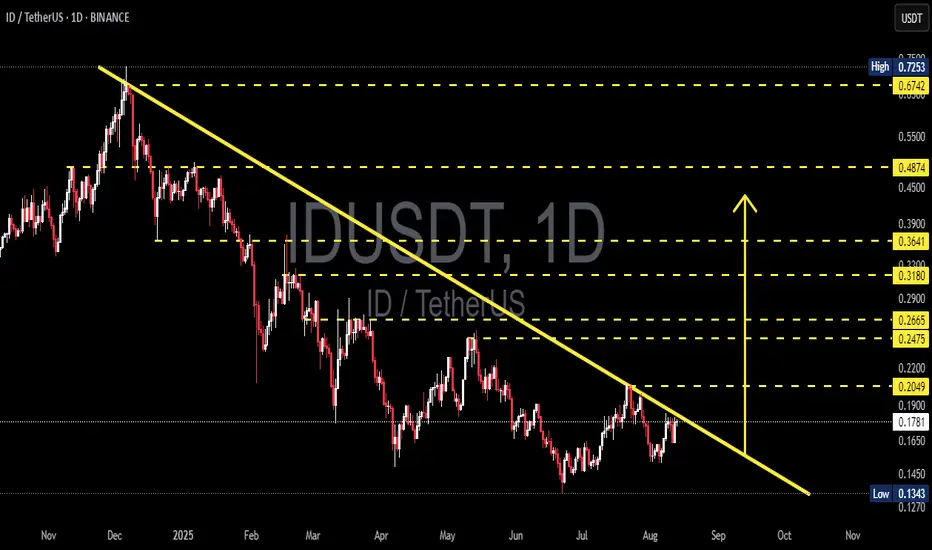
Since peaking in late 2024, ID/USDT has been trapped under a relentless multi-month downtrend line lasting almost 10 months. Every rally attempt has been shut down at this descending wall.
Now, the market is at a critical inflection point — price is pressing right against the trendline and sitting in the decision zone between 0.190–0.205.
A breakout here would not only be a technical victory for the bulls but could also trigger a shift in market psychology from seller dominance to buyer control.
---
📊 Key Levels to Watch
Major Resistances: 0.2049 → 0.2475 → 0.2665 → 0.3180 → 0.3641 → 0.4874 → 0.6742
Supports: 0.177–0.180 → 0.165 → 0.134–0.145 (major demand zone)
---
📐 Pattern & Sentiment Analysis
The dominant structure is a classic Descending Trendline Resistance, showing consistent lower highs under seller pressure.
However, there’s an early sign of sentiment shift — a higher low compared to the July bottom, suggesting that buyers are stepping in earlier and absorbing supply.
If price can close a daily candle above the trendline and 0.2049, we could see the start of a trend reversal rally toward higher resistance levels.
---
🚀 Bullish Scenario
1. Trigger: Daily close above the trendline + 0.2049.
2. Confirmation: Retest of 0.19–0.205 holds as new support.
3. Upside Targets:
Initial: 0.2475
Mid-term: 0.2665 → 0.3180
Extended: 0.3641 (psychological zone)
4. Invalidation: Closing back below 0.190 or losing 0.177–0.180.
---
📉 Bearish Scenario
1. Trigger: Sharp rejection from the trendline/0.19–0.205 zone.
2. Downside Targets:
First: 0.177–0.180
Next: 0.165
Extreme: 0.134–0.145 (historical low)
3. Invalidation: Sustained breakout above 0.205 with strong volume.
---
⚖️ Perspective & Risk Management
This is a “make or break” moment for ID/USDT.
Don’t rely solely on intraday spikes — wait for a confirmed daily close to avoid fakeouts.
Use the above S/R levels as tiered take-profit zones and for placing protective stops.
#IDUSDT #ID #Crypto #PriceAction #TechnicalAnalysis #DowntrendBreak #Breakout #SupportResistance #CryptoTrading
Idusdtsignal
IDUSDT Analysis ID ~ 4D Analysis
#ID Buy on retesting this buy zone or buy on successful breakout of the resistance line of this pattern. With a short term target of at least 10%+.

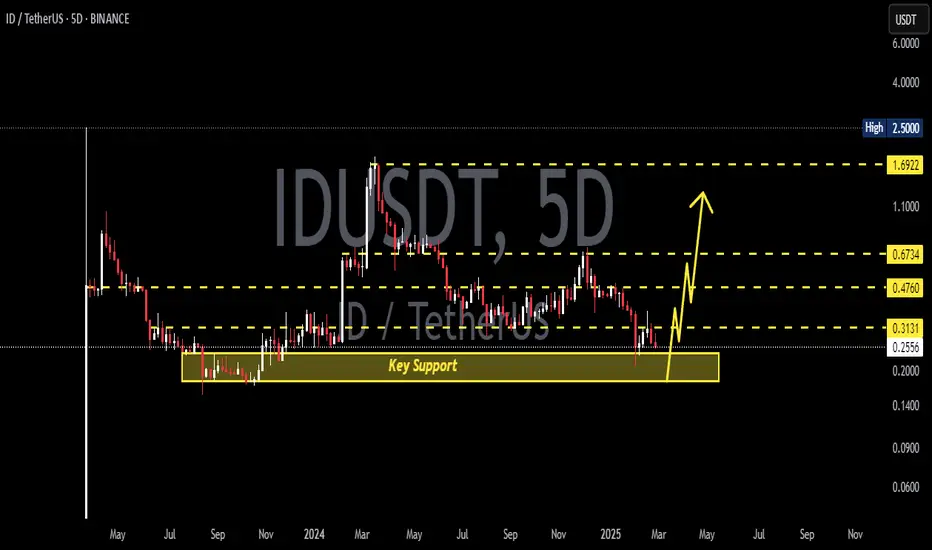
IDUSDT 5DID ~ 5D Analysis
#ID Buy gradually from here with a minimum target of 20%+
The reason, this is the lowest support for now.
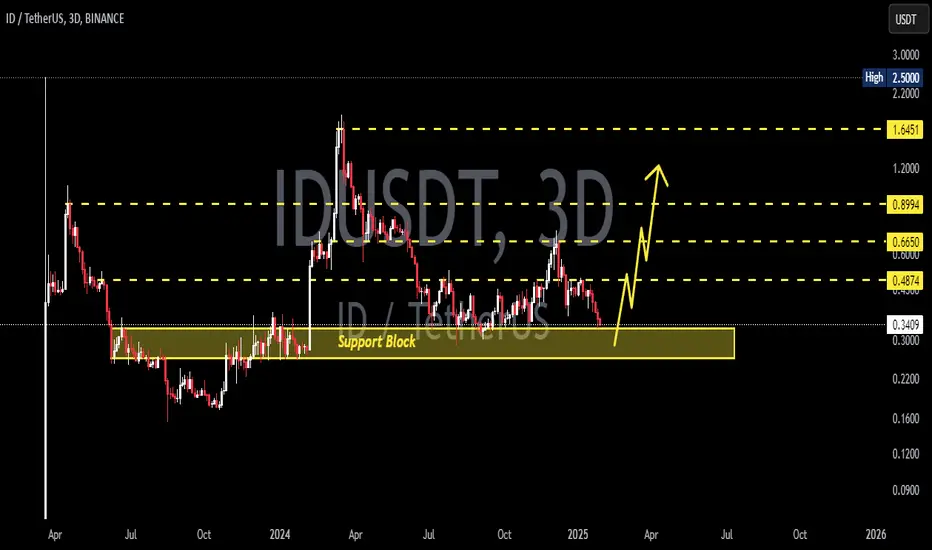
IDUSDT 3DID ~ 3D Analysis
#ID In the 3D time frame, this is a very good support for now, Buy from here if you still have a Conviction on this coin with a minimum target of 20%+
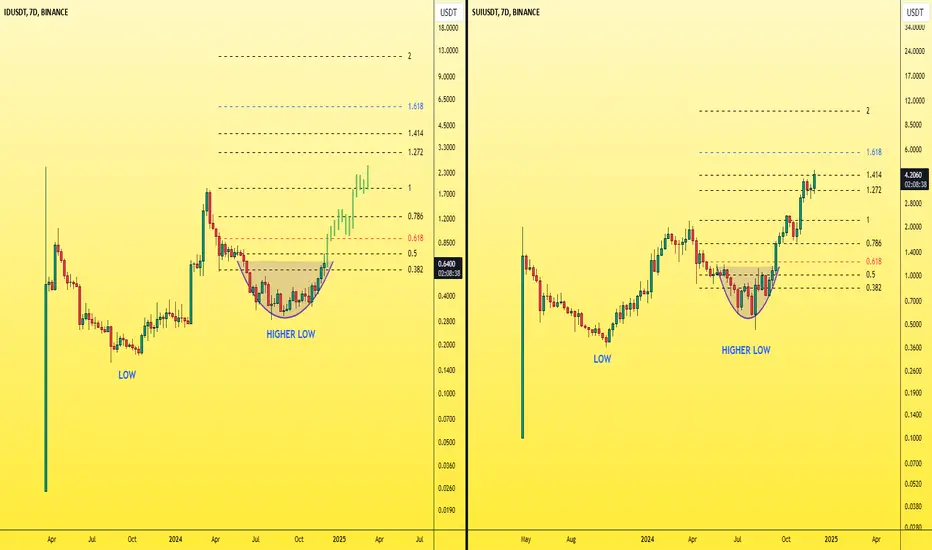
A similar behavior Between ID and SUIStructurally these charts are almost identical
- Same low and higher low
-same rounding bottom pattern
Accumulate ID while its price is low.
It will become a trend and the talk of everyone as soon as it breaks the round bottom pattern just like what happend with SUI
Best regards Ceciliones🎯
IDUSDTID ~ 5D
#ID Make gradual purchases on this support block. With a short term target of at least 20%++. We think this is a strong enough support block to hold the price.

IDUSDTID ~ 5D
#ID If you have Conviction on this coin,. Make gradual purchases on these support blocks. with a short term target of at least 20%++
IDUSDT is the most promising altcoin, bullish ? looks very good graphically.
stronger than the market.
has a structure of hanging lows.
The trend is upward.
second year of the project
ID/USDT Keep an eye on the support or demand, Indicating Bounce!💎 ID has recently encountered significant market dynamics, particularly as it lies on a support area requiring a bounce to sustain its upward movement.
💎 A successful bounce from this support could signal a continuation of the upward trend, potentially leading to a retest of the strong resistance area.
💎 However, if ID fails to bounce from the support and breaks down below it, this could indicate a bearish sign. In such a scenario, ID may lose support and continue downward, potentially reaching the demand area around $0.8 - $0.7.
💎 At the demand area, it's crucial for ID to bounce and reclaim the price above the support area to maintain the upward movement. Failure to do so could result in continued downward movement for ID.

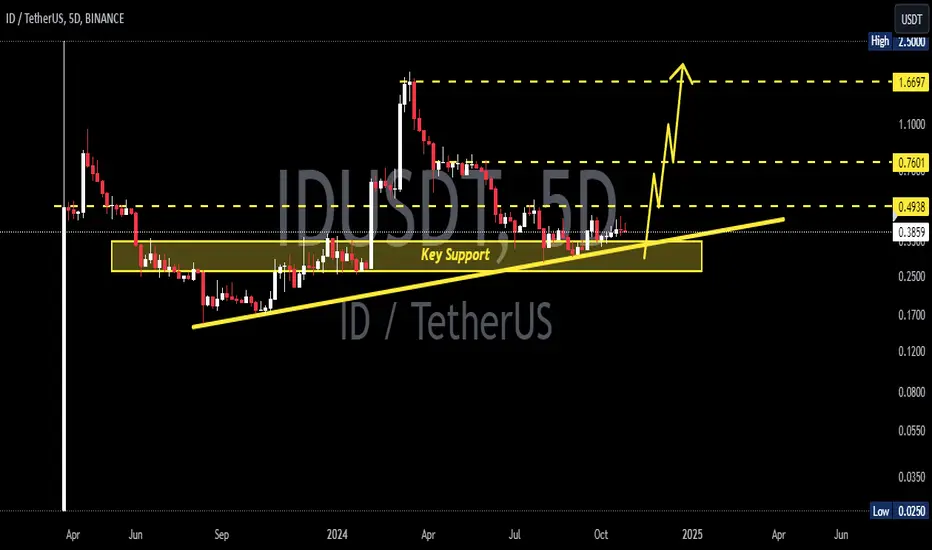
ID Still in Accumulation! 📈🚀Hello Crypto Enthusiasts! 👋
We're shining the spotlight on (ID) that's currently playing it cool in the accumulation zone.
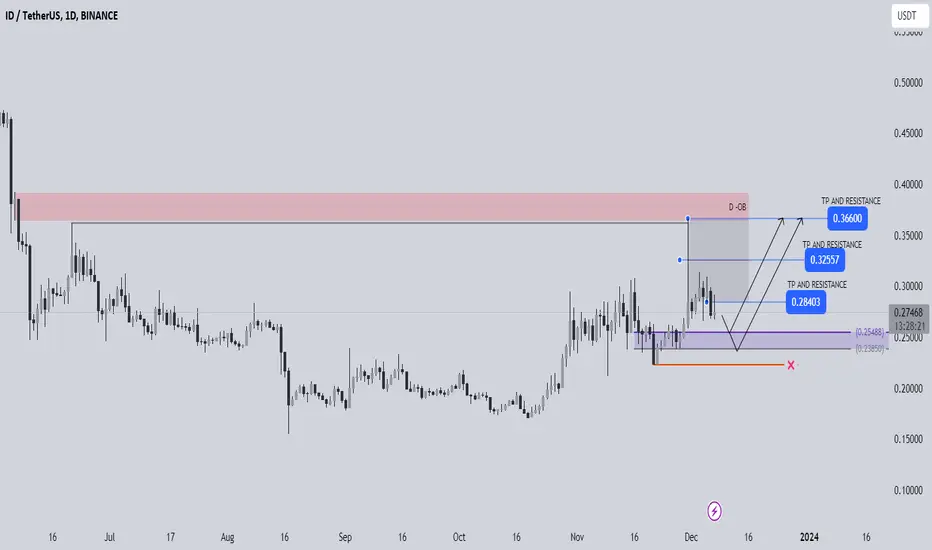
🎯 Initial Targets within Accumulation:
Our first set of targets? Look for them in the upper realms of the accumulation rectangle, approximately around $0.37 to $0.36.
📈 White Trend Lines: The Unyielding Forces:
These white trend lines? They're not just lines; they're formidable resistance and unshakeable support. Breaking free from the upper white trend line might just unlock higher targets, reaching into the red rectangle at around the $0.60s.
📉 Cautionary Note:
However, a word of caution – if we fail to break out of the upper trend line, brace yourself for a potential significant drop in ID's price.
Trading Essentials:
Safety First: Trade prudently, and never go all-in on a single move.
D.Y.O.R (Do Your Own Research): Knowledge is power.
🚨 Disclaimer:
This isn't financial advice; it's a friendly nudge to trade wisely and with caution.
May your trades be prosperous and your crypto journey full of good fortune! 🌌💰

IDUSDTBINANCE:IDUSDT Long idea
⛔"Daily crypto market analyses I provide are personal opinions & not financial advice. Trading carries risks, so do your own research & seek advisor's help. #DYOR
Don't forget to 🚀 and comment
IDUSDTBINANCE:IDUSDT Long idea
⛔"Daily crypto market analyses I provide are personal opinions & not financial advice. Trading carries risks, so do your own research & seek advisor's help. #DYOR"
Don't forget to like and comment.
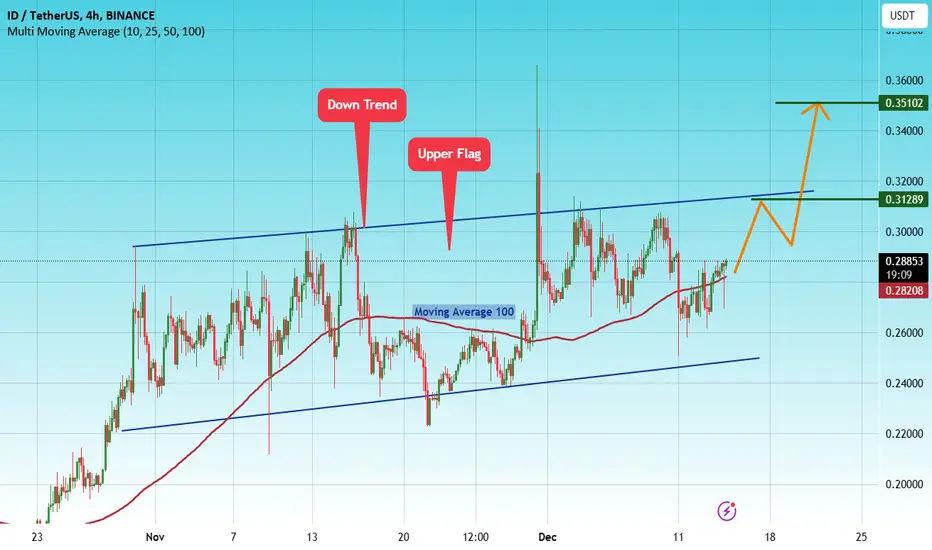
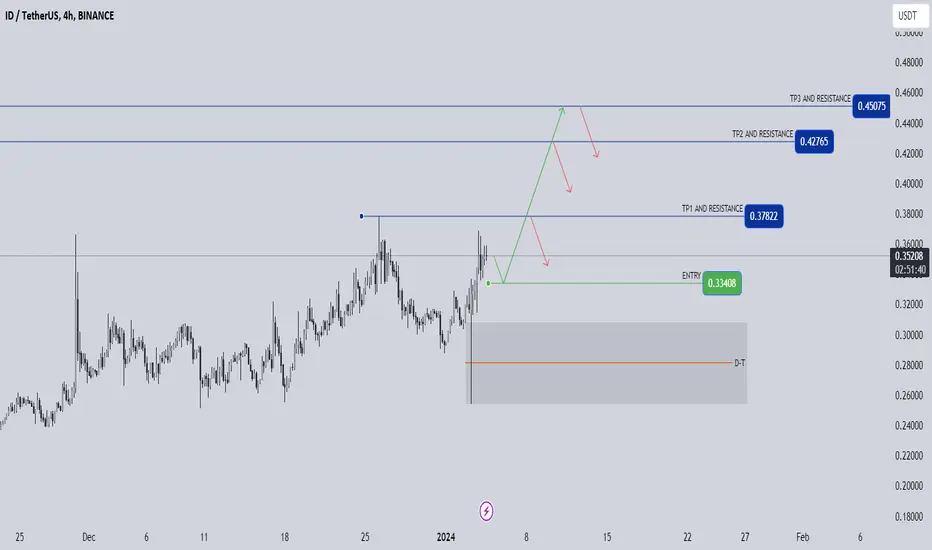
#ID/USDT#ID
We have a perfect bullish flag targeting the upper border of the flag
We have upward momentum and there are target areas that can act as resistance zones
We have a clear breakout of the Moving Average 100
Current price 0.28800
First target 0.31290
Second target 0.35100
Which represents 170% of the current price