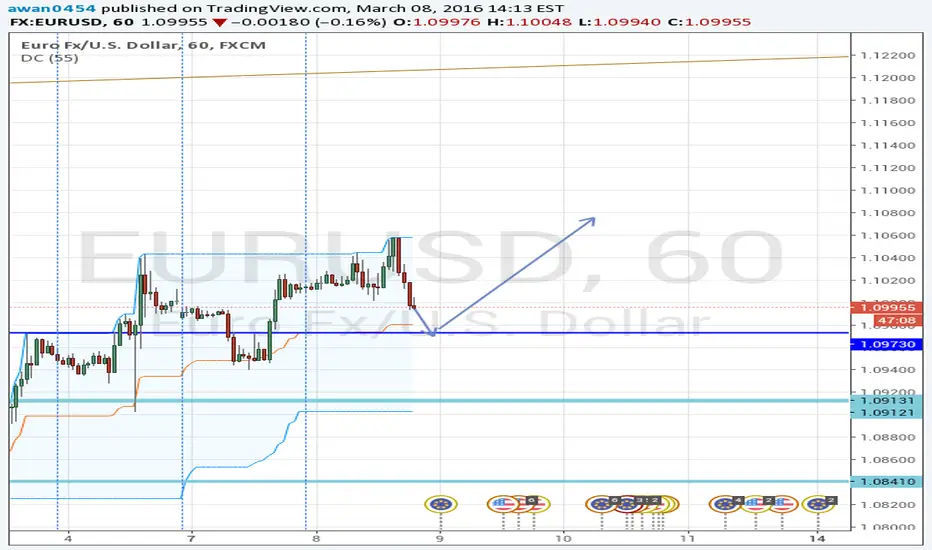
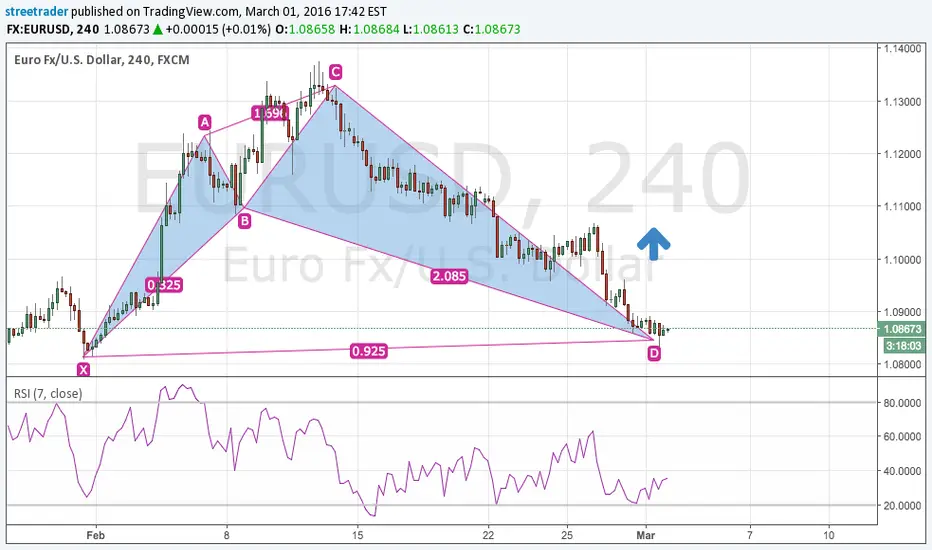
EURUSD nearing short term support level. Bounce is expected.EURUSD currency pair is nearing a short term support level which i think would most likely give us few very high probability pips on bounce. EurUsd is behaving like this of late. Best of luck.
Ilovetrading
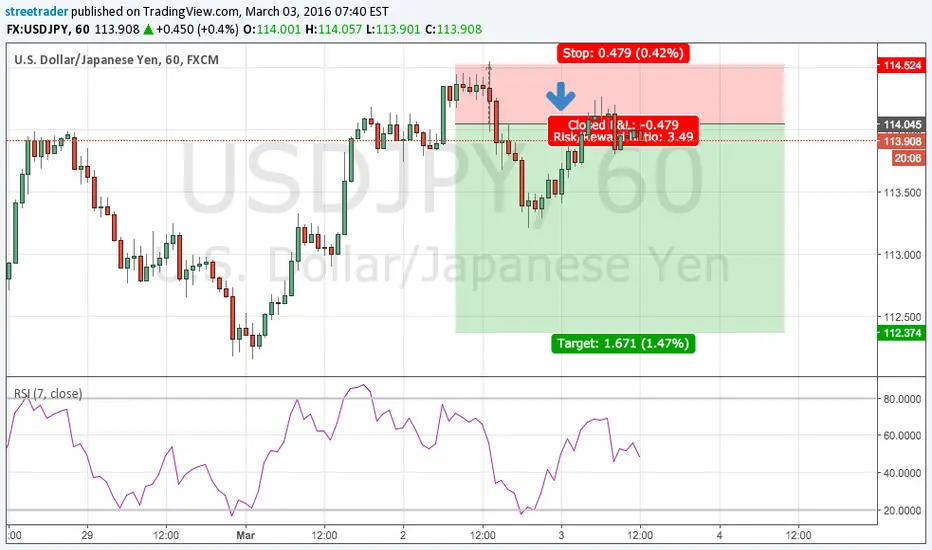


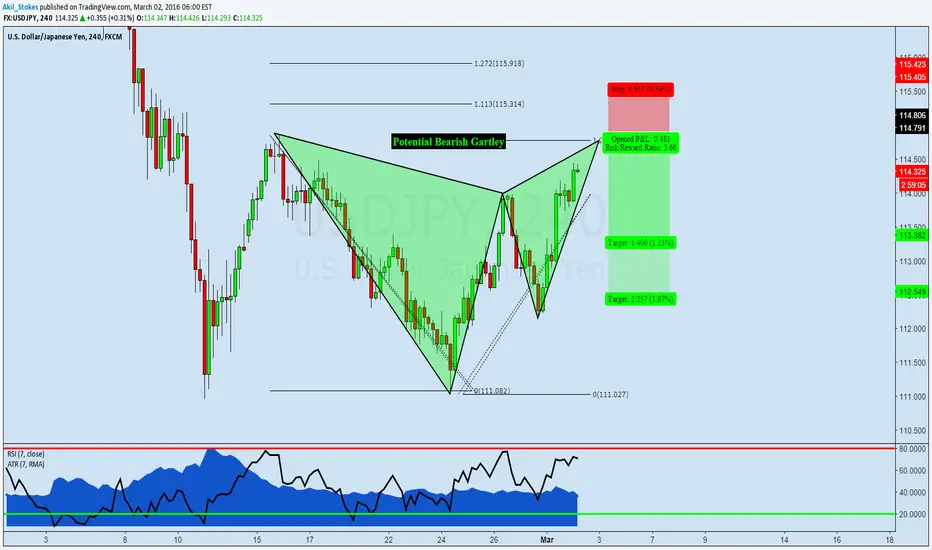
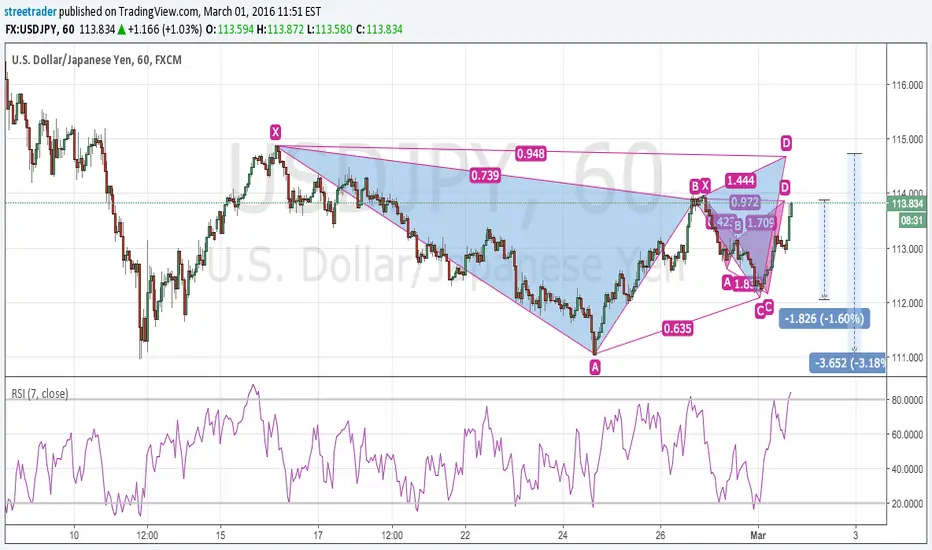
USDJPY: Potential Bearish Gartley with Good Risk/RewardPotential Bearish Gartley Pattern. With the completion being so close to the "X" leg it provides a really good risk reward ratio.
Hope to see all of you guys for tomorrow's "Paradigm Shift" event. If you're not signed up shoot me a private message and I can get you the link to do so.
Akil Stokes
Chief Currency Analyst & Head Trading Coach
www.TradeEmpowered.com -The Premier Online Trading Education Company
YouTube goo.gl
Facebook: goo.gl
Twitter: goo.gl
You Can Also Follow Me On Instagram, Periscope & StockTwits @AkilStokesRTM

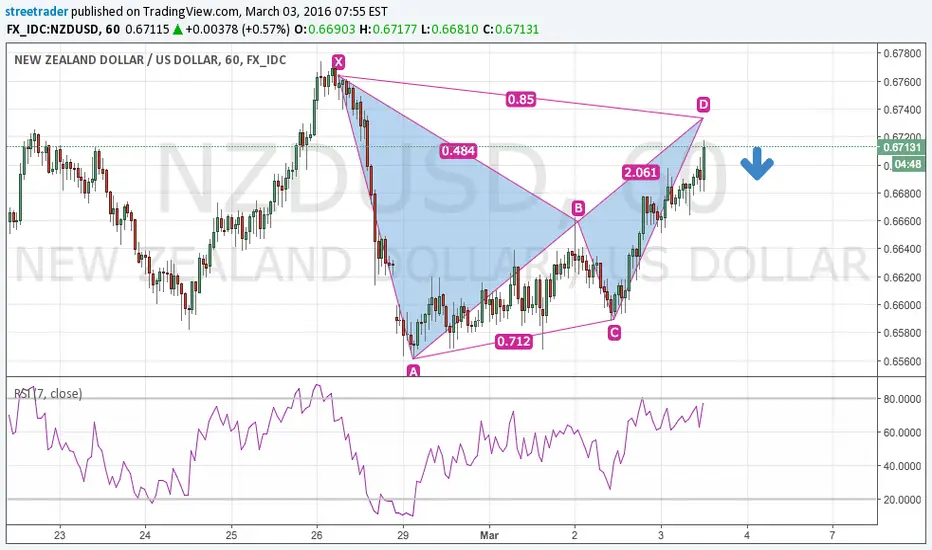
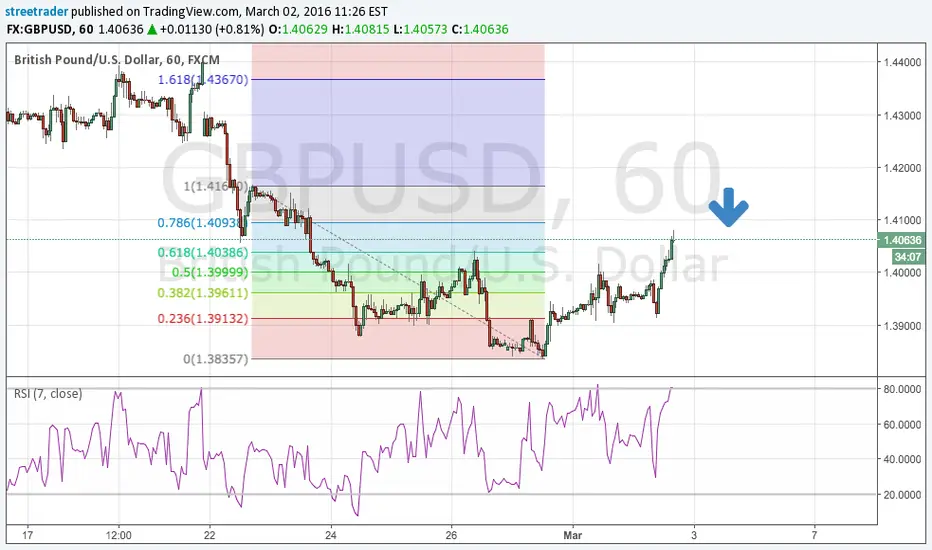
So what you expect for USDJPY today?#USDJPY could see two screnarios here. Both are potential sell. #streetrader.com

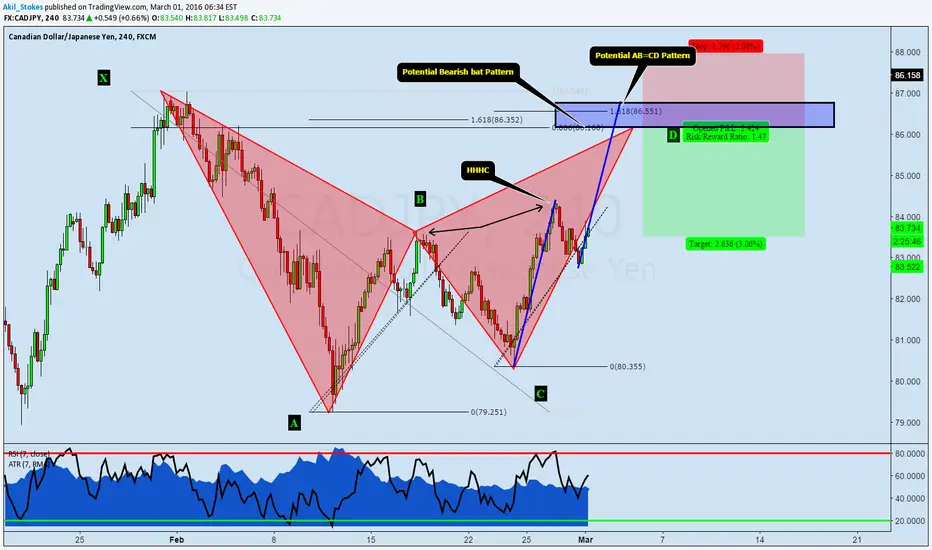
CADJPY: Potential Bear Bat Pattern & AB=CD CompletionNot all that much on my radar when ti comes to my person trading portfolio so for analysis purposes I went ahead and looked at a few other pairs that weren't able to make the starting lineup.
Here on CADJPY 4 Hour we have a potential Bat pattern completion at 86.16's Appearing inside that Bat pattern killzone also exist some fibonacci confluence and a potential AB=CD completion.
Not a pair that I can trade but a nice looking opportunity for those who trade these types of setups.
Akil Stokes
Chief Currency Analyst & Head Trading Coach
www.TradeEmpowered.com -The Premier Online Trading Education Company
YouTube goo.gl
Facebook: goo.gl
Twitter: goo.gl
You Can Also Follow Me On Instagram, Periscope & StockTwits @AkilStokesRTM
What is crude oil's next decision...?
Resuming from previous Crude oil Post in the blog, check it from what's happening section...
We at that time just had an idea that the developing correction could be a triangle but in the recent trading sessions, it is really very clear that the current correction is most possibly a triangle (Elliott wave Descending triangle) and within which the waves ABC have been completed and the remaining two legs D & E are about to be completed and as in a descending triangle the characteristics of the same is to test the support multiple times and which is what the D wave is going to do exactly and after that the E ( FINAL ) wave as dictated by the principle will be a multiple of FIBO numbers, with respect to Previous C wave rally and most possibly the .786 will be the target for the above stated E wave.
View the video as it also explains below one degree from daily charts to H4 charts.
www.mytradingcourses.com

Gold Rally is great But how Far...?
Resuming From Gold monthly analysis, check it from gold analysis section under Research Edge
As the structure warrants, markets always tells us what to do...!
the triple three within a triple three has been completed and it is time for an interim rally
The gold had bounced from its strong support area @ 1043 levels and this is the main reason for the current rally and this rally is taking place in one larger degree and not in small scale which means that the consolidation in this degree will also be in that retrospect.
The rally is really powerful but do not succumb to the volatility or the movement and to find the analysis in one lesser degree with embedded video, i.e what the gold charts say in daily charts, do visit it here
www.mytradingcourses.com
