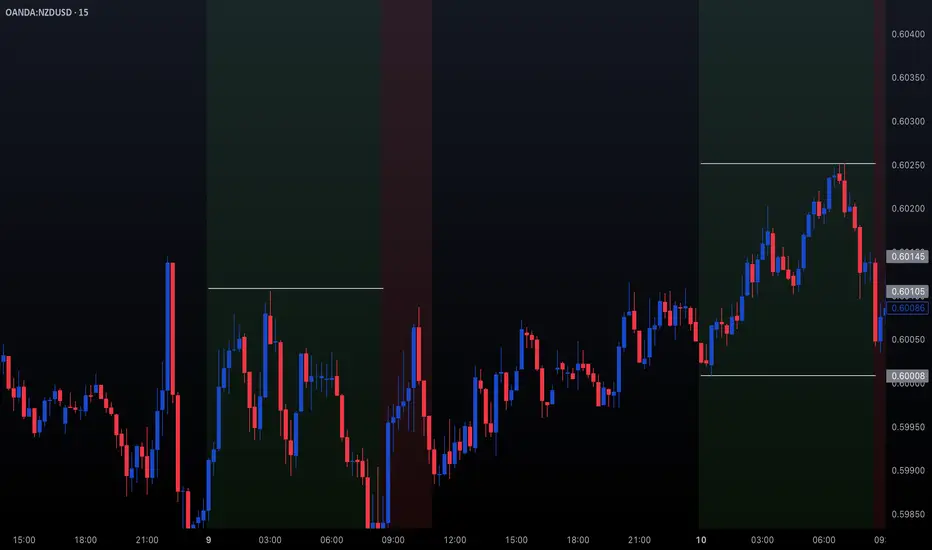
Trading NZDUSD | Judas Swing Strategy 10/07/2025Last week, we saw a textbook Judas Swing play out on OANDA:NZDUSD and this one checked every single box on our trading checklist. Let’s walk through the trade step by step
After a slow Asian session, NYO brought the kind of liquidity grab we look for. Price swept the low of our Judas swing zone, trapping early sellers and triggering stop hunts classic Judas behavior. As always, our first thought wasn’t to jump in it was to observe.
Once we spotted that liquidity sweep, our next confirmation came quickly: a clean break of structure to the upside. That shift in market sentiment was the green light to start prepping our entry. But, as we’ve learned from experience, patience is a trader’s superpower.
Instead of chasing the move, we waited for price to retrace into our Fair Value Gap (FVG) a key element in our Judas Swing checklist. No FVG touch, no trade. This time, price dipped right into our FVG zone. The moment the candle that entered the FVG closed, we executed with confidence.
Risk: 1%
Reward: 2%
Risk/Reward Ratio: 1:2
After executing the trade, there was a minor drawdown nothing major, just about 4 pips. Price never came close to our stop loss. Then came the move we were waiting for. OANDA:NZDUSD moved in our direction, and in an hour and 40 minutes, we hit our full target. A clean +2% gain added to the week’s tally.
This trade is a perfect example of how the Judas Swing strategy thrives especially after false moves into liquidity zones.
It was a clean setup:
- Sweep of liquidity
- Break of structure
- Retrace into FVG
- Controlled risk, solid R:R
If you’re still taking trades without a structured plan, now’s the time to consider building one. Strategies like this don’t just work because of entries they work because of discipline, timing, and consistency. We don’t trade everything. We trade the setups that check every box.
Imbalance
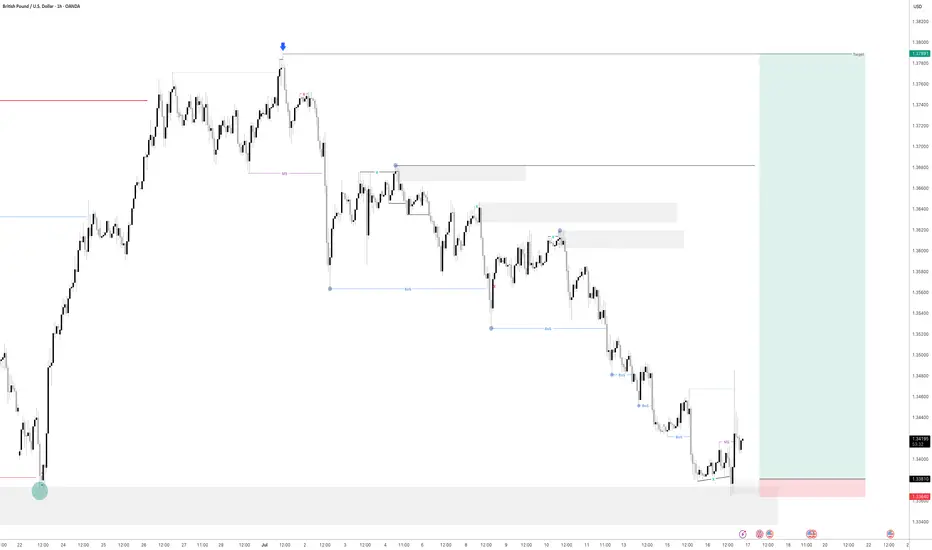
GBPUSD - Is it Ready? Looking at GBPUSD
We have had a Market shift to the upside from a HTF Point of Interest. I am now waiting for price to come back into a 15min demand area and hopefully price will take off to the upside from here.
We have also swept liquidity before a drastic move to the upside.
Lets see how this one plays out
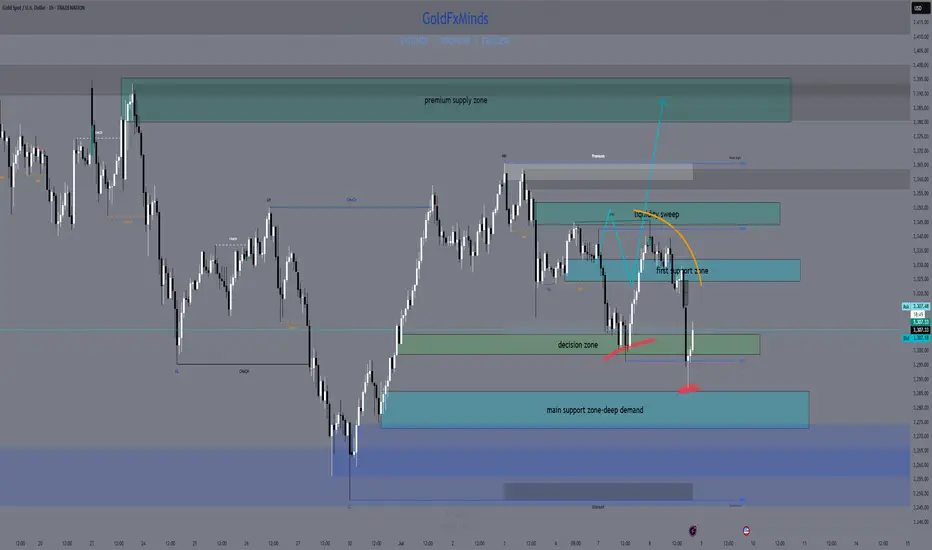
XAUUSD NY SESSION FLOW – JULY 8→ 9 , 2025"Structure doesn’t lie. Price answered exactly where we expected it to."
Hey traders 👋
Let’s set the record straight after today’s precision bounce. We saw textbook price action across all sessions — Asia triggered the short from our 3344–3351 HTF supply, and both London and New York followed through with no hesitation, driving price down to 3287.
But here’s the key point:
🧨 3287 was just 10 pips above our clean 3286–3280 buy zone.
No mitigation. Just a front-run.
That’s what real liquidity does — grabs what it needs before the crowd gets in. Our zone is still valid… just untouched.
🔍 HTF BIAS & STRUCTURE UPDATE
📆 Daily Bias:
Structure is still bearish — lower highs, CHoCH, and soft RSI.
EMAs 5/21 are flat. No power for bulls unless 3351 breaks.
⏰ H4 Bias:
New lower high confirmed after rejection from our 3344–3351 zone.
Trend is still bearish unless we reclaim 3330+ with conviction.
Liquidity is driving movement, not news.
🕐 H1 Flow:
Bounce from 3287 = engineered reaction before real demand
Price now hovering above 3306, forming mid-structure
No trade in the middle. Let’s work the edges.
🎯 TODAY’S SNIPER ZONES
🔻 SELL ZONES
1. 3325–3330
Nearest short trap. OB + inefficiency + H1 rejection base.
If price returns, watch M15/M30 for CHoCH or BOS → entry.
2. 3344–3351
Our major HTF supply. Asia already reacted from top half.
If revisited, this zone remains the high-probability rejection zone.
3. 3380–3394
Premium OB + imbalance pocket.
Untouched zone far above — if tapped late in the week, watch for liquidity sweep → clean reversal potential.
🟢 BUY ZONES
1. 3297–3300
NY session bounce zone. Price tapped 3297 → pushed to 3306.
Still live for intraday reentry if price retests and confirms with BOS.
2. 3286–3280
Our true demand base. Price front-ran it by 10 pips — didn’t mitigate.
Still valid, still reactive. Don’t delete this zone.
3. 3263–3255
Last line of support. Deep zone — only comes into play if 3280 fails with conviction.
✅ EXECUTION REMINDERS
Price is hovering mid-range → don’t force entries
Only act if structure reacts at the edges (3325 or 3286)
3380–3394 may be a late-week trap if bulls get overconfident
📌 If this breakdown helped, hit 🚀 and drop a comment:
👉 Are you stalking 3325… or waiting for 3286 to finally wake up?
Let structure talk. You just execute.
GoldFxMinds 💭🔥
📢 Disclosure:
This analysis is based on the Trade Nation TradingView feed. I’m part of their Influencer Program and receive a monthly fee.
⚠️ Educational content only — not financial advice.
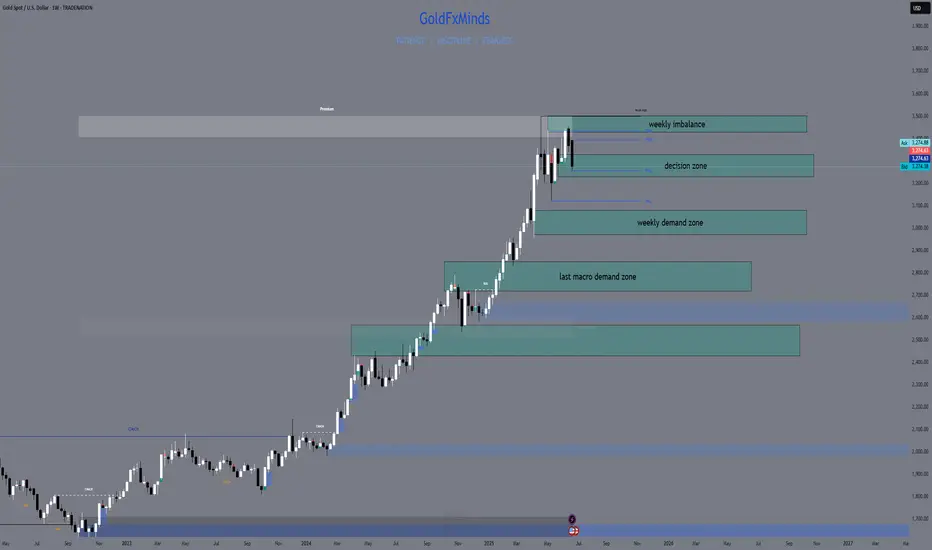
Weekly Outlook | XAUUSD June 30 – July 4, 2025Welcome to a new trading week. Let’s break down the gold chart from a clean, high-timeframe perspective. No setups, no noise – just structure, momentum, and zones that matter.
🌐 Macro Overview
This week concentrates all key USD events into one tight window:
Tuesday: ISM Manufacturing + Fed Chair Powell speech
Wednesday: ADP Employment
Thursday: NFP, Unemployment Rate, ISM Services PMI
Friday: US holiday – markets closed
📌 This means liquidity and momentum will peak by Thursday, then fade into the weekend.
Expect gold to stay in range until macro data breaks direction.
🧠 Weekly Structure & Momentum
Gold remains in a bullish macro structure, but price is hesitating below 3300.
Last two weekly candles printed long upper wicks with no body follow-through – clear sign of distribution, not continuation.
We’re still trading above the 21EMA Weekly, which maintains the uptrend’s integrity.
RSI (14): sitting at ~59 → no real momentum breakout, just consolidation.
📌 The chart is not reversing, but it’s also not trending anymore. We’re in a decision zone.
📍 Key Weekly Areas of Interest
3430 – 3500 → W1 Imbalance + March High Sweep
This is a wide weekly imbalance left unfilled since March, paired with the prior 2024 swing high. 3500 is also a psychological round number. If price pushes into this area, it becomes a liquidity target, not an entry – unless a clear rejection forms.
3330 – 3230 → Weekly Decision Block
This is the current consolidation range. It includes multiple W1 candle bodies, wick highs/lows, and volume cluster.
– Weekly close above 3330 = likely bullish continuation toward 3430+
– Weekly close below 3230 = confirms weakness and opens path to the next major support
3080 – 2970 → Weekly Demand + Fib 38%
Clean block of accumulation from April–May, aligned with the 38.2% retracement of the 2024 rally. This is where we’d expect institutional buying interest on a deeper pullback.
A weekly candle with a long wick into this zone + strong close would reset bullish structure.
2850 – 2720 → Last Macro Demand Zone
This zone includes the 50EMA weekly, a weekly FVG from late 2023, and unmitigated demand before the full 2024 breakout. If price ever gets here, we’re no longer in a healthy uptrend – we’re correcting structurally. But this zone will matter if that happens.
🧭 Summary & Expectations
Gold is still inside a large weekly range.
Until we break above 3330 or below 3230, it’s just consolidation on the HTF.
Thursday’s data will decide the candle.
Don’t predict direction — let the W1 close speak.
📌 Final Notes:
Above 3330 = room toward 3430–3500
Below 3230 = risk opens toward 3080–2970
Inside = no directional edge — stay reactive, not biased
🔥 If you enjoy this clean breakdown: hit that 🚀, follow & drop your thoughts below!
Stay sharp traders — we execute with precision.
— GoldFxMinds
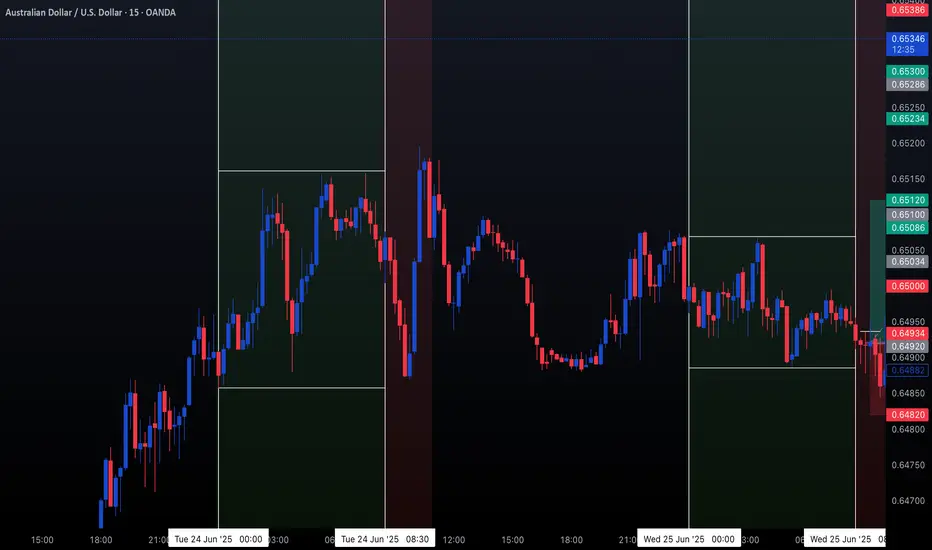
Trading AUDUSD NZDUSD | Judas Swing Strategy 25/06/2025This week the Judas Swing strategy has delivered two clean setups on OANDA:AUDUSD and $NZDUSD. Both trades played out beautifully, hitting their targets and ending the day with a solid +4% return (2% each), reinforcing the power of patience, structure, and sticking to the rules.
Let’s break down how each trade unfolded:
Trade 1: OANDA:AUDUSD Long — Textbook Setup
We kicked off Wednesday’s session watching OANDA:AUDUSD closely after identifying a classic Judas Swing scenario.
First, we saw liquidity swept below the previous session’s low, exactly what we’re looking for. This kind of move is crucial to the strategy, it grabs early sellers or stop orders and sets the stage for a reversal.
Right after the sweep, price broke structure to the upside, confirming our bullish bias. At this point, we didn’t rush in. We waited for price to retrace into our FVG (Fair Value Gap).
Patience paid off and price finally tapped into the FVG, and as soon as the entry candle closed in our direction, we executed the trade.
We risk 1% on every trade, aiming for a 2:1 reward-to-risk. After being in drawdown for a bit, price accelerated sharply and hit our target after being in the trade for 5 hours. Clean setup, clean execution, and a smooth +2% return.
Trade 2: OANDA:NZDUSD Long
OANDA:NZDUSD presented a near-identical setup. Price had been consolidating, but by the time the NY session rolled in, the stage was set.
Just like OANDA:AUDUSD , we saw a liquidity sweep at the lows, followed by a bullish break of structure, textbook Judas Swing again.
This time, the retracement into the FVG came swiftly. We executed as soon as we had confirmation on the candle close.
The trade barely hesitated, and price moved decisively in our direction, steadily climbing until our target was hit. Another +2% return, reinforcing the strategy’s strength when rules are respected
What This Week Reminds Us:
Discipline matters: We don’t chase trades. Both setups met all our checklist criteria
Patience is key: Waiting for the FVG entry and confirmation avoids emotional entries
Risk management is the foundation: With a 1% risk and 2:1 target, you only need to win half the time to be consistently profitable
When you follow a rules-based strategy like Judas Swing, you remove the guesswork and bring structure to your trading decisions.
XAUUSD Daily Sniper Plan – Monday, June 23, 2025Current Price: 3368.76
Trend: Bearish on H4 | Corrective on H1 | Weak Bullish Attempt on M15
Market Context: Gold is consolidating under EMA pressure after FOMC. Price is pinned inside a key flip zone, awaiting Monday’s fundamental triggers.
🔸 HTF Overview (D1, H4, H1)
📰 Macro + Economic Context – Week of June 23–28:
This is a high-impact week for USD with Fed speeches, inflation, and growth data. Monday opens with caution:
Monday, June 23
🟠 FOMC Member Waller Speaks
🔴 Flash Manufacturing & Services PMI
🟠 Existing Home Sales
Tuesday, June 24
🔴 Fed Chair Powell Testifies
🟠 CB Consumer Confidence
🟠 Richmond Manufacturing Index
Wednesday, June 25
🔴 Powell Testimony (Day 2)
🟠 New Home Sales
Thursday, June 26
🔴 Final GDP q/q
🔴 Unemployment Claims
🟠 Durable Goods Orders
🟠 Pending Home Sales
Friday, June 27
🔴 Core PCE Price Index
🟠 Revised UoM Consumer Sentiment
📌 Monday is lighter in impact, but PMI data and Waller’s speech may spark the week’s directional bias. Avoid trading blindly into PMI spikes.
H4 Structure & Bias:
Bearish trend intact: Lower High = 3418, Lower Low = 3311
EMAs (21/50/100) aligned downward — price capped below 3380
RSI still under 60 = no bullish momentum
Rejection zone remains valid at 3406–3420 (H4 OB)
Strong demand expected at 3340–3352 and extreme at 3310–3288
🔸 LTF Precision (M30, M15)
Price compressing around 3365–3372
RSI around 56 → indecision
No bullish HH above 3380 = still within bearish control
EMA flattening → prepare for trap setups around NY open
🧭 Trade Scenarios
🔻 Sell Zone – 3406–3420
H4 OB, FVG top, liquidity above 3405
Entry: 3412
SL: 3426
TP1: 3312
TP2: 3288
TP3: 3265
🧠 Wait for sweep or strong bearish reaction — no early entries.
⚠️ Flip Zone – 3360–3380
No-trade zone: EMA cluster + mid-FVG
Only use for confirmations, not entries
🟢 Buy Zone – 3340–3352
OB + demand + Fib retracement
Entry: 3348
SL: 3334
TP1: 3448
TP2: 3472
TP3: 3490
🟢 Buy Zone – 3310–3288
Below LL sweep (3311)
Deep liquidity + OB demand
Entry: 3298
SL: 3280
TP1: 3365
TP2: 3405
TP3: 3440
📍 Key Structural Levels – June 23
Level Type Role
3460 Bull Trap Limit Irrational spike area
3445 FOMC Unfilled wick – trap zone
3426 Sell Zone Risk protection above OB
3418 H4 LH Confirmed bearish structure
3410 OB Midpoint Micro-rejection inside OB
3395 Previous HH Inducement target
3384 FVG Top Minor LTF rejection
3360–3380 ⚠️ Flip Zone MA/FVG compression – avoid entries
3352 OB entry edge Buy Zone 1 upper limit
3340 OB base Buy Zone 1 key level
3311 H4 LL Confirms bear structure
3300 Round Level Psychological + liquidity
3288 OB base Final demand structure zone
3265 Final TP Bearish extension only
✅ Final Action Plan
📉 Stay bearish below 3380 unless a clean HH + OB support forms
⚠️ Avoid trading inside 3360–3380 flip zone during NY PMI data
🛒 Longs valid only from 3340 or 3310 with confirmation (RSI, PA, OB)
🧠 Focus on structure integrity and clean OB rejections only
💬 Will you fade the 3412 OB or wait for the sniper bounce at 3348?
🔔 Follow and 🚀@GoldFxMinds for premium breakdowns, macro updates, and real-time sniper execution guidance.
🔹 Disclosure: As part of Trade Nation’s Influencer Program, we receive monthly compensation for using their charts.
GoldFxMinds
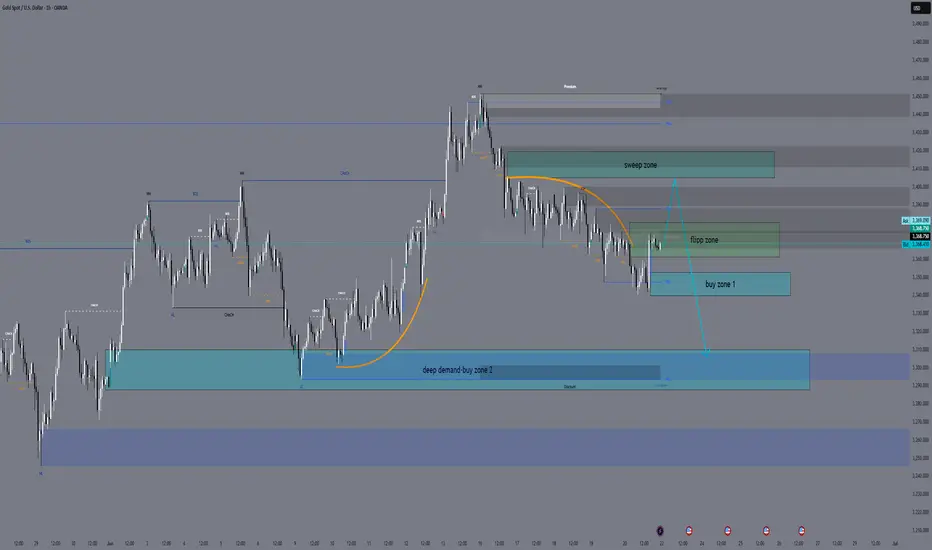
H4 Outlook – Between Flip and Trap👋 Hey Gold minds, welcome to another sniper-level breakdown. We're mid-range between major sweep zones and watching carefully how price reacts around the current compression under key EMAs and FVG. Let’s break it down:
🔸 MACRO + FUNDAMENTAL CONTEXT
USD drivers this week:
🔹 Monday–Tuesday: Multiple FOMC Members speaking
🔹 Wednesday: Powell Testimony
🔹 Thursday: Final GDP + Unemployment Claims
🔹 Friday: Core PCE and UoM Inflation Expectations
Macro sentiment:
FOMC speakers remain hawkish while inflation is sticky. Gold reacts defensively as markets price in Powell’s tone. Liquidity traps on both sides still active. Gold consolidates below key liquidity at 3405, potentially setting up for either expansion or sweep rejection.
🔸 H4 STRUCTURE + BIAS
Market structure:
Price formed a Lower High (3452) and confirmed bearish intent with a break of structure to the downside (CHoCH & BOS).
Currently compressing under H4 Fair Value Gap and retesting an internal OB + EQ zone around 3360–3370, showing signs of rejection.
EMA Cluster:
Price is compressing between EMA 21 / 50 / 100, failing to reclaim EMA100.
EMA5 is crossing under EMA21 – short-term bearish bias holds.
Bias: 🔻 Bearish to neutral
As long as price stays under 3380, supply remains in control. Only a break and close above 3405–3415 would flip bias bullish short term.
🧭 Sniper Zones – H4 Precision Map
🔷 Type 📍 Price Zone 📌 Justification
🔵 Buy Zone #1 3315 – 3340 Valid OB , previous HL structure, FVG reaction support
🔵 Buy Zone #2 3280 – 3302 Deeper demand pocket, untapped imbalance
🟠 Flip Zone 3360 – 3380 FVG + internal OB + EMA compression = key battle zone
🔴 Sell Zone #1 3405 – 3415 Internal OB + unmitigated premium zone under LH
🔴 Sell Trap Zone 3440 – 3460 Extreme rejection zone — 3452 HH sweep logic + OB
🔸 Price Action Expectations (PA)
If price rejects 3360–3380, expect a clean push back to 3320, with possible deeper draw to 3300–3285.
A clean break and close above 3380 (not just a wick) may open the door for a sweep of 3405, where sellers are expected.
Only an aggressive news-driven breakout above 3415 would unlock the final trap zone toward 3450+ – lower probability unless Powell surprises.
✅ Conclusion & Execution Plan
🎯 Watch how price behaves around the Flip Zone — this is the decision point.
📉 Main bearish confirmation = strong rejection at Flip Zone or 3405.
📈 Bullish continuation only above 3415 with volume and closing strength.
💎 Best RR zones:
Sell 3405–3420 → targeting 3360 / 3340
Buy 3315–3340 → targeting 3360 / 3380
🔥 If this breakdown helped sharpen your edge, drop a 🚀 in the comments and like the post!
🔔 Follow GoldFxMinds for more real-time, structure-based sniper plans.
🧠 Precision isn't optional. It's the edge.
🔹 Disclosure: As part of Trade Nation’s Influencer Program, we receive monthly compensation for using their charts.
GoldFxMinds
XAUUSD Weekly Outlook | June 23–27, 2025👋 Hey gold traders! As we close out the FOMC week and head into the final stretch of June, gold continues to hold bullish structure — but this week's candle is entering a very sensitive premium area. Let's break it all down in full top-down clarity:
🔍 Weekly Structure Update
✅ Weekly BOS confirmed since November 2023
✅ Price holding above EMA 5/21/50 — bullish lock intact
🔼 Current HH printed at 3452
📍Price is now entering a weekly FVG + supply trap zone around 3440–3460
🟣 RSI divergence starting to appear — caution in premium
🗺 Key Weekly Zones
Type Price Range Context
🔵 Demand Zone 3150 – 3190 Weekly OB + EMA50 confluence
🟣 FVG Support 3284 – 3320 Fresh imbalance post BOS
🟠 Flip Zone 3363 – 3385 Retest of BOS + FVG bottom
🔴 Sell Trap Zone 3440 – 3460 Weekly OB + liquidity sweep area
🧠 Bias This Week
📌 Bullish, but extended.
We expect a reaction from 3440–3460, not blind continuation.
The next healthy buy opportunity is only valid on a retrace toward 3320–3280, aligned with imbalance + structure.
🧭 GoldFxMinds Game Plan
Above 3440–3460 = overextension — wait for trap/sweep confirmation 🧨
Below 3363 = bearish flip zone — risk of revisiting 3280
Ideal buy = 3284–3320 → only on bullish PA or reversal confirmation
📰 Upcoming Economic Events (June 23–27)
🗣 FOMC Speakers flood the week (Waller, Powell, Williams, Goolsbee, Hammack, etc.)
🏠 Existing & New Home Sales, Consumer Confidence, Pending Home Sales
🛢 Crude Oil & Natural Gas Inventory reports
📊 Final GDP q/q, Core PCE, Personal Spending/Income
📉 Durable Goods, Unemployment Claims
🧪 Bank Stress Test Results (Friday)
⚠️ This is a dense news week — stay alert for surprise volatility, especially around Powell’s testimonies (Tue & Wed).
⚠️ Summary:
We are no longer in discount — we are inside the premium trap. Gold remains bullish, but 3440–3460 is a red flag zone. If this becomes the top, watch the flip at 3363–3385. Only re-enter long if structure confirms.
💬 If you found this helpful, drop a comment, give it a like, and make sure to follow GoldFxMinds for more sniper-level updates every week!
📣 This post was made using the Trade Nation chart feed. As a partner in their influencer program, I receive compensation for using and sharing their tools.
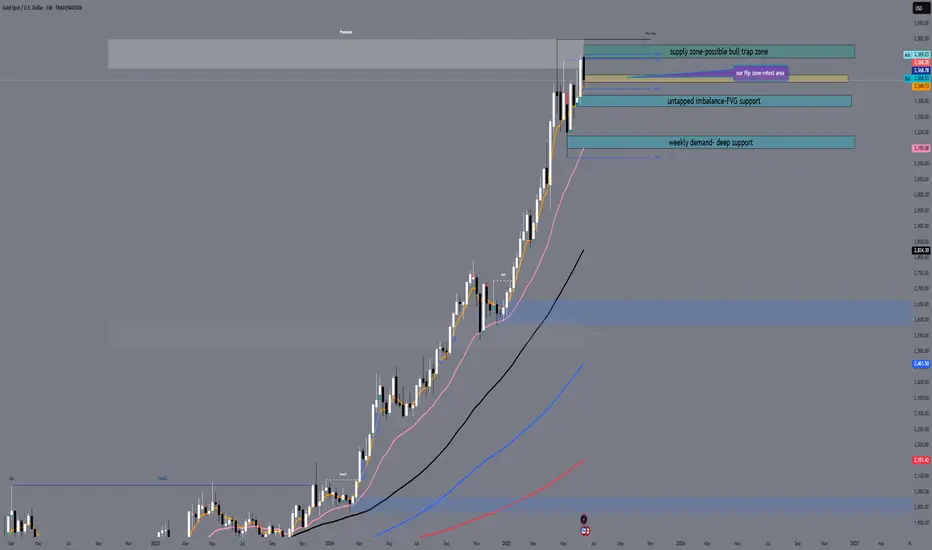
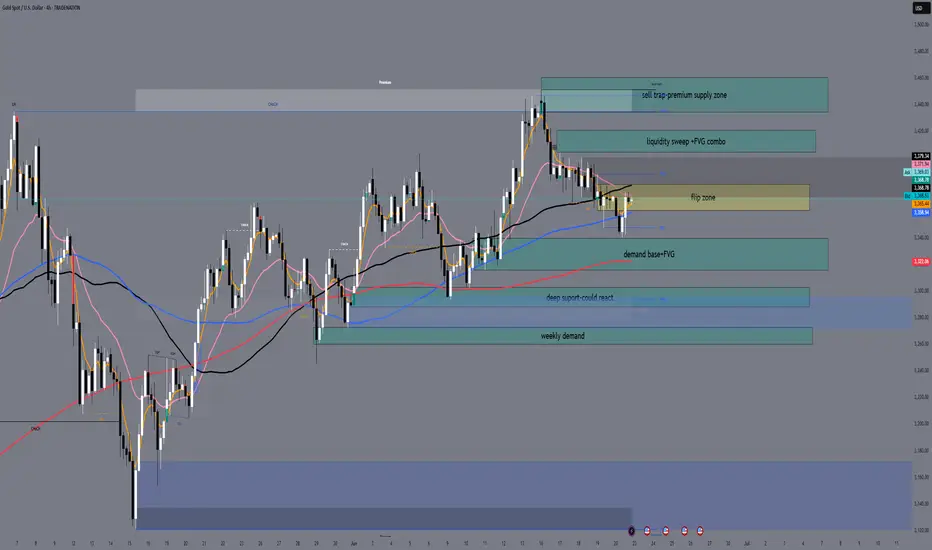
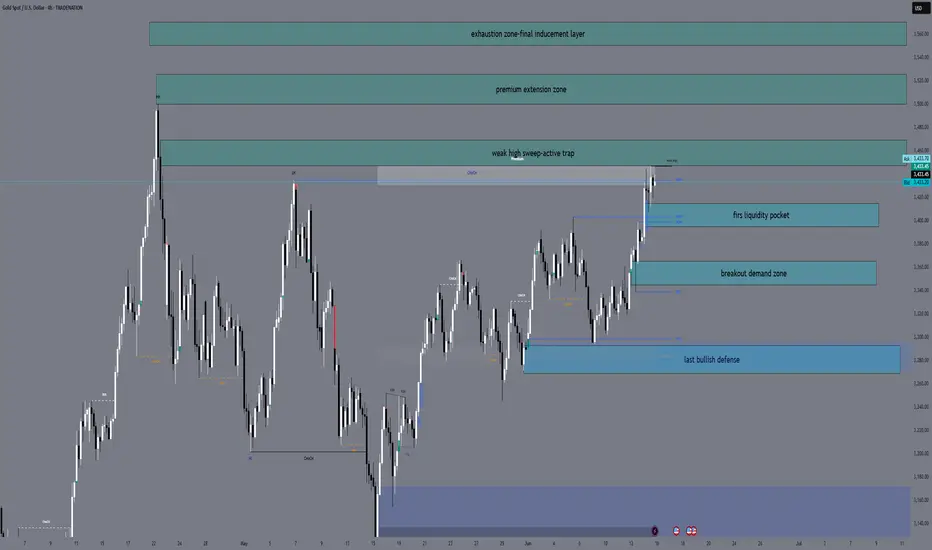
XAUUSD H4 Outlook — 16 June 2025👋 Hello team, here’s where we stand before the upcoming key week:
🔎 The Narrative
Gold remains in bullish control after weeks of controlled expansion.
The clean breakout above previous major highs triggered liquidity resets that cleared significant weak-handed positions.
Last week’s sweep into 3447 activated premium liquidity, trapping late buyers at the edge of impulsive highs. But the game is far from over — smart money continues to rotate liquidity at these extreme levels, using premium expansion to build further trap pockets both above and below.
Behind this technical expansion, macro tensions continue to fuel underlying gold demand. Geopolitical uncertainties remain elevated with the Middle East escalation risk growing, while recent Fed positioning keeps rate path expectations flexible.
The upcoming FOMC decision later this week will likely act as the true liquidity catalyst — until then, gold remains positioned for further inducement cycles as both buyers and sellers continue to get baited into traps.
🔼 Premium Supply Zones
Price Zone Description
3447 – 3470 Weak high sweep — premium liquidity trap fully active
3500 – 3525 Main extension liquidity pocket — Fibonacci cluster (1.272 & 1.414 extensions)
3550 – 3570 Exhaustion inducement — full 1.618 premium extension stack
🔽 Demand Defense Zones
Price Zone Description
3415 – 3395 Minor imbalance recalibration — short-term liquidity refill zone
3365 – 3345 Core breakout OB + FVG overlap — main recalibration zone if pullbacks extend
3285 – 3265 HTF bullish structure base — BOS origin + deep recalibration defense level
🎯 Where We Stand Right Now
✅ Smart money holds full control inside premium expansion.
✅ Inducement layers remain open both above and below current price.
✅ We expect short-term liquidity sweeps before any major expansion unfolds.
✅ No change in bias — bullish structure remains valid while 3285 holds.
🔐 The Mindset
👉 This is not the place for aggressive chasing.
👉 Liquidity will continue to hunt both sides into key events ahead.
👉 Our job is not to predict, but to position with discipline once liquidity confirms displacement inside the calibrated zones.
🚀 If this breakdown helps you stay locked:
💬 Drop a 🚀, leave your thoughts & follow for full sniper-level updates as we approach a volatile week ahead.
Stay sharp — the trap is already in play.
— GoldFxMinds
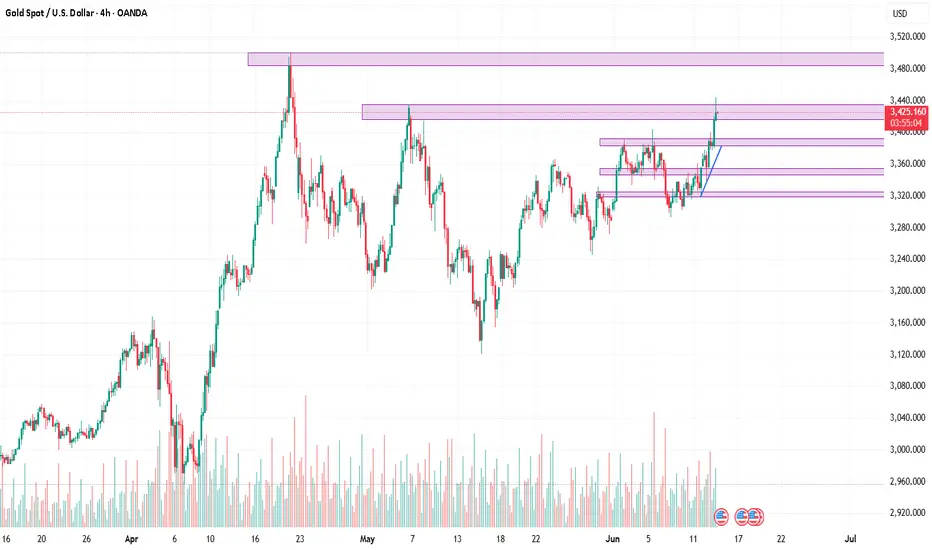
XAU/USD 4H Technical Analysis 13 June 2025Market Structure & Bias:
On the 4H chart, gold has broken out of a recent sideways range and formed a sequence of higher highs and higher lows. This “break of structure” (BOS) through the old swing high confirms a bullish bias.
Price action respects key support zones (demand areas) on retracements, suggesting underlying buying interest. The overall bias is bullish, driven by risk‐off sentiment. Support and resistance act as natural pause/reversal zones
For example, a demand zone/order block around ~3390–3400 (from the prior swing low) has been tested and held, fueling the recent rally.
Likewise, an imbalance (fair value gap) left below 3400 could attract buyers if price returns. We also note that a change of character (CHOCH) would occur only if price breaks below a higher-low; so far that has not happened.
In short, gold’s 4H market structure is bullish (higher highs/lows) and the trend looks set to continue upward unless a strong reversal forms. Key Levels (4H): We use classic pivot points to mark critical levels (using the last 4H high, low, close). Pivot points can project future support and resistance.
Based on recent swings, key levels are:
Pivot: 3424 (calculated from last bar’s H/L/C)
Support 1: 3413
Support 2: 3399
Support 3: 3374
Resistance 1: 3438
Resistance 2: 3449
Resistance 3: 3474
Price currently hovers just below R1. These levels align with congestion zones and Fib retracements (50–61.8% of the last $3290–3427 upswing), so expect active bidding near S1–S2 and selling around R1–R2.
Intraday 1H Trade Setups
Buy Zone ~3395–3405 (Bullish OB/Demand):
Entry: Long on dips into the order-block/demand area near 3395–3405 (just above S1).
Stop: ~3385 (≈$10 below entry zone).
Targets: TP1 ≈ 3438 (Resistance 1), TP2 ≈ 3450 (near R2).
Reason: This zone aligns with a prior institutional order block/demand and a 61.8% Fib retrace of the recent rally. Price has shown bounce here before, so a bullish reaction is likely.
Trigger: Look for a bullish reversal candle (e.g. bullish engulfing or pin bar) on 1H in this zone, or a market structure low (MSL) turning point. A break back above the high of that candle can serve as confirmation to enter.
Sell Zone ~3435–3445 (Bearish Retrace):
Entry: Short near resistance around 3435–3445 (just below R1–R2).
Stop: ~3455 (≈$10 above entry zone).
Targets: TP1 ≈ 3413 (Support 1), TP2 ≈ 3399 (Support 2).
Reason: This area is the upper end of the recent range. It contains a minor supply zone and the R1–R2 pivots. A liquidity sweep (stop-hunt) may occur above recent highs.
If price loses momentum here, expect a pullback.
Trigger: Watch for a bearish price action signal (e.g. a bearish engulfing candle or a double-top swing) on 1H. A break of the immediate lower low (lower than the last minor swing) would confirm a short-term change of character and signal entry.
Breakout Long ~3449+:
Entry: Long on a sustained break above R2 (≈3450). Confirm entry when price closes above 3449 on 1H.
Stop: ~3424 (just under the Pivot).
Targets: TP1 ≈ 3474 (Resistance 3), TP2 ≈ 3495+ (new highs).
Reason: A clean breakout of 3450 would indicate strong bullish order flow and trigger stop-run triggers. This would be a continuation trade in line with the 4H uptrend.
Trigger: A bullish candle closing above 3449 (ideally with above-average size) or a 1H break of structure (higher high over 3449) would signal entry.
Takeaway: Gold remains in a bullish 4H trend; focus on buying dips into demand zones and watch for clear candlestick triggers at support/resistance.
Judas Swing Monday Recap – Sticking to the Plan Pays 09/06/2025In case you're new to the Judas Swing Strategy, here’s the strategy in a nutshell:
It’s a classic price manipulation strategy where the market fakes a move in one direction (the “Judas” move), usually after the 00:00–08:30 EST window, before sharply reversing. This tactic is often used by smart money to trap retail traders around key highs/lows, followed by a reversal into a Fair Value Gap (FVG) for entry confirmation.
We began Monday spotting a textbook Judas Swing on FX:EURUSD which was our first trade of the day. Price took out session lows, grabbing liquidity, then gave us a break of structure to the upside and a clean reversal into the FVG.
We entered long with our stop loss below the manipulation low. The trade moved nicely into profit and came within points of our target but just as we were anticipating a clean 1:2, price stalled and reversed aggressively, stopping us out.
Trade Outcome: Loss
Risk-Reward: -1%
Lesson: Even the most valid setups will sometimes fail
The next Judas swing setup came on $GBPUSD. Price swept the low of the zone, then gave a break of structure, with price retracing into the FVG. We entered long, placing the stop loss 10 pips below entry price.
The trade rallied hard post-entry, hitting our target with minimal drawdown
Trade Outcome: Win
Risk-Reward: +2%
This is why we take every valid setup. The win here offset the earlier FX:EURUSD loss, keeping us net even on the day at this point
The final Judas swing setup on Monday was on OANDA:AUDUSD , and it couldn’t have been cleaner. After a strong sweep of previous lows, price reversed and broke structure convincingly. An FVG formed and price retraced into it beautifully.
We entered long, placing the stop below the liquidity sweep. Price then rallied steadily throughout the session, and retraced almost hitting our stop loss but turned around and hit our 1:2 target.
Trade Outcome: Win
Risk-Reward: +2%
Despite starting the day with a loss, staying disciplined and trading all valid Judas setups left us with:
1 loss ( FX:EURUSD -1%)
2 wins ( FX:GBPUSD +2%, OANDA:AUDUSD +2%)
Net Gain: +3R
This is why a rules-based approach beats emotional trading. Stick to the process, and the edge takes care of the rest.

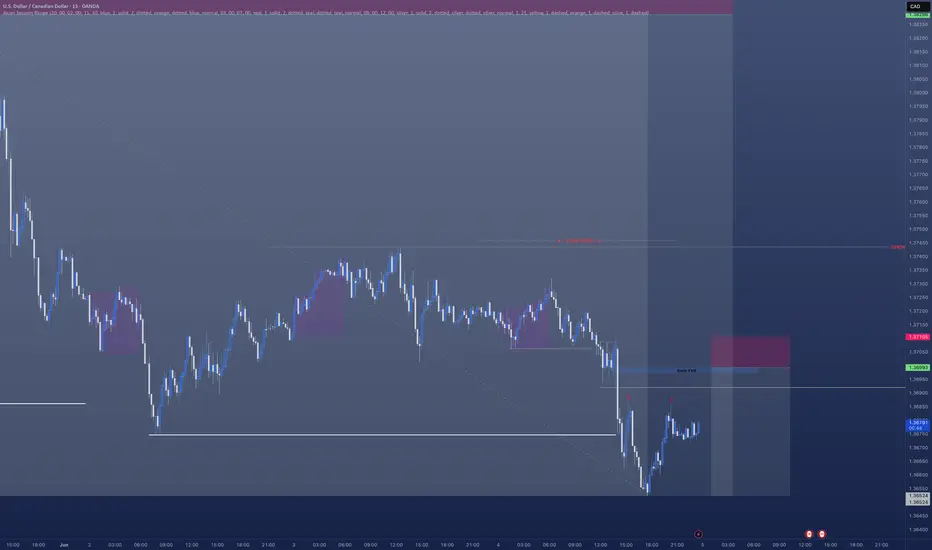
USDCAD - Short ContinuationHave a really nice short currently open on USDCAD
However I am looking to get a further position opened which come in the morning.
There's a clear break of structure.
- A nice FVG left behind.
- We are creating liquidity / inducement
- All pointing towards a nice further sell off in the morning.
Ideal situation is we sweep Asian session highs in the morning in the hope we move lower
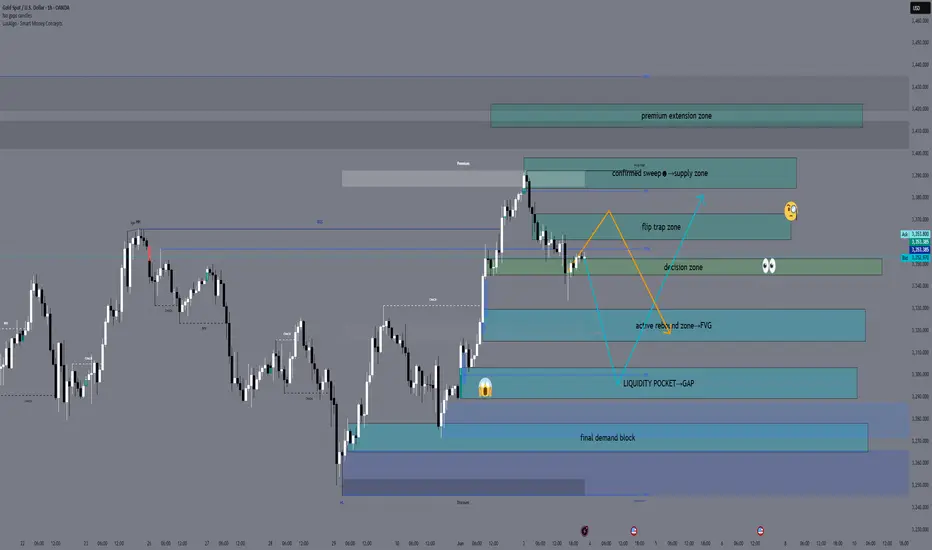
Decision Day: Flip or Fail?” — XAUUSD Sniper Battlefield Plan👋 Hello gold tacticians — we’ve entered a key battlefield.
Price is hovering in a critical flip zone after a sweep of 3395, and with ADP Non-Farm + ISM Services PMI coming up, the market won’t stay neutral for long.
This is not a time for random trades. Let’s lock in real zones and prepare for both traps and confirmations. 🎯
🟡 Neutral Bias
Price is in a flip zone (3345–3352) → Not clearly bullish or bearish.
We’ve seen both buying pressure from 3320s and strong rejection from 3395.
Market is ranging between premium and discount — no confirmed trend.
⚠️ Bearish Weight (Slight Tilt)
3384–3395 sweep confirms liquidity trap.
RSI divergence + price rejected from premium supply.
FVG gap under price (3303–3289) remains unfilled — likely draw.
Big news (ADP + ISM) may trigger stop hunts — downside has better structure for continuation.
✅ Conclusion:
We are neutral, but leaning bearish unless price confirms a clean break and hold above 3395.
You should follow structure shifts on M15/H1 after ADP before committing fully to either side.
🟡 Neutral Decision Zone – The Flip Battlefield
3345 – 3352
→ Previously acted as resistance — now tested as support
→ This is neutral ground — confirmation will decide if we bounce or dump
→ Use only with clear M15 PA
🧠 Wait here — bulls and bears will fight it out.
🔻 SELL ZONES – Premium Traps
Zone Key Levels Why it Matters
🔺 Main Rejection Block 3384 – 3395 Sweep + FVG + OB cluster — price was rejected here. If tapped again → watch for M15 bearish shift.
🔺 Flip Trap Extension 3368 – 3375 Previous broken high. If price fails to stay above → good place for fakeout sell.
🔺 Ultimate Premium Trap 3412 – 3422 Extreme liquidity grab if market spikes after ADP. Use only if FOMO buyers get trapped.
🟢 BUY ZONES – Smart Demand Levels
Zone Key Levels Why it Matters
🟢 Active Rebound Zone 3330 – 3320 OB + FVG + current HL reaction. Great sniper long if price holds.
🟢 Reload Buy Pocket 3303 – 3289 Fresh NY FVG + EMA confluence + liquidity. If ADP gives downside wick, this is the reload zone.
🟢 Final Demand Block 3265 – 3278 Deep sweep zone from H4. If hit → expect strong reaction. HL or M15 BOS confirms.
🔍 Strategy Scenarios
📉 Sell Plan A → Spike into 3384–3395 → M15/M30 bearish shift → short to 3352 → then 3320
📉 Sell Plan B → Flip rejection from 3368–3375 → short scalp to 3330
📉 Sell Plan C → FOMO sweep into 3412+ → wait for reversal wick → high-RR short
📈 Buy Plan A → Bounce from 3330–3320 → confirm HL → long toward 3368
📈 Buy Plan B → Flush into 3303–3289 → watch for OB reaction + PA → long scalp toward 3345
📈 Buy Plan C → Extreme dip to 3265 → reversal PA → long to 3300+
⚙️ Market Context
EMA 5/21/50 bullish but stretched
Price is compressing under a sweep — not trending
ADP + ISM = volatility trap window
RSI showing bearish divergence in premium
💬 Final Words from GoldFxMinds
Gold is standing in the middle of a flip battlefield. It doesn’t matter if you’re bullish or bearish — what matters is structure and reaction. Let the market reveal its hand.
🎯 Stay out of noise. Wait for the trigger. Act with clarity.
If this breakdown helped you today:
❤️ Drop a LIKE
🧠 Leave a COMMENT on what you’re watching
📌 And FOLLOW GoldFxMinds for clean, structured daily plans
Let’s dominate June with patience and precision.
— GoldFxMinds
GBPCAD SELL OPPORTUNITY 5 MIN TIMEFRAMEClear trend breakout and retest has occured. Targetting for it to hit the large imbalance on the left before going down which it did. Targetting imbalances on 5 min tf. the 30 min and 4 hr 10 and 20 EMA on downtrend too

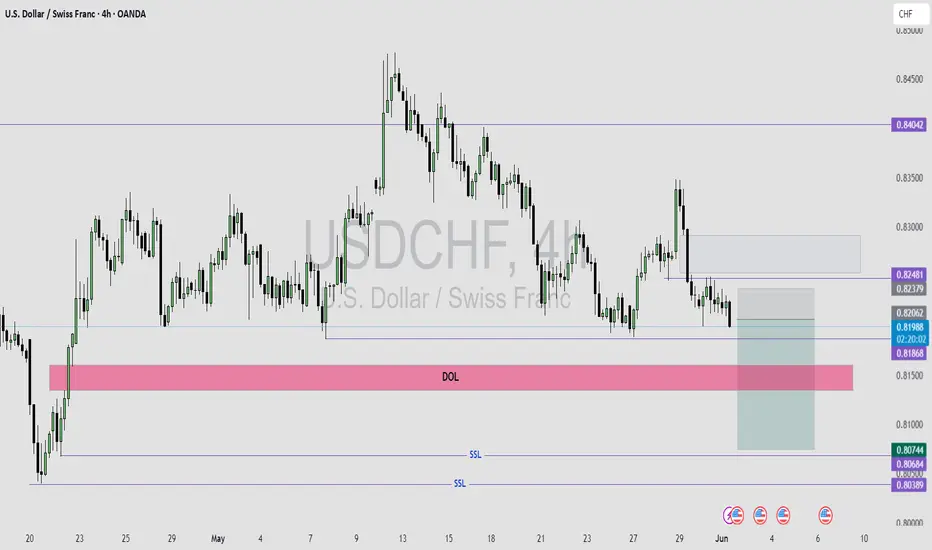
USDCHF SELL IDEAUSDCHF is Ready to continue It's SELL Move to the higher time frame recent swing low of 0.803.
SELL IDEA BREAKDOWN;
Weekly is bearish and price is moving closer to the 0.803 swing low.
Daily is also bearish, price is moving towards the weekly swing low.
4HR had a bearish break in market structure, followed by a retest of the recent swing low that was broken by price to give MSS.
My entry was taken after the formation of a swing low and price is done retesting the old low.
This is a continuation trade.
Trading AUDUSD | Judas Swing Strategy 26-28/05/2025Incase you're new to the Judas Swing Strategy and want to know what the strategy is about, it is a classic price manipulation concept where the market fakes a move in one direction (the “Judas” move), only to reverse and trend in the opposite direction. It’s common during 00:00 - 08:30 EST openings, often used by smart money to trap retail traders. It’s especially powerful when paired with liquidity grabs above/below key highs or lows, followed by a reversal into a FVG confirmation
On Monday, we identified a clean Judas Swing setup. Price spiked below previous lows, giving us a bias to look for potential buying setups after what looked like a classic liquidity grab. We got a break of structure and a reversal into the FVG created.
However, after entry, price failed to reject meaningfully and instead continued lower only after taking out the low, hitting our stop loss before any major move up. We lost 1% on this trade and the lesson all traders need to learn here is that even valid setups will fail and you'll lose money at some point when trading.
Fast forward to Wednesday
We saw a similar manipulation as price spiked below recent Judas swing zones during NY session, grabbing sell-side liquidity before reversing sharply. We waited for confirmation a strong bullish engulfing and break of minor structure. Entry was taken long, with stop loss 10 pips below the liquidity grab and target at previous structure highs.
The trade ran smoothly into profit, validating the setup and recovering the week's earlier loss.
Trade Outcome: Win
Risk-Reward: Clean 1:2
Notes traders need to take from this trade:
- Perfect Judas Swing after liquidity sweep
- Patience for confirmation paid off
- Structure shift confirmed smart money reversal

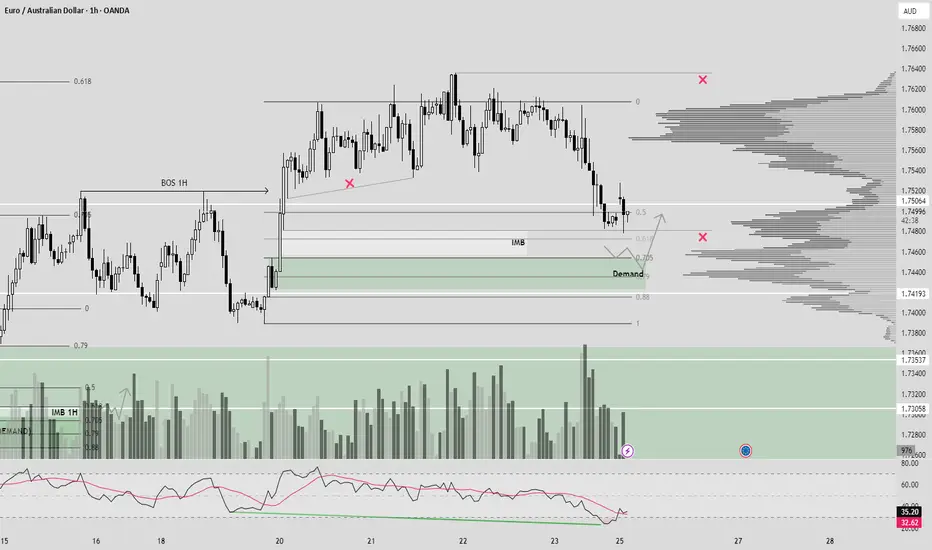
EURAUD (BOS 1H + DEMAND + OTE)Hello traders!
Description: Now we already in 0,5 of fib level, price want to close imb and mitigate demand + 705 OTE in case BOS 1H.
Entry: Confirmation on LTF in POI
Target: New HH
P.S: check also previous idea.
Have a profitable day and don't forget to subscribe for more updates!
If you like this idea drop a like, leave a comment.
Trading AUDUSD NZDUSD | Judas Swing Strategy 20/05/2025We’re halfway through the week and already sitting on two clean setups, all rooted in the Judas Swing Strategy. After Monday gave us nothing worth trading, Tuesday served up textbook opportunities on OANDA:AUDUSD and $NZDUSD. In this breakdown, we’ll walk through two trades from Tuesday and highlight how they followed the exact Judas Swing playbook: manipulation first, then break of structure, retracement and execution
AUDUSD: The Classic Fakeout Reversal
Tuesday's OANDA:AUDUSD setup was as clean as they come. Price action leading into our session was heading downward. Liquidity had built up nicely above and below our zones giving us the bait we needed for the Judas Swing setup to trigger.
As expected, our session opened with a sharp fake move to the downside, sweeping the sell-side liquidity and trapping breakout sellers. What came next was the real clue: a decisive break of structure to the upside, signaling that the manipulation was complete and the true direction was about to unfold.
Price formed a Fair Value Gap (FVG) during the move up, and once it retraced into that imbalance, we executed our buy:
Entry: 0.64007
Stop Loss: 0.63907
Take Profit: 0.64207
The result? We faced some drawdown and a clean move into target. It was a low-stress trade that respected the plan from entry to exit
NZDUSD: Same Script
If OANDA:AUDUSD was the blueprint, OANDA:NZDUSD mirrored it almost exactly since they are closely correlated pairs.
Again, we started the session with a tight range. Liquidity had stacked nicely above and below the zone. Then, right on cue, the market delivered its Judas move, a fast pump below the pre-session lows, baiting in breakout shorts.
This was followed by a swift rejection and a clear break of structure to the upside. Once that displacement printed a Fair Value Gap, we knew where our opportunity lay.
Entry: 0.59002
Stop Loss: 0.58902
Take Profit: 0.59202
We entered on the retrace, and price moved smoothly in our favor. The difference here? We barely faced any drawdown on this trade as it moved straight to hit our TP putting us up 4% on the two trades
These setups reinforce why the Judas Swing Strategy is so effective in manipulated markets:
- We don’t chase breakouts we wait for the trap
- We don’t force trades we wait for displacement and confirmation
- We trust our backtested process even when we miss trades or price misses TP by a whisker
Not every trade will close out perfectly, but this method is built around structured logic and patience

EURJPY (BOS + 0.5 DEMAND + 0.5 FIB + IMB)Hello Traders!
Here we have BOS on 1H TF, and the reason of pullback is to mitigate our 0.5 fib level + 0.5 DEMAND and fully close imbalance, after i will wait for confirmation on LTF.
Have a profitable day and don't forget to subscribe for updates!

SUI - Leveraging Fibonacci & Elliott for Precision TradesSUI’s movement is rapid, sharp swings—both up and down. In volatile conditions like this, we aim 0.702–0.786 fib retracements (and occasionally 0.886 in harmonic contexts) for high‑probability entries. Below is a clear, Elliott-focused breakdown of the current setup and both long and short trade plans.
Before diving into the charts, let’s cover the basics of Elliott Wave Theory. Elliott Wave Theory provides a roadmap for market psychology by dividing price action into two distinct phases:
1. Impulse Phase (Waves 1–5)
Wave 1: The spark that ignites a new trend as early adopters push prices beyond the prior range.
Wave 2: A corrective pullback that tests the strength of the emerging trend, often retracing 38–61.8%.
Wave 3: The powerhouse wave—typically the longest and most dynamic—driven by broad market participation and often extending to key Fibonacci levels (1.618, 2.618).
Wave 4: A consolidating correction that digests gains and builds the base for the final thrust; it must not overlap Wave 1 territory in a classic impulse.
Wave 5: The final leg of the advance, often fueled by last bursts of optimism and weaker hands.
2. Corrective Phase (Waves A–B–C)
Wave A: Initial counter-trend reaction as profit-taking begins.
Wave B: A deceptive retracement back toward the trend, frequently trapping traders.
Wave C: The concluding leg of the correction, which typically tests or breaks the low of Wave A before the next cycle begins.
Key Points:
Impulse waves showcase momentum and structural clarity, often aligning with Fibonacci extensions.
Corrective waves follow Fibonacci retracements (38.2%, 50%, 61.8%), offering optimal entry points.
Wave 3 is seldom the shortest; Wave 4’s complexity sets the stage for Wave 5’s final push.
In the current SUI structure:
Wave 1 ignited the initial rally.
Wave 2 delivered a healthy retracement, a pullback close to the 0.618 fib, setting the stage for stronger momentum.
Wave 3 roared to a powerful peak topped at the 2.618 extension ($3.875)
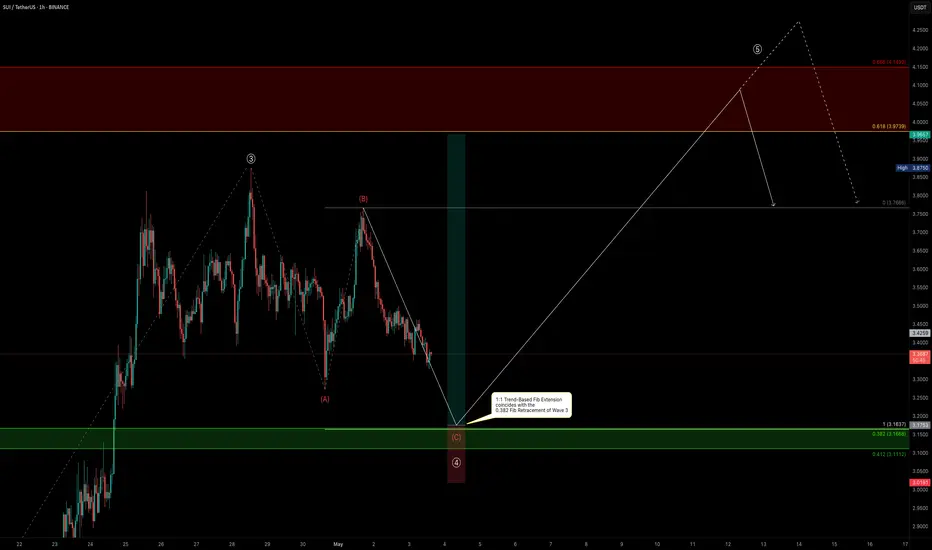
Now, we’re deep into Wave 4, likely an ABC corrective pattern. This pause is critical—it gathers energy before the final push of Wave 5. Below is a clear breakdown of each wave, big-picture confluences, and trade setups.
🚀 Elliott Wave Overview
1. Wave 1 & Wave 2
Wave 1: Quick surge from $2.4175 → $2.75, setting initial momentum.
Wave 2: Pulled back close to the 0.618 fib, creating a solid launchpad.
2. Wave 3: The Power Move
Peak: Hit the 2.618 extension of Wave 1→2 and aligned with the –2 extension of Wave 1.
Significance: In strong bull markets, a run to the 2.618 extension often precedes a meaningful pullback. Here, Wave 3’s exhaustion suggests a retrace toward the 38.2% Fib of that advance—our ideal Wave 4 entry zone.
3. Wave 4: The Correction
All eyes on the $3.17 level—the projected 1:1 extension of A→B and 0.382 fib retracement of Wave 3. This confluence zone is yet to be tested and could offer an ideal Wave 4 entry.
ABC Pattern: Currently working on Wave C.
4. Wave 5: The Finale
Target Zone: $4.00–$4.35, with strong focus at $4.31
Extension Levels:
1.133 → $3.9695 aligns with the 0.618 fib retracement.
1.272 → $4.0683 is close to the weekly resistance level.
1.412 → $4.1678 alings with the 0.666 fib retracement.
1.618 → $4.3142 alings with the key swing high.
🔑 Key Confluence Levels
Golden Pocket: $3.9739–$4.1492 (90-day retrace).
Speed Fan 0.618: Support around $3.15.
Fair Value Gap:
Psychological: $3.00 major support.
📈 Long Trade Setup
Entry Ladder: $3.25–$3.111 (stack orders to DCA)
Stop‑Loss: $3.07 (just below the 0.786 Fib low)
Profit Targets:
Fib 1.133 at $3.9795 ($4 psychological & partial take‑profit)
Fib 1.272 at $4.0683
Fib 1.412 at $4.1678
Fib 1.618 at $4.3142
Risk:Reward: ~6:1+ (average entry around $3.20 → SL at $3.07 → TP1 at $3.9795)
📉 Short Trade Setup
Entry Zone: $4.00–$4.35 (sweet spot at weekly level/yearly open)
Confirmation: Bearish reversal candle or volume spike down
Stop‑Loss: Above $4.35
Target: $3.77 (near Wave 3 high turned support)
Risk:Reward: ~2:1 (varies with DCA entry)
⚙️ Summary & Game Plan
Primary Bias: Long in the $3.25–$3.111 zone—stack into the 0.382-0.412 fib retracement entries with tight SL, aiming for the $4.00–$4.30 upside zone.
Alternate Bias: Short on a clear rejection within $4.00–$4.35, targeting $3.77 or lower.
Risk Management: Keep stops tight to maximize R:R.
Patience & Confirmation: Wait for price to reach these zones and show reversal signals (price action, volume, patterns) before committing.
All set—now let SUI’s swings unveil the opportunities. Sit tight, follow your plan, and let patience pay its dividend.
Happy Trading!
____________________________________
If you found this helpful, leave a like and comment below! Got requests for the next technical analysis? Let me know.
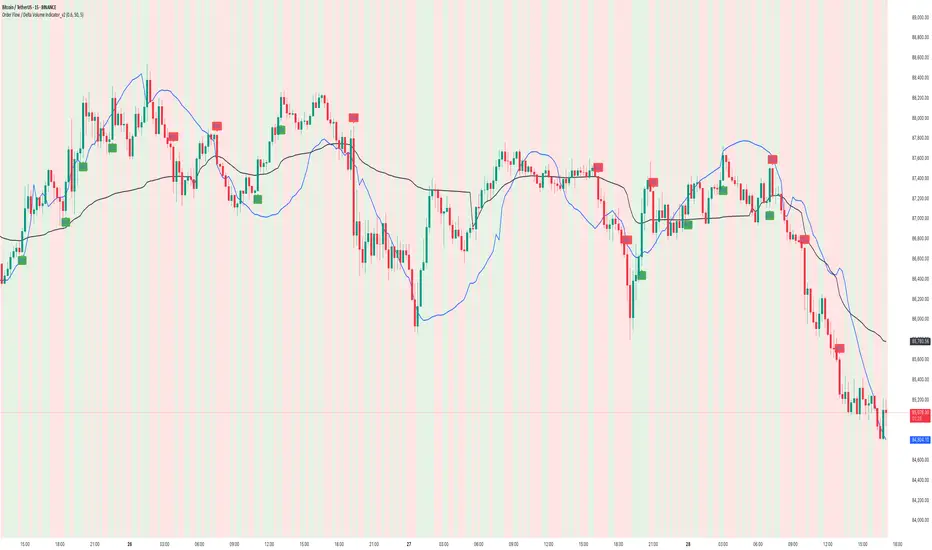
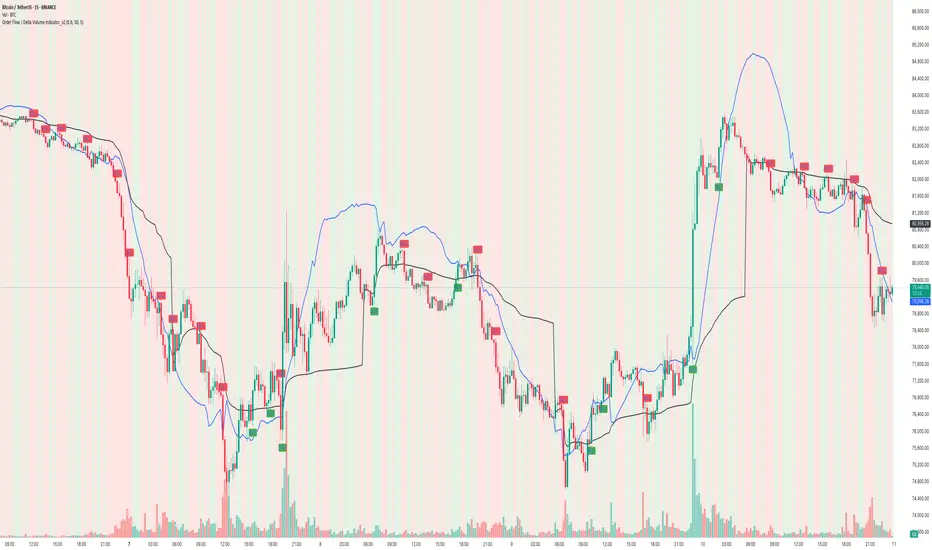
HOW To use Order Flow / Delta Volume Indicator to identify TrapOrder Flow / Delta Volume Indicator: Performance & Trap Identification Analysis
### Overview
The Order Flow / Delta Volume Indicator analyzes real-time buying and selling imbalances , accurately capturing momentum shifts and highlighting potential market traps . This analysis clearly demonstrates the indicator’s effectiveness in pinpointing trend reversals, momentum shifts, and identifying price traps.
Indicator Functionality
- ** Order Flow Dynamics **: Tracks cumulative buy/sell volumes, indicating shifts in market sentiment.
- ** Delta Volume Analysis* *: Highlights buyer-seller imbalances, pinpointing precise moments of significant market activity or divergences.
- **Signal Logic**:
- ** Buy Signals **: Generated when positive order flow aligns with positive delta, suggesting buying dominance.
- ** Sell Signals **: Produced when negative order flow and negative delta indicate increased selling pressure.
- ** Trap Identification **: Divergence between cumulative delta and price direction signals potential market traps . For instance, rising prices with declining cumulative delta suggest weakening buying pressure and possible bearish reversals (traps).
Performance Insights (from chart)
1. **Bullish & Bearish Signal Accuracy**
- Clear, timely bullish and bearish signals aligned precisely with genuine market momentum shifts.
- Robust performance capturing sharp upward and downward price movements, validated by volume spikes.
2. **Effective Market Trap Identification**
- Detected key divergences between cumulative delta and price movement, effectively highlighting potential market traps.
- Example highlighted: recent market scenario where price rose while cumulative delta declined, signaling weakening bullish momentum and indicating a potential bearish reversal.
3. **Momentum Shift Reliability**
- Successfully differentiated significant momentum changes from short-lived price movements.
- Signals consistently matched subsequent market behavior, reinforcing the indicator’s reliability.
Key Takeaways
✅ Accurate and timely identification of trend reversals and continuation.
✅ Effective in highlighting divergences, significantly aiding in identifying market traps.
✅ Clear volume-based signals, ensuring traders can easily interpret market conditions.
✅ Consistent performance across diverse market scenarios, demonstrating strong analytical capability.
The Order Flow / Delta Volume Indicator remains an essential tool, reliably capturing crucial market turns and effectively highlighting potential traps through clear cumulative delta divergences.
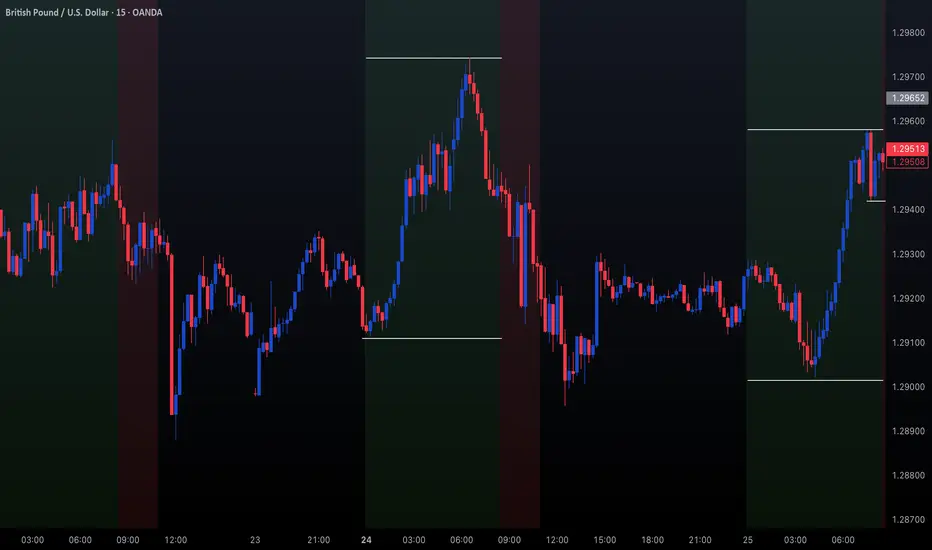
Trading GBPUSD | Judas Swing Strategy 25/03/2025We had a good trading session with the Judas Swing Strategy two weeks ago, as the strategy delivered 3 solid setups, 2 on FX:EURUSD and 1 on $GBPUSD. And guess what? All three hit their targets!
That’s a massive 6% gain for the week! And with these impressive results we wanted to see how the strategy will perform last week.
The strategy did not produce any setups on the currency pair we monitor ( FX:EURUSD , FX:GBPUSD , FX:AUDUSD , OANDA:NZDUSD ) on Monday 24th March and instead of forcing setups like other traders would we sat that day out. Why was this possible? we had backtested the strategy and had enough data to prove that when we stick to this strategy long term we'd be in putting ourselves in a profitable position.
On Tuesday, we returned to the trading desk, scouting for setups, when we noticed a potential opportunity on $GBPUSD. The currency pair had swept liquidity at the high of our zone, signaling a possible shift in direction. We then shifted our focus to selling opportunities for the session. Our strategy required waiting for a break of structure to the downside, followed by a retracement into the FVG before executing a trade
After waiting for an hour and 15 minutes, we finally got the break of structure to the downside. The only step left was a retrace into the FVG. After some patience, the retrace materialized, meeting all the criteria on our entry checklist. We executed the trade, risking 1% of our account with a target return of 2%
Trade Details:
Entry: 1.29513
Stop Loss: 1.29611
Take Profit: 1.29311
After entering the trade, price consolidated around our entry point for a while, showing no clear direction. However, we remained unfazed, trusting our well-backtested strategy, which has a 50% win rate. With a 1:2 risk-reward ratio, we know that consistently following our strategy will yield profits in the long run. Since we had risked only what we could afford to lose, the slow price movement didn’t shake our confidence
Unfortunately, this trade didn’t go in our favor and ended up hitting our stop loss. This serves as a reminder that not every trade will reach take profit and that’s perfectly okay. Losses are an inevitable part of trading, but what truly matters is maintaining a solid risk management strategy, sticking to a proven system, and thinking long-term. As traders, our edge comes not from winning every trade, but from executing consistently and letting probabilities play out over time
How to Spot Market Turns using Order Flow & Delta Volume Ind.Overview
The Order Flow / Delta Volume Indicator combines order flow dynamics with delta volume analysis , pinpointing market shifts by tracking buying and selling pressure . This chart analysis demonstrates how effectively the indicator identifies precise moments of market turns and shifts in momentum.
How It Works
Order Flow Dynamics
Tracks cumulative buying and selling volumes.
Identifies potential reversals by highlighting shifts in order flow direction.
Delta Volume Analysis
Measures the difference between buying and selling volume (delta).
Pinpoints exact candles where buyer-seller imbalance occurs.
Signal Generation Logic
Buy signals emerge when order flow and delta volume confirm rising buying pressure.
Sell signals appear when order flow combined with negative delta signals increased selling activity.
Signal Confirmation (Magical part of this Indicator), Blue line inlines with trend to confirm the strength, else it's a trap move.
Performance in This Case Study
Market Reversal Precision
Accurately highlighted buy signals at key reversal points where bullish order flow resumed.
Provided timely sell signals precisely at points of bearish order flow dominance.
Trend Confirmation
Signals effectively filtered market noise, clearly distinguishing actual trend shifts from temporary price fluctuations.
Consistent alignment of signals with subsequent price action confirmed robust indicator performance.
Volume-Based Clarity (Blue Line)
Delta volume effectively differentiated real momentum changes from false breakouts.
Order flow dynamics reliably indicated market sentiment shifts, offering clarity in volatile conditions.
Key Takeaways
✅ Order flow shifts clearly indicated genuine trend reversals.
✅ Delta volume accurately pinpointed moments of market imbalance.
✅ Signals reliably differentiated between temporary fluctuations and meaningful market movements.
✅ Indicator performance remained robust across varying market conditions.
This indicator's precise alignment with market behavior underscores its practical utility in identifying and analyzing market turns.