Cardano (ADA) goin shortHi everyone. today we're going to be looking at ADA.
price currently broke support zone with a bearish impulsive move. and we all know after an impulse, we see correction, and ADA price is currently in correction phase forming an ascending channel. this ascending channel acts a retest on previous support now resistance, and I expect to see a bearish impulsive move to the downside after the breakout of the channel.
conclusion: ADA is going short.
Disclaimer: I don't predict the market movement, I react to it.
if you like my analysis please don't forget to like and follow to get updated anytime I make analysis.
Thank you :()
Impulsecorrectioncontinuation

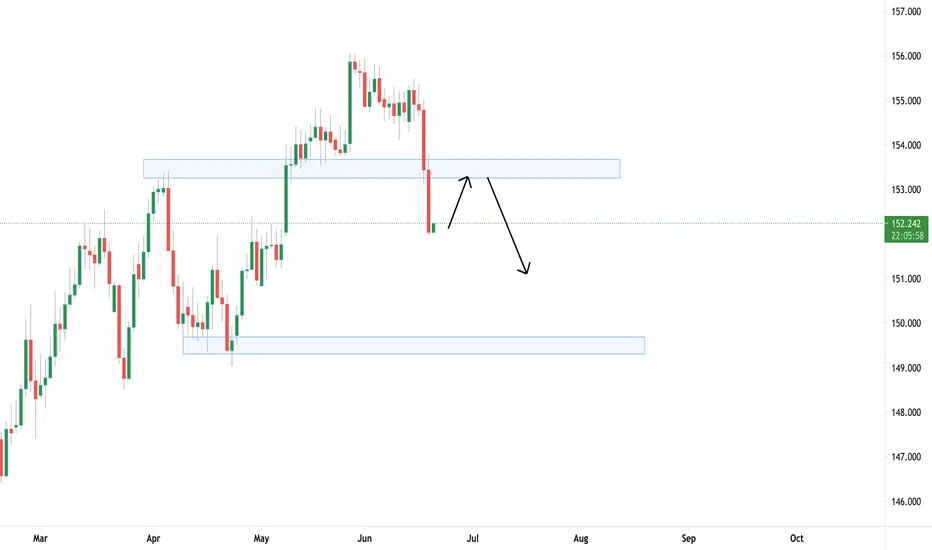
GBPJPYPrice is over extended to the downside. Now looking for a pull back or retest to continue to ride the bearish waves!
GBPUSDThe bears are in control but we could see a pull back from this psychological level of 1.3800 to retest some structure levels before more downside. Will see how price react!

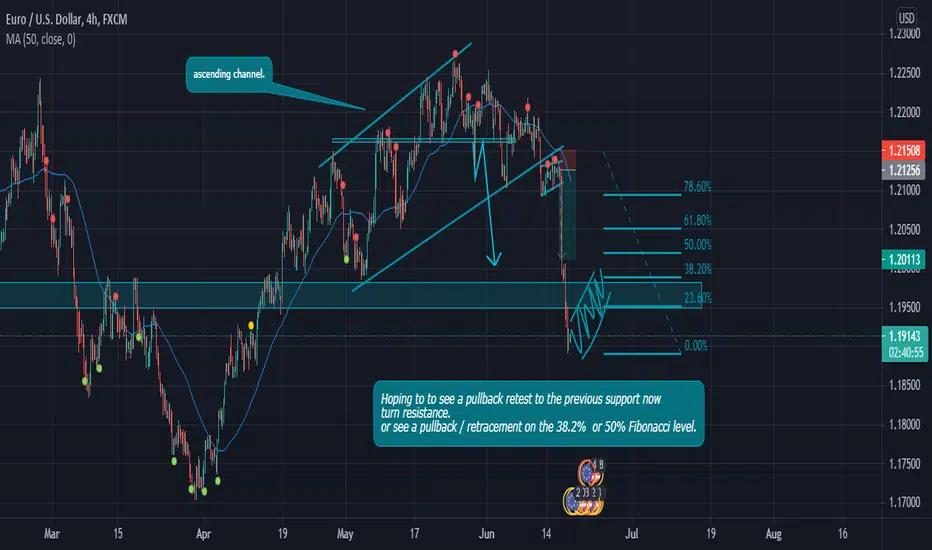
looking for retracement or pullback on EURUSDhi guys. we've seen an bearish impulsive move on the EURUSD, and now i hope to see a correction (like an ascending channel which shows impulse continuation). or if we could see a sharp retest on the previous support now resistance or on the Fibonacci level 38.2% or 50%.
this are probably reasons for my next entry on this pair.
Good Luck, trade carefully. and ensure you have your risk-reward management
like and follow. Thanks You
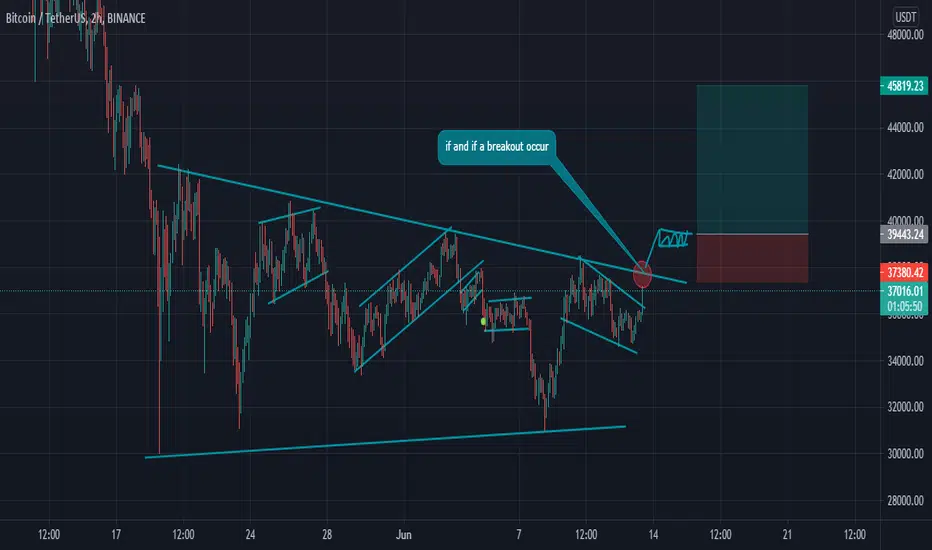
Bullish outlookhi guys. We're looking at BTCUSDT.
Firstly we can see BTCUSDT is in the correction phase and has formed a parallel channel // Triangle. In-between channel or triangle we can see a flag. this is the pattern that might pump the price above the channel (Impulsive breakout). then we look for impulsive continuation (small correction) before we enter the trade.
trade carefully and remember your RR management.
Weekly outlook CHFJPYhi guys. today we're going to be looking at CHFJPY.
firstly HS pattern was formed on a LTF and its close to a resistance level.
and we all know HS patter is a bearish reversal pattern. This mean we should be looking for bearish entry for the week.
Secondly its consolidating and forming an ascending channel, this also is a bearish pattern, therefore am looking forward to more development in price, I.e. a impulsive breakout below the channel, and consolidation ( confirmation that the correction is over).
trade carefully and remember your risk management.
have a great weekend :)

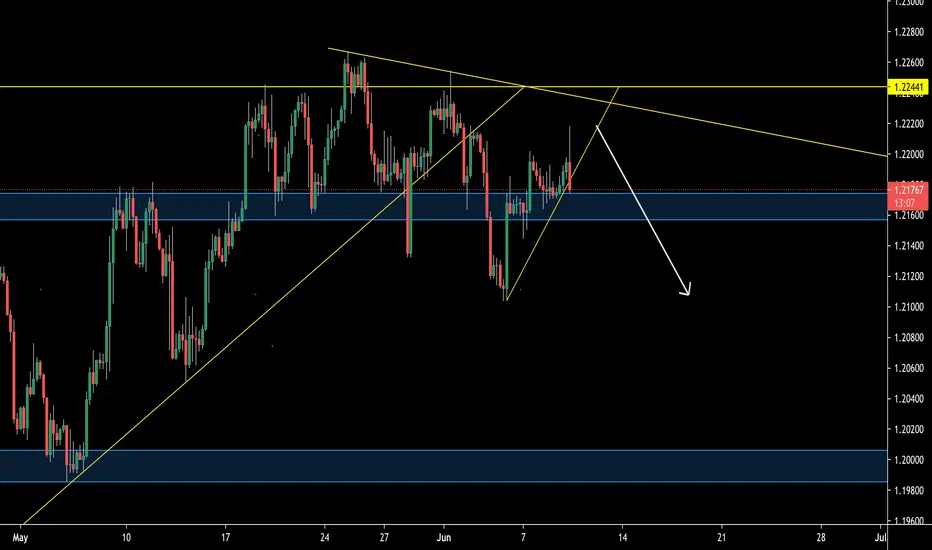
EURUSDLooking to sell the breakdown on EU with lower high forming for potential continued bearish wave !
Bearish Continuation + LTF Flag entryWe're currently in a Daily Bear Flag, Price is developing beautifully, what I'm waiting on now is a break out and a LTF Flag for the entry. A lot of room to the downside.

HTF Bullish Continuation Correction+ LTF Flag entryBullish bias on this one. Looking for LTF CAB for the entry. But I'm a little cautious, don't want to impulsively jump in as we just had an aggressive impulse ,so I need to see the correction before taking this.

Horizontal Correction + LTF Flag entryAnother play where I'm kinda neutral waiting on this horizontal correction to complete. then I'll take whichever LTF CAB Entry present itself whether to the upside or downside. I know a lot of people who are bullish on this one. I'm neutral because on the weekly Timeframe the structure is a bit more on the ascending side. Therefore we are still in a high value area to keep shorting.

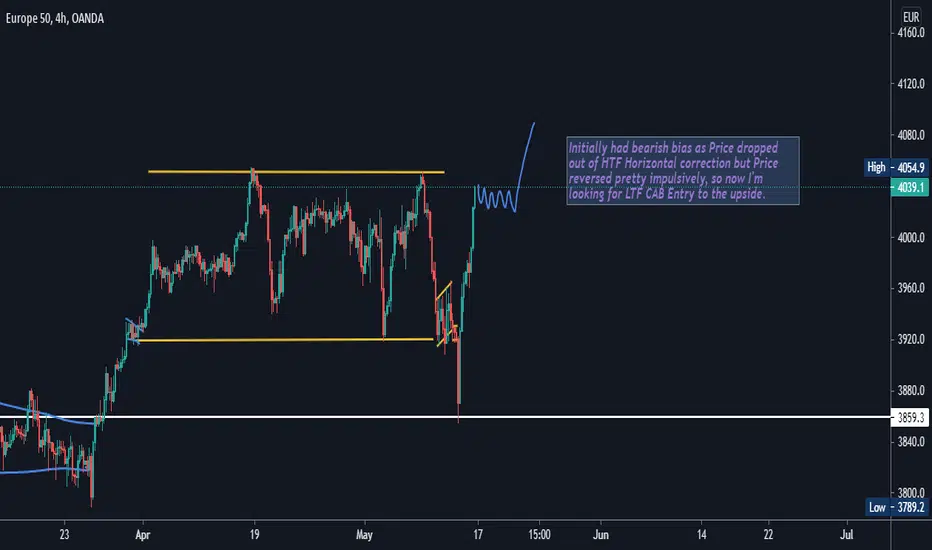
Horizontal Continuation Correction + LTF Flag entryInitially had bearish bias as Price dropped out of HTF Horizontal correction but Price reversed pretty impulsively, so now I'm looking for LTF CAB Entry to the upside.
Horizontal HTF Correction + LTF Flag entryMinimum of 2 swing highs and 2 swing lows to be considered structure. Looking for LTF CAB Entry. But remembering that Horizontal corrections are neutral. So I'll be looking for the same thing if Price starts dropping.

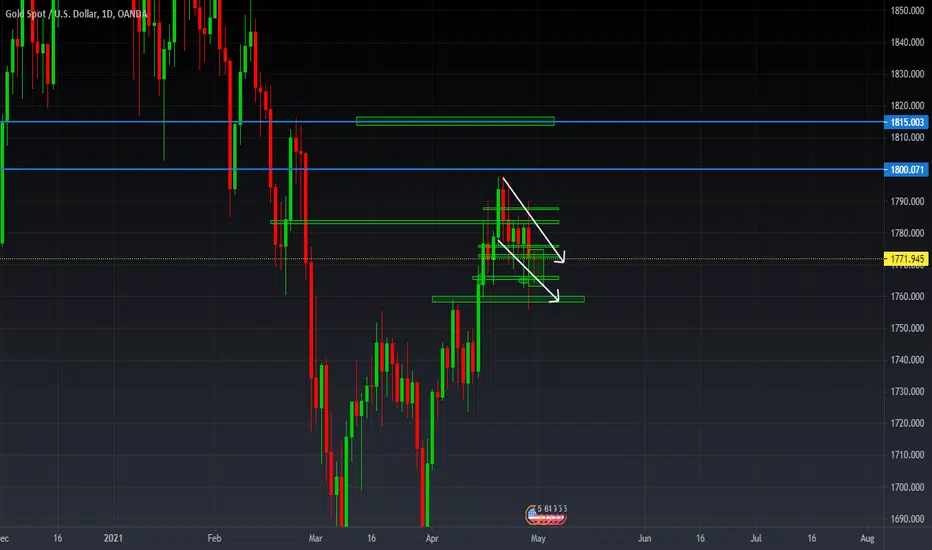
XAUUSD PREMARKET ANALYSIS- 5 May, 2021, 1611 CTOVERALL TREND BIAS- BULLISH
Price movement- consolidating in a channel the past couple of days before market closure.
This looks like bullish flag pattern that's forming on the daily TF and multiple wick rejections to the downside signify a strong bullish trend that may push the price higher.
Looking for only buy setups here. and targetting the 1800 and 1815 ranges this week as potential TP levels.
How to Trade Price Action Daily!Hello Fellow Traders, Here is a Educational Video (How to Trade Impulse/Correction/Impulse) .
Key things to Remember:
When Trading This Type Of method - You Should Always have an Open mind when it comes to "Where the Market will Finish The correction"
The Strongest Levels of Fibonacci is the 61.8 & 38.2 (These Are Generally the levels that the Market Loves to Finish its correction)
The Best way to follow This Method is if the following conditions apply.
Conditions -
1. Look & Find a Big Impulse On bigger Timeframes (Weekly, Daily or 4Hours)
2. Wait for The Market to Finish its Impulse (You will notice the market starts to move the opposite direction to the original Impulse)
3. Pull Your Fibonacci From The Start Of the Impulse to the End of the Impulse Aka ( From high to low = Sell OR Low to High= Buy)
4. Be Patient and wait for the Market to Reach the Aka Strong Levels (61.8 Or 32.8) OR Which Ever is Better Align With Good Structure!
5. Once you Have a smaller Timeframe break of structure or Momentum Change (You will look for an Entry Based on Market Environment + Structure)
6. Enter Your Trade Preferably of 1hOur Or 4hour Timeframe (whichever has given confirmation mentioned in point 4)
7. Always Use Risk Management / 1% Risk to Trade Entries using this Method
8. Patience is the Key to Success!
Let Me know if you have any Questions or Comments Below!
Your Support Is Appreciated!
Happy Trading & Goodluck!
See You in the Next Educational Video!
Global Fx Education

EURAUD After a bearish impulse price created bearish engulfing on the daily, now on smaller time frame we can watch for a pull back opportunity for continued sell opportunity!

XRPUSD Can break the downtrend channel ???BITSTAMP:XRPUSD
After the impulse in daily time frame and make a correction to 50% in fib Retracement ,
we can expect the price Can break the downtrend channel and make a higher high in next week.
Then if the market shift from the bearish to bullish we can make a long position.
What do you think???
ENTRY PRICE= 1.66180
T/P = 2.09820
S/L = 1.51630
Risk/Reward Ratio : 3.00

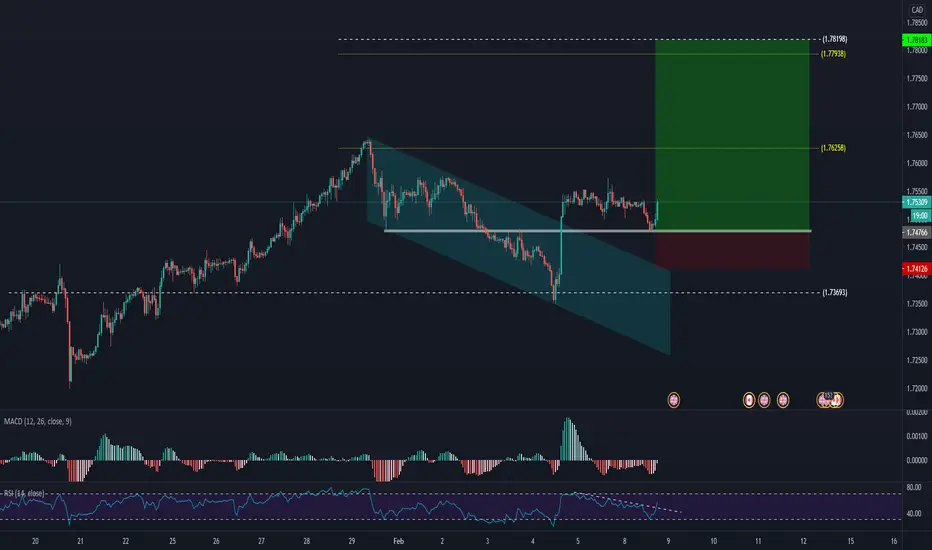
Continuation after the Breakout + LTF Flag entryEURCAD has a very nice long term bulllish bias. Missed the entry at the breakout of Previous descending channel but Price looks to be making HTF continuation correction. We are looking for Impulsive break plus LTF correction for the entry.

EurCad SellEurCad having been bearish since the beginning of the week, gave an impulsive bearish move followed by a bullish corrective structure, I couldn't find an entry at the top of the channel, but right now, I think the corrective structure has come to an end, hence, a sell continues

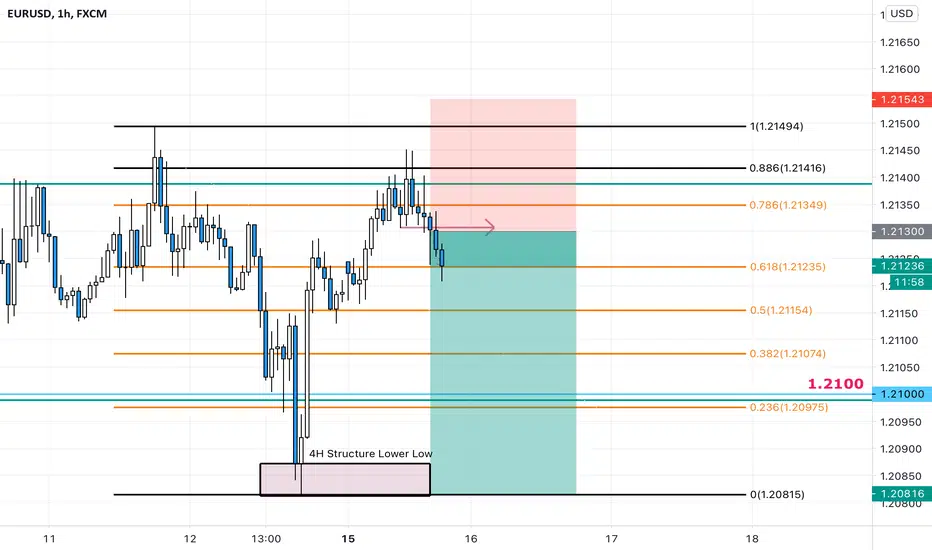
EURUSD Short 4H impulseThe 1H structure has finally shifted structure from Bullish to Bearish by creating a Lower Low. I entered short when the Higher Low was broken. Will be looking to scaling in if price and structure gives chance.
Note:
This is only for educational purposes only and not signal.
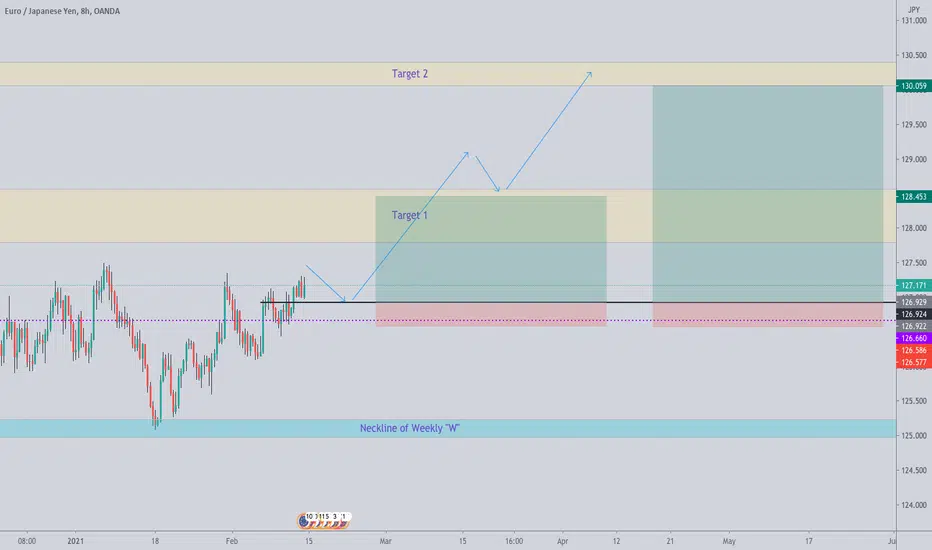
EUR/JPY Full AnalysisGood day Traders !! On this multi-timeframe analysis we will make a full breakdown of this pair.
Monthly : We Have an "W" Formation and we and we already started new impulse and broken previous High .
Weekly : We also have an overextended "W" formation as well and we completed the pattern. We should see a continuation to the upside.
Daily : We have a formation of a new "W" pattern and we will be placing our entry at the neckline of this W formation and wait for the market to shift from a bearish market to a bullish market on lower timeframe to execute the trade .
COT : Institution have been decreasing net positions in JPY since they closed more than 8500 long positions and added to 1100 Short position during the last report.
From an EUR perspective hedge funds added more longs positions than shorts and this explains the fact that there will be a lot of buy limits on this pair and then support our idea of correction in the market.
8H: We are currently super bullish and we will be monitoring price action around the Entry area for the environment to shift from a bullish to a bearish environment so we can execute our entry for a good R:R trade setup.
Now if you enjoyed this analysis smash that like button and share. If you have a different opinion please leave a comment below as I would love to get more insights and ideas. I also linked my previous idea about this asset. You can also leave a comment and let me know which pair you'd like me to analyze in my next idea.
Trade safe !!!
GBPCAD-1H-Long PotentailHi folks;
On the GBPCAD pair we find a nice long position for long traders.
Hope enjoy guys
I look forward to hearing from you please PUT YOUR COMMENT HERE.
GOLD to the Moon 🚀🚀🚀Good Day Traders !!! We just rejected for the third time this strong level of support around 1855-1853. We expect gold to start his impulse to the upside since we can clearly see that on the Daily we clearly tested almost all the level of the fib retracement during the correction and we expect to see a continuation to the upside. Also from an institutional perspective I can see on the last report from the non commercial institutions a massive number of long position added as well as a big amount of short positions being closed which can mean a strong gold during this week.
Now if you enjoyed this analysis smash that like button and share !! If you have a different opinion I would love to hear about it in the comment area.
Trade safe !!

USDJPY - TWO opportunities - correction then longUSDJPY On the weekly timeframe market has rejected support and formed a new higher high breaking the bearish strucure, on the daily market has made a new HH forming this inverted head and shoulders and made a impulse to the the upside breaking the daily downtrend. After a impulse you can expect to see a correction, also on the daily TF we have this W formation in which we expect the market to complete this pattern at the neckline, we could look for a intraday short to catch the corrective move if all entry rules are met on a the lower timeframes, then look to capitalise on a big swing move to the upside to form a new higher high from a daily perspective.
(All of rules have to be met first before we can take any position based on this analysis)
