USDCHF Signals Wave 3 With Double Bottom!OANDA:USDCHF has not only formed a Double Bottom Pattern but also may be generating a potential Elliot Impulse Wave!
Bulls are giving the April & June Lows of .8038 - .8088, another go for a second time today after surpassing the first attempted High created July 17th to break above the level.
So far Price today has broken above July 17th Highs and if Bulls are able to hold this level, this would Confirm:
1) A Breakout of the Double Bottom
2) Wave 3 continuing the Impulse Wave in the Elliot Wave Theory!
The Higher Low @ .79106 created on July 25th, broke the downtrend structure as a 78.6% retracement of the Lower Low @ .78719 created July 1st which was a new 14 Year Low, finishing Wave 2 and initiating Wave 3 of the Impulse Wave.
The Extension of Wave 3 typically will end at the 1.236% or 1.618% level which gives us 2 potential Price Targets to start:
Price Target 1) .81479 - 1.236%
Price Target 2) .82213 - 1.618%
Once Wave 3 has ended, we will look for opportunities at the Wave 4 - Wave 5 juncture!
Impulsewave

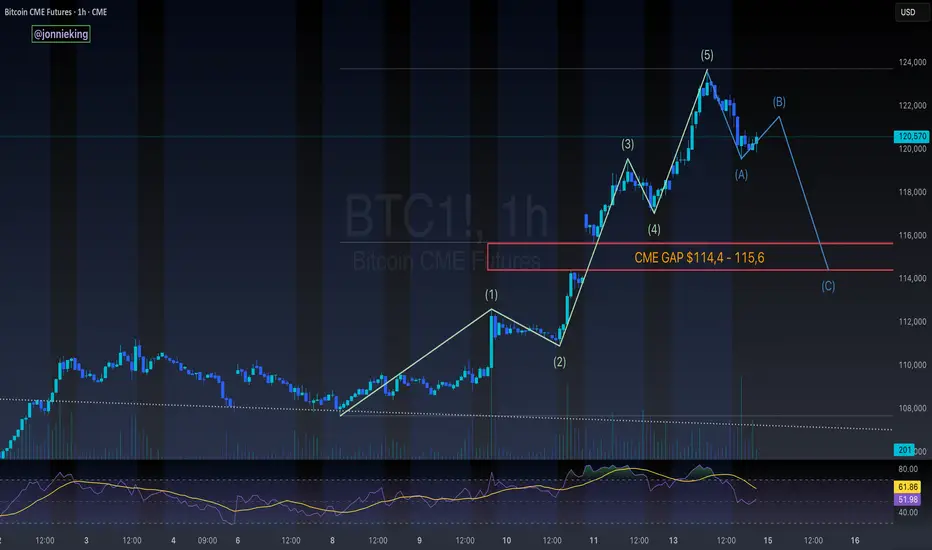
$BTC 5-Wave Impulse > ABC Correction > CME GapCRYPTOCAP:BTC appears to be headed towards an ABC correction after this impulsive 5-wave move to the upside
Would be a great opportunity to fill the CME gap ~$114k
Lines up perfectly with the 50% gann level retracement to confirm the next leg
don't shoot the messenger..
just sharing what i'm seeing 🥸
Good move is expected soonhi fellas,
The Weekly trend of cochin shipyard is solid and bullish.
At daily timeframe there is a swing whose target can be till the weekly resistance level as mentioned in the chart.
The risk : reward ratio is 1:3.87
Enter after the daily candle closes above 2243.70
SL and target is mentioned in the chart.
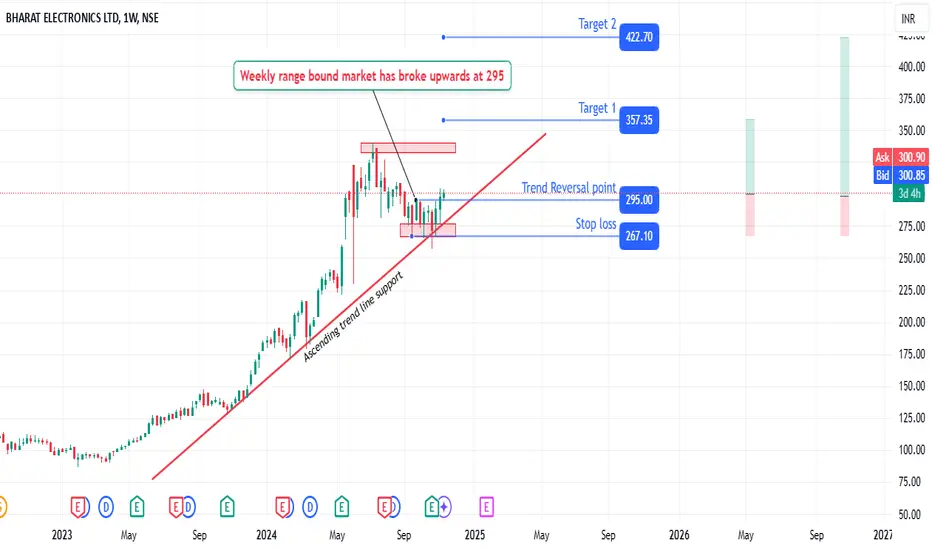
Range breakout | Impulse of bull starthi Traders,
1. The swing formation is solid
2. BEL has taken the ascending trend line support.
3. The the range bound is weekly has broke upward, leading to impulse wave of bull trend.
4. Projected Target 1 and Target 2 with 20% and 40% returns from the CMP with 1:81 and 1:4.01 risk reward ratio respectively.
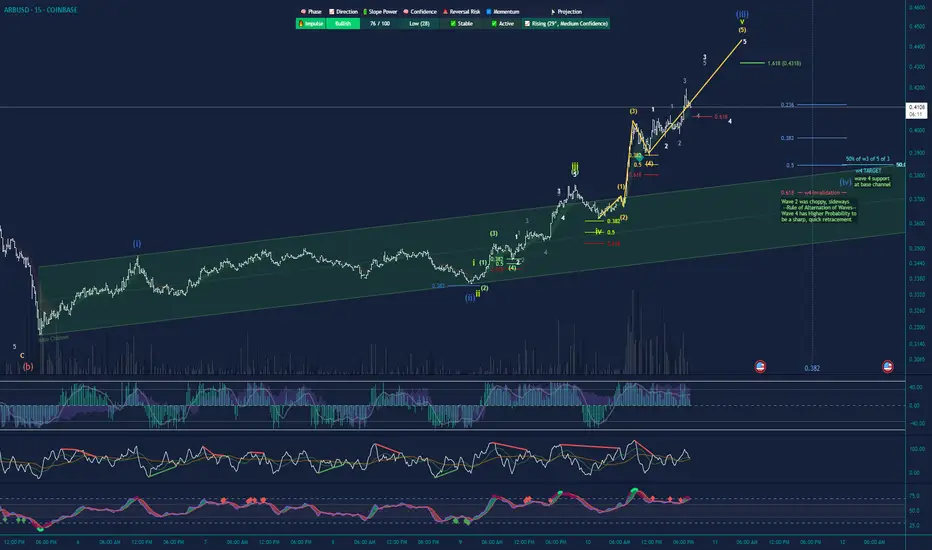
ALTS Bullish! Lots of wave 3 Bullish Impulsive patterns forming!This is an update to my past 3 Arbitrum posts. Clear impulsive price action, highest volume, indicative of wave 3s/extended waves. Lots of extensions of subwaves going on in the middle of the sandwich ( 3rd wave of blue wave 3 ), Happy Trading. NOT FINANCIAL ADVICE
"Markets can remain irrational longer than you can remain solvent"
COINBASE:ARBUSD
AUDJPY Begins Elliot Correction After Wave 5 Impulse EndsOANDA:AUDJPY seems to have started a Elliot Correction Wave after the Impulsive Elliot Wave came to a finish once Wave 5 ended this morning @ 93.774.
Now after an Impulsive Wave ends, its theory that a Correction comes next and with Price having Retraced to the Golden Ratio creating a Lower High, this is the beginning signs of that theory in the works!
The Sequence will be confirmed once Price Breaks below Point A @ 93.248 where then we should suspect Price to find itself back down into the 92 range where the Correction Wave should come to an end.
RSI is trading back below 50 confirming Price has room to move lower strengthening the Bearish Bias.

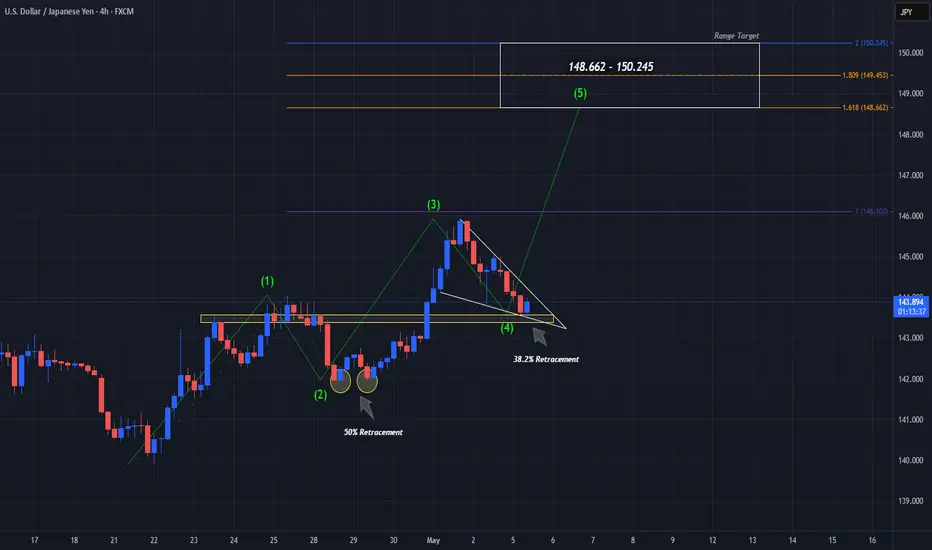
UJ Impulse Wave 5 IncomingFX:USDJPY seems to have finished Wave 4 being a Correction Wave of the Elliot Wave Theory and looks to be prepping for the start of Wave 5 being an Impulse Wave!
Now Price has not only made a 38.2% Retracement to 143.6 of the 145.941 Swing High that ended Wave 3 but is testing Break of Previous Structure being Past Resistance attempting to turn it into Support if enough Buyers enter the market in this opportune area.
Price Action during the Correction of Wave 4 has formed a Falling Wedge Pattern, typically seen as a Continuation Pattern. For this to be fact, we will need to see a Bullish Breakout to the Falling Resistance followed by a successful Retest of the Break where the Long Opportunities should present themselves.
Once Wave 5 is confirmed, we can expect Price to work from here and potential reach the Potential Range Target of ( 148.662 - 150.245 )
Gold Drop to 3256Hello traders! The impulse wave is down, there is a correction, and another impulse wave has started. I expect it to reach 3256.

XAUUSD Potential rise There is an upward impulse wave and a correction pattern. Another upward impulse wave is expected.
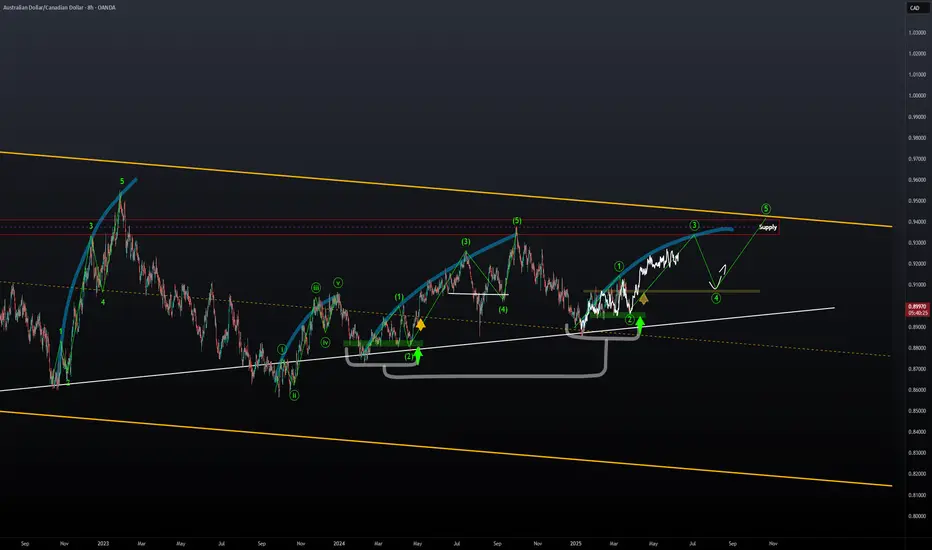
AUDCAD | Reoccurring FractalsWe're looking at 3 complete fractals and the fourth one being the current one. Same phase as the last, a bit of sideways trading/consolidation then aggressive buying breaking out to the upside.
Price action has been trending upwards with HHs and HLs and we're currently at a Lower High bouncing off the lower trendline below.
Would be ideal to look for long positions only for this setup as bulls are looking stronger from this view.
~300pips going into the 3rd wave.
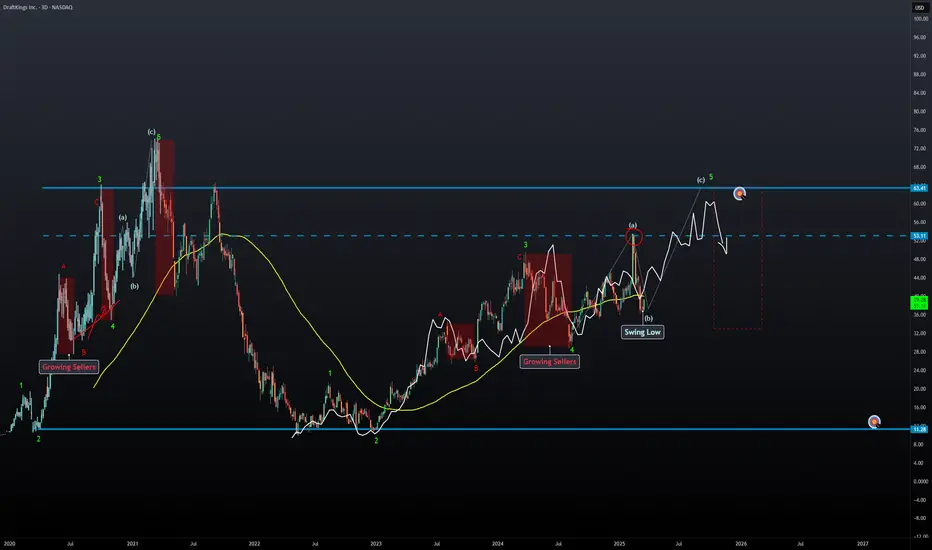
DKNG Update | Crash AheadOne of the best fractal overlays I've seen with some Elliott Waves to go with it.
Price is still in a uptrend but with growing sellers It'll come to an end similar to the last fractal.
During the 3rd wave in the last pattern price experienced its first pullback at (B), and its second at correction wave 4 and the third after the last wave before we witnessed the last push in buyers.
This current cycle price is in a similar stage with a swing low at (b) meaning that we could see another run-up towards major resistance ($63).
This would be the final blow-off-top in general markets. TVC:RUT is already showing signs of weakness which works well with this TA example.
When the time is right I'll do another TA for the downfall. For now I'm bullish but for the horizon I'm very bearish.
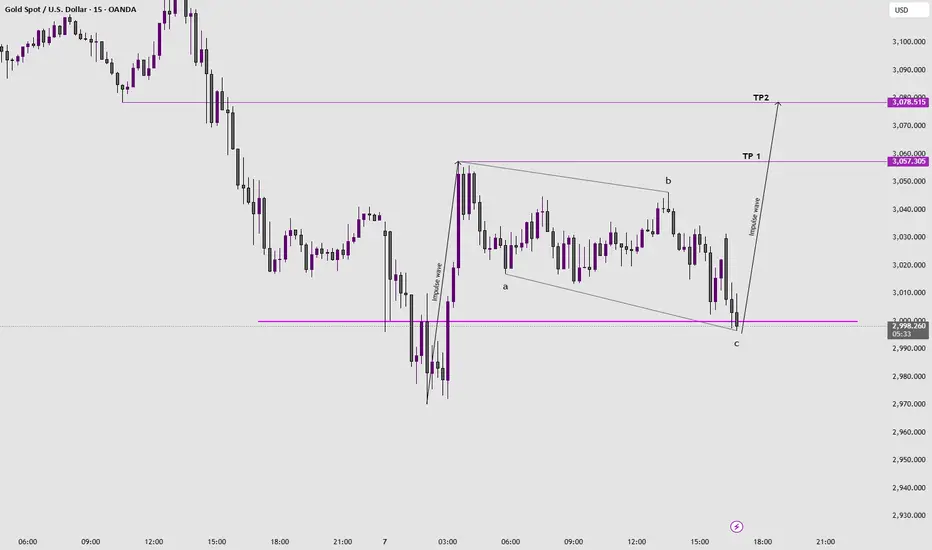
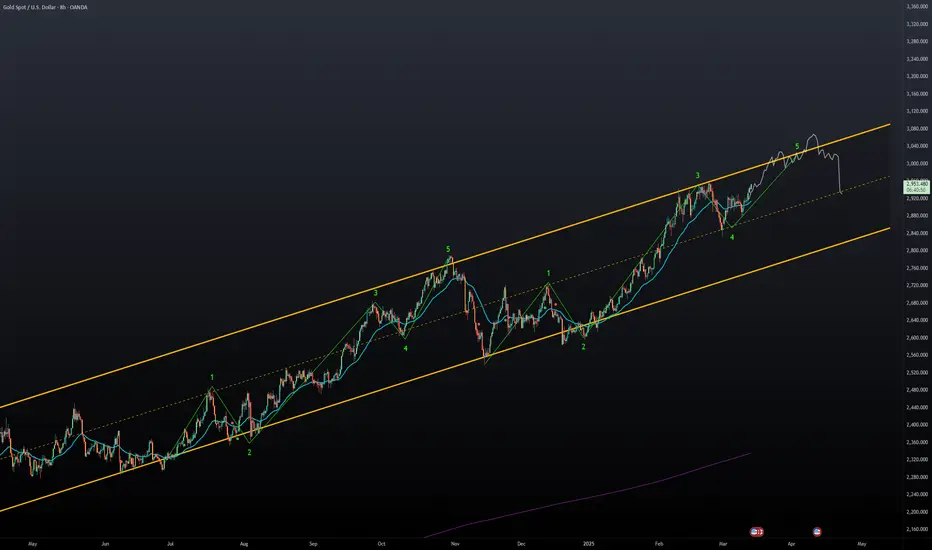
Gold Update | $3k+ Then DumpSimilar to my last gold post we're tracking price using another method, parallel channels and Elliott Impulse Wave.
Price finished correction wave 4 and is now on impulse wave 5 that will take us to $3k+
I'm interested in long positions only working with a 30d - MA. This will help with entries and further price movement on the way up.
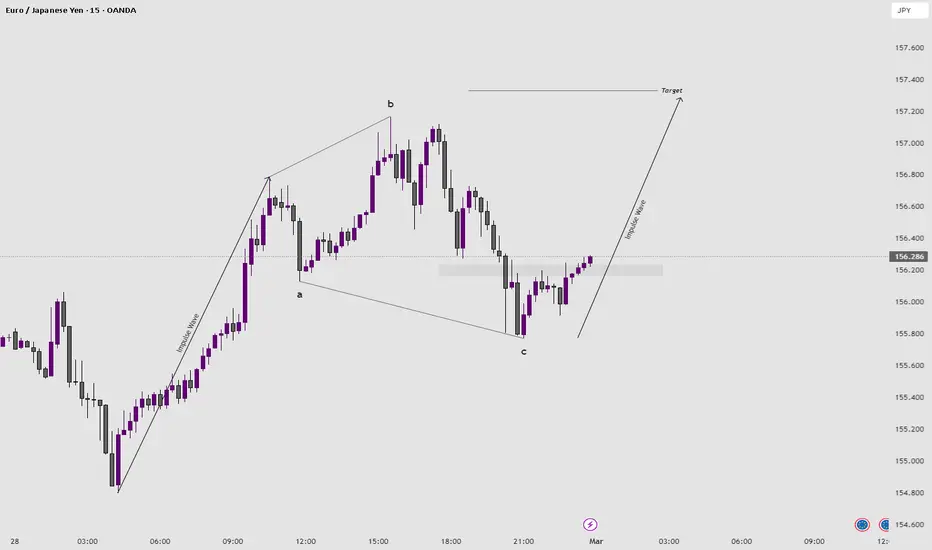
Potential upside for EUR/JPYHello traders
The impulse wave for EUR/JPY is rising and there is an expanding pattern. I expect another impulse wave to rise.
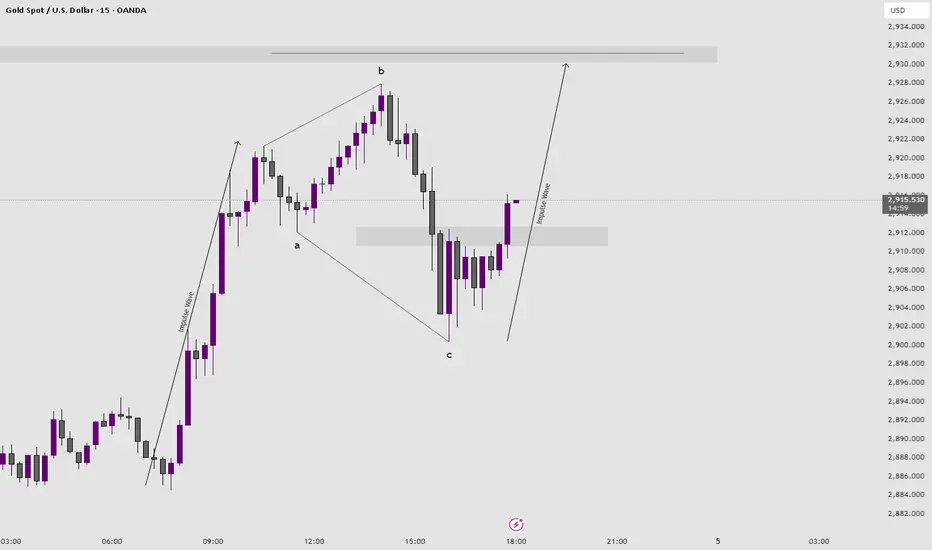
Potential rise for goldHello traders
there is an upward momentum and an expanding correction pattern, another upward wave is expected.
EURUSD 240 MINS CHART TIME FRAMEThe Structure looks good to us, waiting for this instrument to correct and then give us these opportunities as shown on this instrument (Price Chart).
Note: Its my view only and its for educational purpose only. Only who has got knowledge about this strategy, will understand what to be done on this setup. its purely based on my technical analysis only (strategies). we don't focus on the short term moves, we look for only for Bullish or Bearish Impulsive moves on the setups after a good price action is formed as per the strategy. we never get into corrective moves. because it will test our patience and also it will be a bullish or a bearish trap. and try trade the big moves.
We do not get into bullish or bearish traps. We anticipate and get into only big bullish or bearish moves (Impulsive Moves). Just ride the Bullish or Bearish Impulsive Move. Learn & Know the Complete Market Cycle.
Buy Low and Sell High Concept. Buy at Cheaper Price and Sell at Expensive Price.
Please keep your comments useful & respectful.
Keep it simple, keep it Unique.
Thanks for your support
Tradelikemee Academy
Saanjayy KG

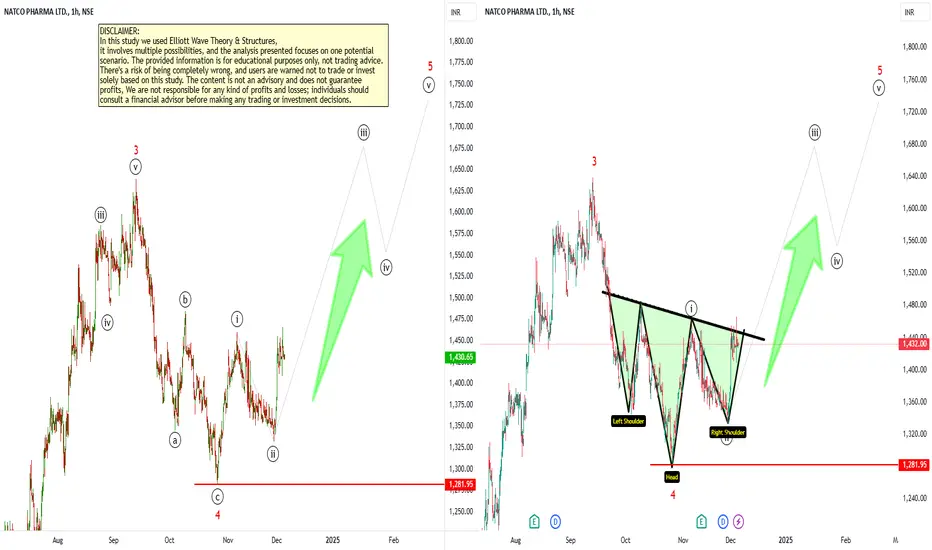
Chart say everything with Elliott wave counts and Chart PatternsChart say everything with Elliott wave counts and Chart Patterns
Looks like Inverted Head n Shoulder chart pattern, yet to Break above Neckline.
Scenario also aligns with Impulse wave counts.
Elliott Wave Counts
Inverted Head n Shoulder Chart Pattern Yet to confirm Breakout
I am not Sebi registered analyst.
My studies are for educational purpose only.
Please Consult your financial advisor before trading or investing.
I am not responsible for any kinds of your profits and your losses.
Most investors treat trading as a hobby because they have a full-time job doing something else.
However, If you treat trading like a business, it will pay you like a business.
If you treat like a hobby, hobbies don't pay, they cost you...!
Hope this post is helpful to community
Thanks
RK💕
Disclaimer and Risk Warning.
The analysis and discussion provided on in.tradingview.com is intended for educational purposes only and should not be relied upon for trading decisions. RK_Charts is not an investment adviser and the information provided here should not be taken as professional investment advice. Before buying or selling any investments, securities, or precious metals, it is recommended that you conduct your own due diligence. RK_Charts does not share in your profits and will not take responsibility for any losses you may incur. So Please Consult your financial advisor before trading or investing.
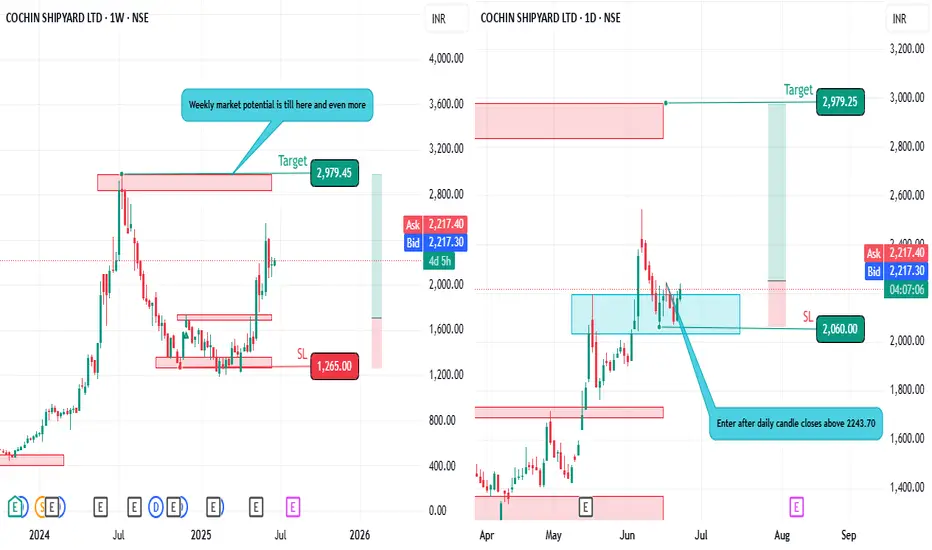
Jackpot | The begin of impulsehello fellas,
The monthly swing has corrected for about 61%, now at weekly/Daily there is a clear indication of the trend change to buy after the correction.
The impulse of the weekly swing has begun, the market can move to the previous high(2979.45) which is 80% from the CMP.
The risk : reward is 1:3.45

Start of the impulse wave | DB breakouthello fellow traders,
Trent has taken support on ascending trendline and impulse wave of the bull swing at weekly time frame has started.
The the DB neckline breakout at daily time frame was the trend change confirmation.
The target 1 is 22% and target 2 is 42% from CMP respectively
Risk reward ratio for the target 1 is 1:2.37 and target 2 is 1:4.75
The FNO strategy is below:
Set the target values as shown in the chart to get the projected profits at the below link.
sbull.co

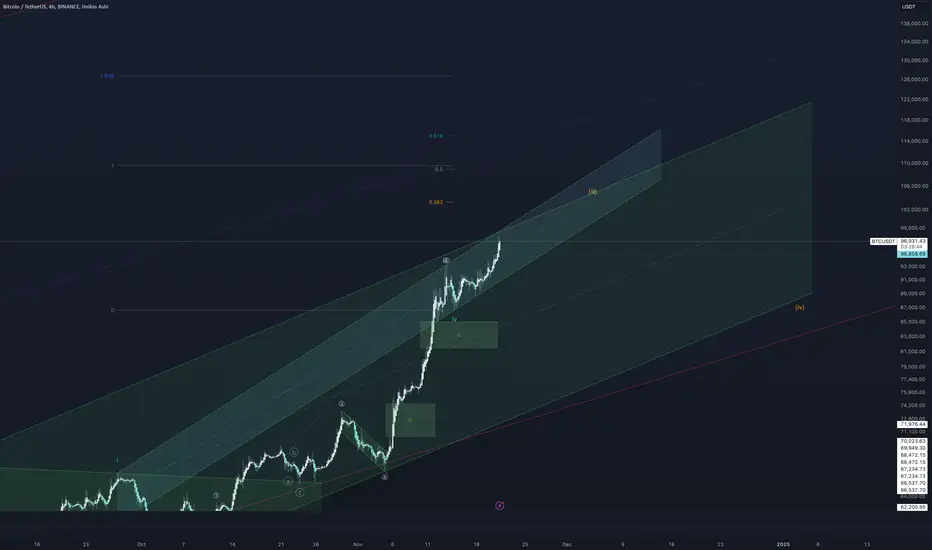
update on $BINANCE:BTCUSDT BTC rally is not finshed yet ) heading minimum to $100k, maximum see fibonacci levels on the graph.
Our educated guess based on the WA and other experts analysis is $104k.
Then a correction week or more long, that will most likely broaden the channel of a bigger impulse (wave 4) somewhere close to 87-88k.
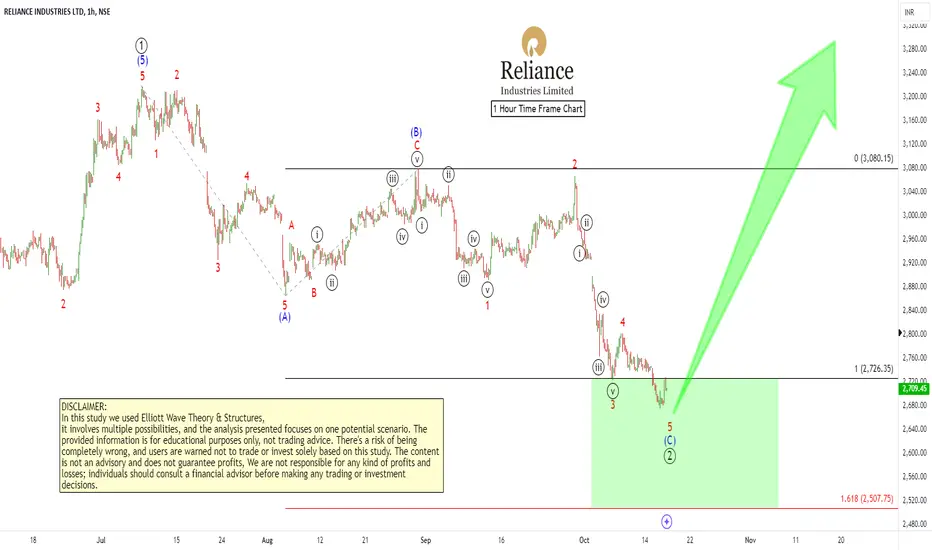
Elliott Wave Outlook for RELIANCETechnical Analysis of Reliance Industries (RELIANCE) based on Elliott Waves
This analysis is based on Elliott Wave Theory and is for educational purposes only. It does not constitute financial advice. Investing involves risk, and past performance is not indicative of future results. Always consult with a financial advisor before making any investment decisions.
Elliott Wave Analysis
The provided chart of Reliance Industries (RELIANCE) outlines a potential Elliott Wave pattern within a 1-hour timeframe. Elliott Wave Theory suggests that financial markets move in predictable and repeatedly patterns based on investor psychology.
Key Observations:
1. Impulse Wave: The primary uptrend appears to be an impulse wave, a five-wave structure.
Wave 1: The initial uptrend from the low point.
Wave 2: A minor correction or pullback.
Wave 3: A strong extension of the uptrend.
Wave 4: A smaller correction.
Wave 5: The final wave of the impulse, often ending with a climactic price movement.
2. Corrective Wave: The current downward movement was a zigzag corrective pattern.
Wave A: The initial decline.
Wave B: A minor retracement.
Wave C: The expected continuation of the downward trend.
Potential Scenario:
If the current corrective pattern zigzag finishes here or near, then further wave ((3)) is to start post completion of wave (C) of ((2)), and it would not go sudden upside, because any impulse wave unfolds in five subdivisions, so wave (1) of wave ((3)) can start any time post completion of wave (C) of wave ((2)).
Note: This analysis is based on a specific interpretation of the Elliott Wave pattern. Other analysts might have different interpretations. It's crucial to use multiple tools and indicators to confirm your analysis.
Additional Considerations:
Fundamental Analysis: Consider factors like company earnings, industry trends, and economic indicators to support your technical analysis.
Risk Management: Always use stop-loss orders to limit your potential losses.
Diversification: Don't put all your eggs in one basket. Diversify your investments across different assets.
Remember: Elliott Wave analysis is a complex tool that requires practice and experience. It's essential to approach it with caution and always consider the potential risks involved in trading.
I am not Sebi registered analyst.
My studies are for educational purpose only.
Please Consult your financial advisor before trading or investing.
I am not responsible for any kinds of your profits and your losses.
Most investors treat trading as a hobby because they have a full-time job doing something else.
However, If you treat trading like a business, it will pay you like a business.
If you treat like a hobby, hobbies don't pay, they cost you...!
Hope this post is helpful to community
Thanks
RK💕
Disclaimer and Risk Warning.
The analysis and discussion provided on in.tradingview.com is intended for educational purposes only and should not be relied upon for trading decisions. RK_Charts is not an investment adviser and the information provided here should not be taken as professional investment advice. Before buying or selling any investments, securities, or precious metals, it is recommended that you conduct your own due diligence. RK_Charts does not share in your profits and will not take responsibility for any losses you may incur. So Please Consult your financial advisor before trading or investing.
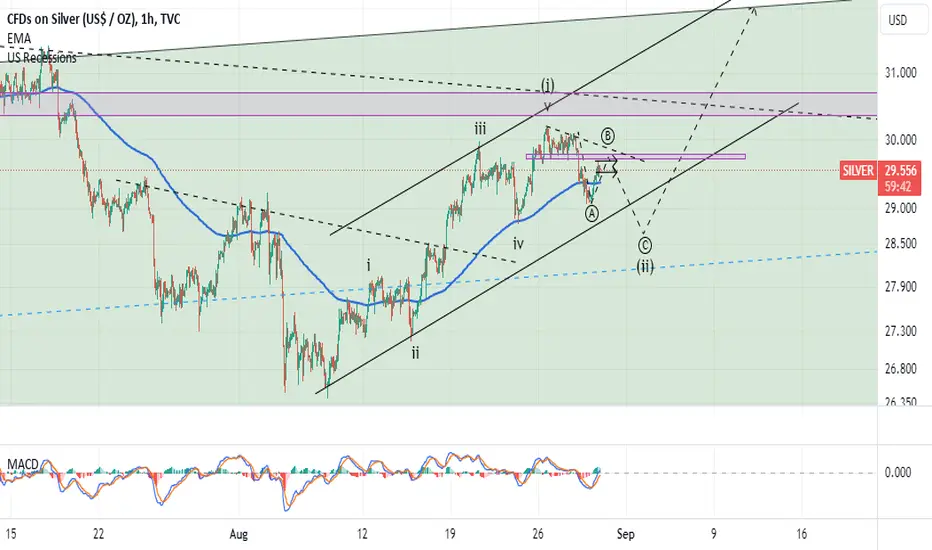
#Silver bearish counter trend opportunityAs seen in the chart, silver has formed a 5-wave bullish impulsive move and has since begun a bearish move, which could be labeled as wave A.
As we know, corrective waves typically occur in three waves. I believe we are nearing the completion of wave B, which could lead to another bearish leg to complete wave C.
This entire 3-wave bearish move could then form wave 2 of 5 on a higher degree.
Therefore, while we might be looking at a short-term bearish move, according to Elliott Wave theory, there is still significant bullish potential in the coming weeks.
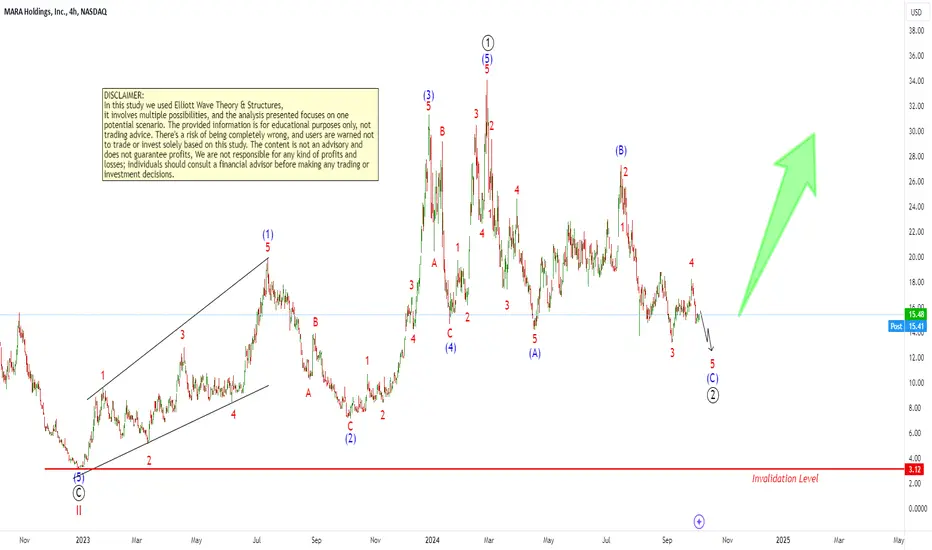
MARA Bullish Outlook: Elliott WavesTechnical Analysis of MARA Based on Elliott Waves.
The following analysis is based on the provided chart and is for educational purposes only. It does not constitute financial advice. Investing in stocks involves risk, and past performance does not guarantee future results. Always conduct thorough research and consult with a financial advisor before making any investment decisions.
Key Observations from the Chart
- Elliott Wave Theory: The chart appears to be using Elliott Wave Theory to identify potential future trends. Elliott Wave Theory suggests that markets move in predictable patterns, often referred to as "waves."
- Uptrend: The overall trend of the chart seems to be bullish, indicating a potential uptrend.
- Invalidation Level: A horizontal line is drawn at the bottom, labeled "Invalidation Level." This level could serve as a support level, and if the price breaks below it, the bullish outlook might be invalidated.
- Pattern Recognition: The chart seems to be suggesting a potential "5-wave impulse" pattern, which is often associated with an uptrend.
- Price Action: The price has recently shown a pullback, which could be a healthy correction within the larger uptrend.
Potential Outlook
Based on these observations, the chart suggests a bullish outlook for MARA. If the price can hold above the "Invalidation Level" and continue to follow the Elliott Wave pattern, there is a potential for further upward movement.
However, it's important to note that technical analysis is not foolproof.
Market conditions can change rapidly, and unexpected events can affect the price. Always stay informed about the company's fundamentals, industry trends, and broader market conditions.
Next Steps
1. Monitor Price Action: Keep an eye on the price in relation to the "Invalidation Level" and the Elliott Wave pattern.
2. Consider Other Indicators: Combine technical analysis with fundamental analysis to get a more complete picture of the company.
3. Risk Management: Implement risk management strategies, such as stop-loss orders, to protect your investments.
I am not Sebi registered analyst.
My studies are for educational purpose only.
Please Consult your financial advisor before trading or investing.
I am not responsible for any kinds of your profits and your losses.
Most investors treat trading as a hobby because they have a full-time job doing something else.
However, If you treat trading like a business, it will pay you like a business.
If you treat like a hobby, hobbies don't pay, they cost you...!
Hope this post is helpful to community
Thanks
RK💕
Disclaimer and Risk Warning.
The analysis and discussion provided on in.tradingview.com is intended for educational purposes only and should not be relied upon for trading decisions. RK_Charts is not an investment adviser and the information provided here should not be taken as professional investment advice. Before buying or selling any investments, securities, or precious metals, it is recommended that you conduct your own due diligence. RK_Charts does not share in your profits and will not take responsibility for any losses you may incur. So Please Consult your financial advisor before trading or investing.
EURAUD I Impulse correction setup
Welcome back! Let me know your thoughts in the comments!
** EURAUD Analysis - Listen to video!
We recommend that you keep this pair on your watchlist and enter when the entry criteria of your strategy is met.
Please support this idea with a LIKE and COMMENT if you find it useful and Click "Follow" on our profile if you'd like these trade ideas delivered straight to your email in the future.
Thanks for your continued support!Welcome back! Let me know your thoughts in the comments!
