Nasdaq (NQ) Buyers Can Appear Soon According to Elliott WaveShort Term Elliott Wave in Nasdaq (NQ) suggests the Index is cycle from 3.13.2023 low ended in wave ((1)) at 13349.37 as the 1 hour chart below shows. Wave ((ii)) pullback is currently in progress to correct cycle from 3.13.2023 low. Internal subdivision of wave ((ii)) is unfolding as a double three Elliott Wave structure.
Down from wave ((i)), wave a ended at 12953.25 and wave b ended at 13241.75. Wave c lower ended at 12925.50 which completed wave (a) in higher degree. Wave (b) rally ended at 13298.75 with internal subdivision as a zigzag. Up from wave (a), wave a ended at 13255 and dips in wave b ended at 13160.25. Wave c ended at 13297.75 which completed wave (b). Wave (c) lower is in progress as 5 waves. Down from wave (b), wave i ended at 13065 and rally in wave ii ended at 13226.75. Wave iii ended at 12800. Expect wave iv to end soon and Index to turn lower in wave v to complete wave (c) of ((ii)). Potential target for wave (c) of ((ii)) is 100% – 161.8% Fibonacci extension of wave (a) which comes at 12614.1 – 12876.5.
Index

Nasdaq -> Bearish Then BullishHello Traders,
welcome to this free and educational multi-timeframe technical analysis .
On the weekly timeframe you can see that Nas100 just recently perfecly broke above a major previous weekly resistance area at the HKEX:12 ,500 level which is now turned quite strong support.
You can also see that weekly market structure and moving averages are both bullish, indicating that we definitely have more upside potential long term so I am now just waiting for a deep retest of the previous resistance zone before I then do expect more weekly continuation towards the upside.
On the daily timeframe it seems like Nas100 actually formed a top formation over the past couple of days so I am now very interested in a short term short opportunity back to the weekly support at the HKEX:12 ,500 area before I then also do expect a next daily rally towards the upside.
Thank you for watching and I will see you tomorrow!
You can also check out my previous analysis of this asset:

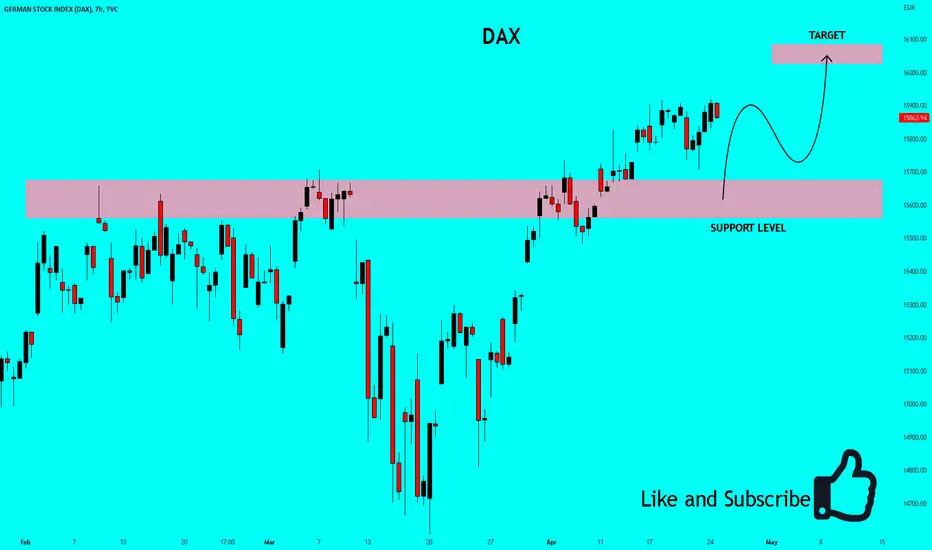
DAX: Growth & Bullish Forecast:
The strict beauty of the chart is a reflection of the fierce eternal battle between the bulls and bears and right now I can clearly see that the bulls are taking over so we will bend to the will of the crowd and buy too.
❤️ Please, support our work with like & comment! ❤️

✅DXY GROWTH AHEAD|LONG🚀
✅DXY is trading in an uptend
And the pair broke the key level
Of 15,700 and the level
Is now the support so we
Can be expecting
A further move up soon
LONG🚀
✅Like and subscribe to never miss a new idea!✅
US30: Short Signal Explained
US30
- Classic bearish setup
- Our team expects pullback
SUGGESTED TRADE:
Swing Trade
Short US30
Entry Level - 33793
Stop Loss - 33980
Take Profit - 33510
Our Risk - 1%
❤️ Please, support our work with like & comment! ❤️

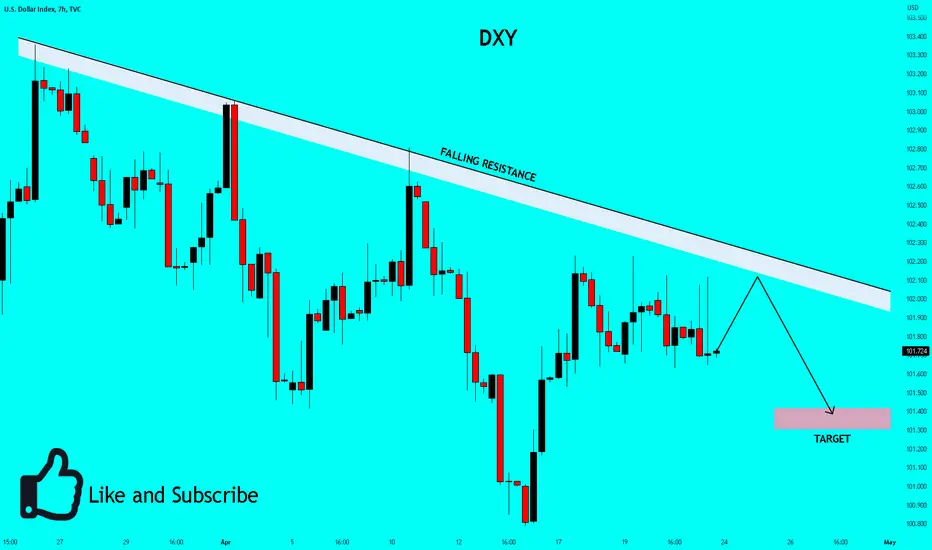
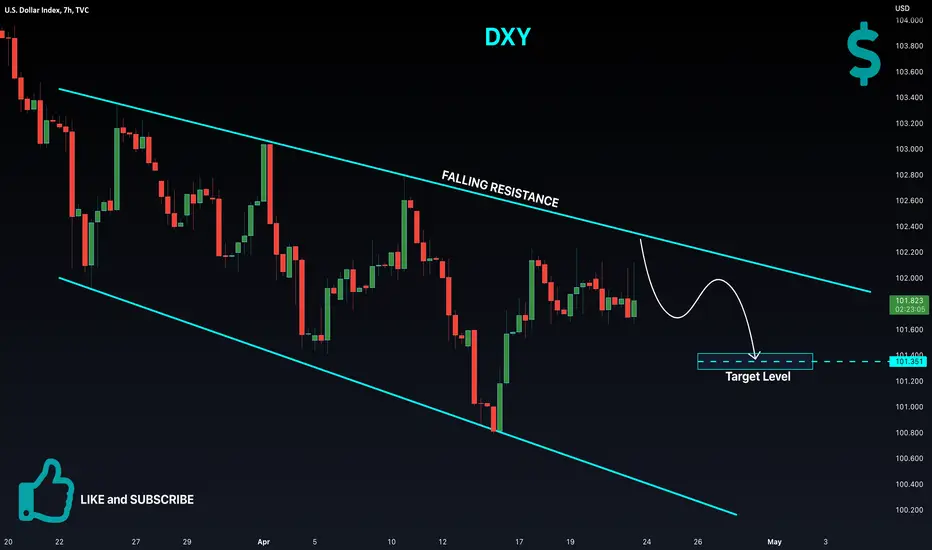
✅DXY WILL GO DOWN|SHORT🔥
✅DXY is going down
Along the falling resistance line
So after the potential retest
I think we will see a
Further move down
SHORT🔥
✅Like and subscribe to never miss a new idea!✅
US500: Bearish Continuation is Highly Probable! Here is Why:
Looking at the chart of US500 right now we are seeing some interesting price action on the lower timeframes. Thus a local move down seems to be quite likely.
❤️ Please, support our work with like & comment! ❤️

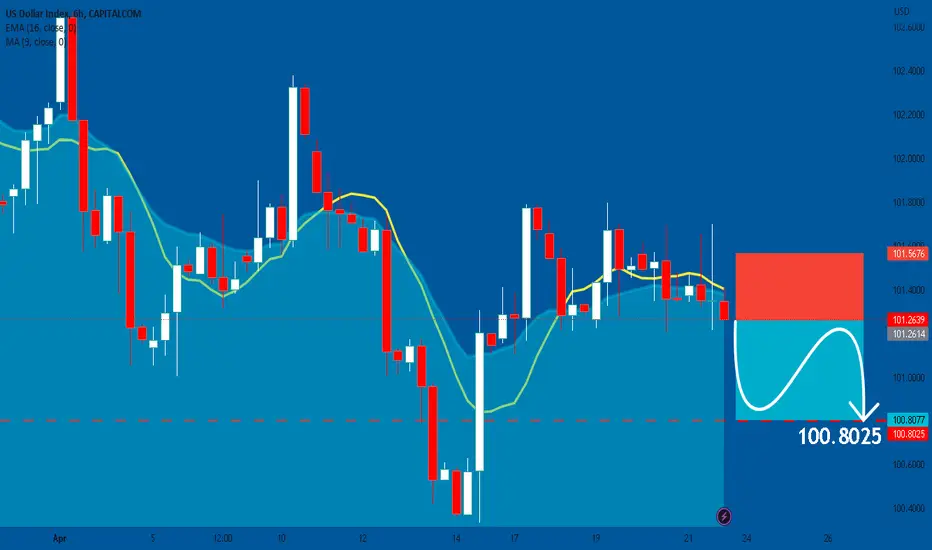
DXY: Short Trading Opportunity
DXY
- Classic bearish setup
- Our team expects bearish continuation
SUGGESTED TRADE:
Swing Trade
Sell DXY
Entry Point - 101.2614
Stop Loss - 101.5676
Take Profit - 100.8077
Our Risk - 1%
Start protection of your profits from higher levels.
❤️ Please, support our work with like & comment! ❤️
DXY Will Fall Down! Sell!
Hello,Traders!
DXY is trading in an opening
Wedge and is consolidating
Below the falling resistance
From where I think the index
Will go down to retest the
Demand level of 101.4 below
Sell!
Like, comment and subscribe to help us grow!
Check out other forecasts below too!
DAX: Bulls Will Push
Balance of buyers and sellers on the DAX pair, that is best felt when all the timeframes are analyzed properly is shifting in favor of the buyers, therefore is it only natural that we go long on the pair.
❤️ Please, support our work with like & comment! ❤️

ES: Recession/Depression 2023ES: Recession/Depression 2023
ES: Recession/Depression 2023
ES: Recession/Depression 2023
ES: Recession/Depression 2023
ES: Recession/Depression 2023
ES: Recession/Depression 2023
ES: Recession/Depression 2023
ES: Recession/Depression 2023
ES: Recession/Depression 2023
ES: Recession/Depression 2023
ES: Recession/Depression 2023
ES: Recession/Depression 2023
ES: Recession/Depression 2023
ES: Recession/Depression 2023
ES: Recession/Depression 2023
ES: Recession/Depression 2023
THE END IS NEAR.

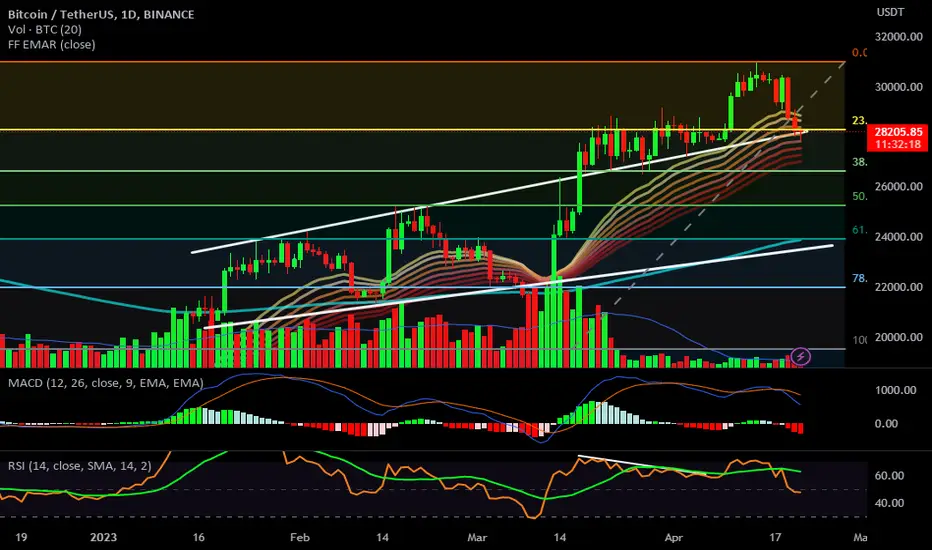
"Everything is under control, sound correction."Hello Crypto community! Whenever a large red candle appears, fears arise and the ghost of (we're going to zero) becomes relevant. Well, for that we have various technical and fundamental tools that help us in the difficult task of trading.
We see in the daily BTC chart a price rejection zone between 30k and 31k, which could be due to bull exhaustion, short selling orders, and profit-taking from those who bought at 20k and 25k. The support levels to consider are:
26621 K
25267 K
23914 K
This is not investment advice, happy trading and profits!
Nasdaq nas100 flag breakout hello traders on nas100 i have sent out today payed well let me know how you been doing .the opportunity is always there once you understand it here we have another setup lets get it make sure to like and follow to get signal for free

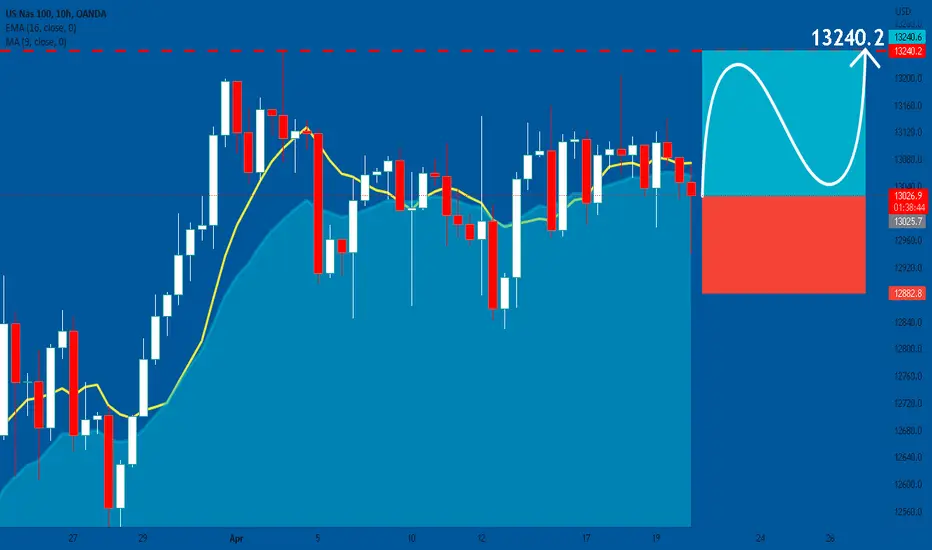
NAS100USD: Long Signal Explained
NAS100USD
- Classic bullish formation
- Our team expects growth
SUGGESTED TRADE:
Swing Trade
Buy NAS100USD
Entry - 13025.7
Stop - 12882.8
Take - 13240.6
Our Risk - 1%
❤️ Please, support our work with like & comment! ❤️
Nasdaq triangle breakout scalphello traders nas100 looks what is making an ascending triangle but we can play against what we all learn from the text book we will use to short it looks clean nas100 was very rangy but still we can take advantage on a rangy market .overall it is bullish but still we don't fix ourselves in one direction any ways we are buying it from the broker so think both side lets get it /if it is helpful signal like this make sure to like and comment so i keep posting .
