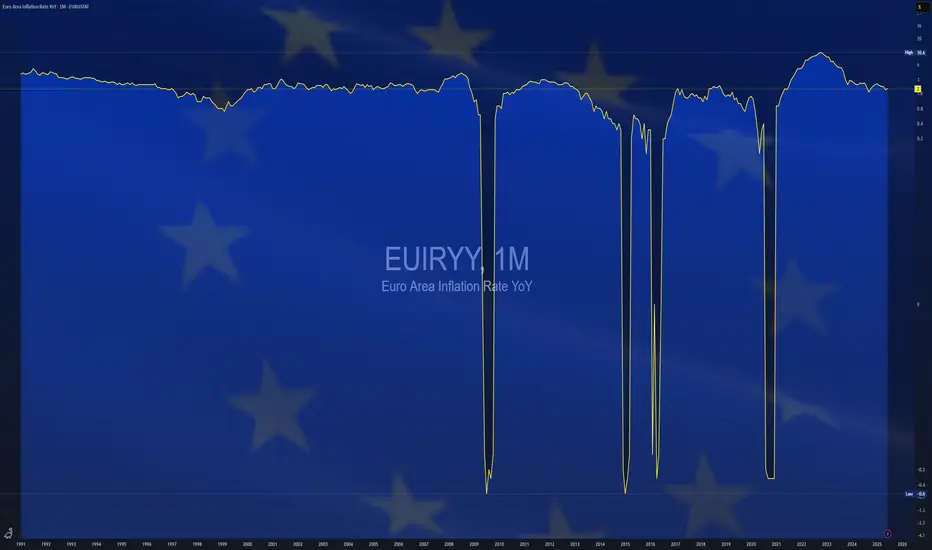
$EUIRYY -Europe CPI (July/2025)ECONOMICS:EUIRYY
July/2025
source: EUROSTAT
- Eurozone consumer price inflation held steady at 2.0% year-on-year in July 2025, unchanged from June but slightly above market expectations of 1.9%, according to preliminary estimates.
This marks the second consecutive month that inflation has aligned with the European Central Bank’s official target.
A slowdown in services inflation (3.1% vs 3.3% in June) helped offset faster price increases in food, alcohol & tobacco (3.3% vs 3.1%) and non-energy industrial goods (0.8% vs 0.5%).
Energy prices continued to decline, falling by 2.5% following a 2.6% drop in June.
Meanwhile, core inflation—which excludes energy, food, alcohol, and tobacco—remained unchanged at 2.3%, its lowest level since January 2022.
Indexes
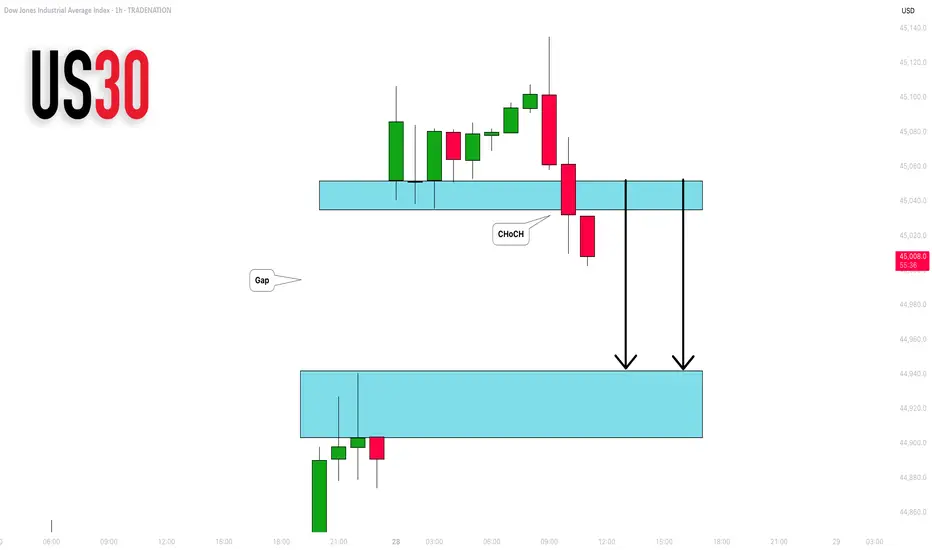
DOW JONES INDEX (US30): Another Gap For Today?
I see another gap up opening on US30 Index.
I think it will be filled today. A formation of an intraday
bearish CHoCH on an hourly time frame suggests
a highly probable bearish continuation.
Goal - 44943
❤️Please, support my work with like, thank you!❤️
I am part of Trade Nation's Influencer program and receive a monthly fee for using their TradingView charts in my analysis.
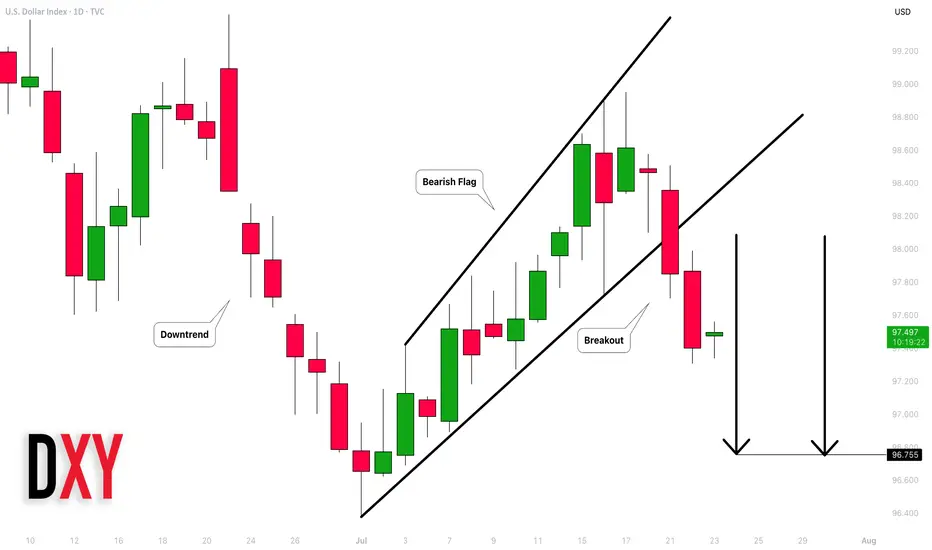
Dollar Index (DXY): Strong Bearish Price Action
Dollar Index broke and closed below a support line
of a bullish flag pattern on a daily.
Because the market is trading in a bearish trend,
this violation provides a strong bearish signal.
I expect a bearish movement to 96.75
❤️Please, support my work with like, thank you!❤️
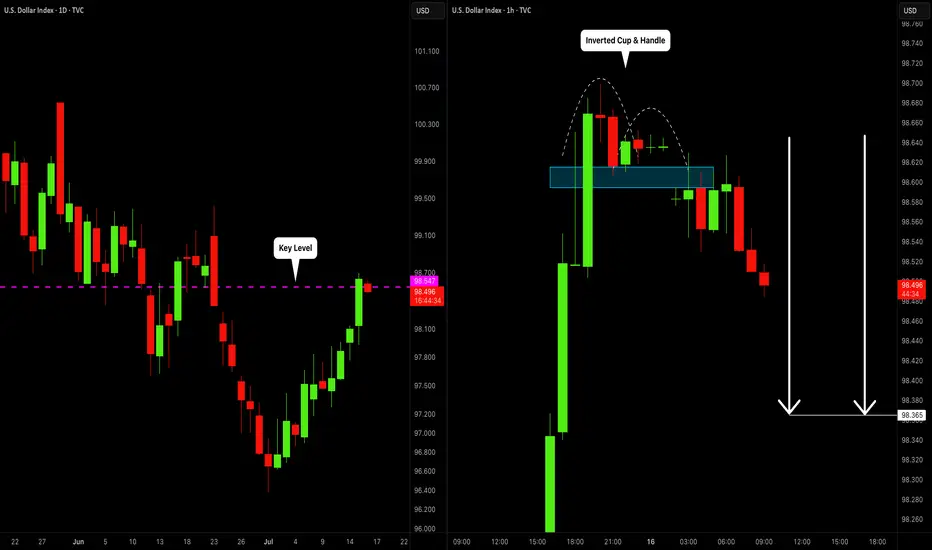
DOLLAR INDEX (DXY): Bearish Move From Key Level
I think that Dollar Index may drop from a key daily horizontal resistance level.
As a confirmation, I spotted an inverted cup & handle pattern on an hourly time frame
and a bearish violation of its neckline.
The market will most likely continue falling at least to 98.36
❤️Please, support my work with like, thank you!❤️
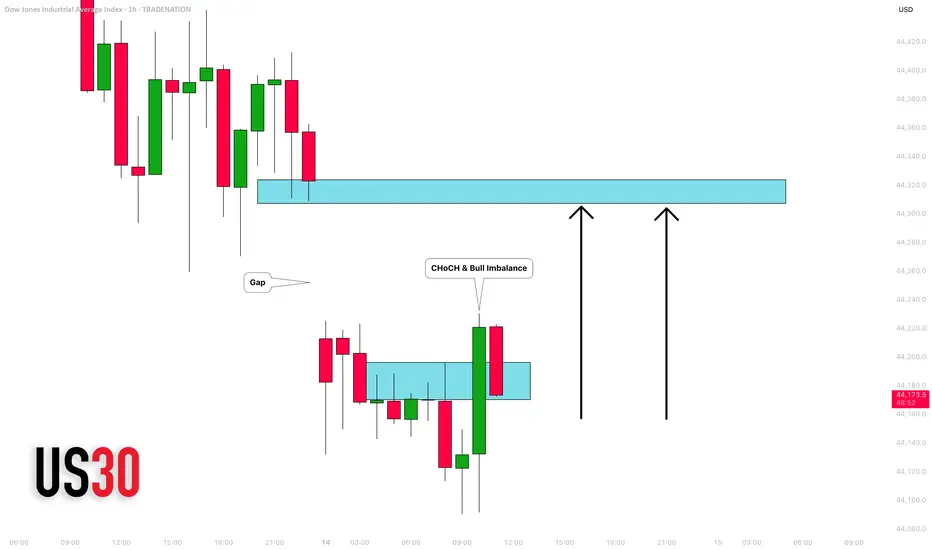
DOW JONES INDEX (US30): Classic Gap Trade
I see a gap down opening on US30 index.
As always, there is a high chance that this gap is going to be filled.
A bullish imbalance candle and a local change of character CHoCH
indicate a highly probable rise to a gap opening level.
Target - 44300
❤️Please, support my work with like, thank you!❤️
I am part of Trade Nation's Influencer program and receive a monthly fee for using their TradingView charts in my analysis.
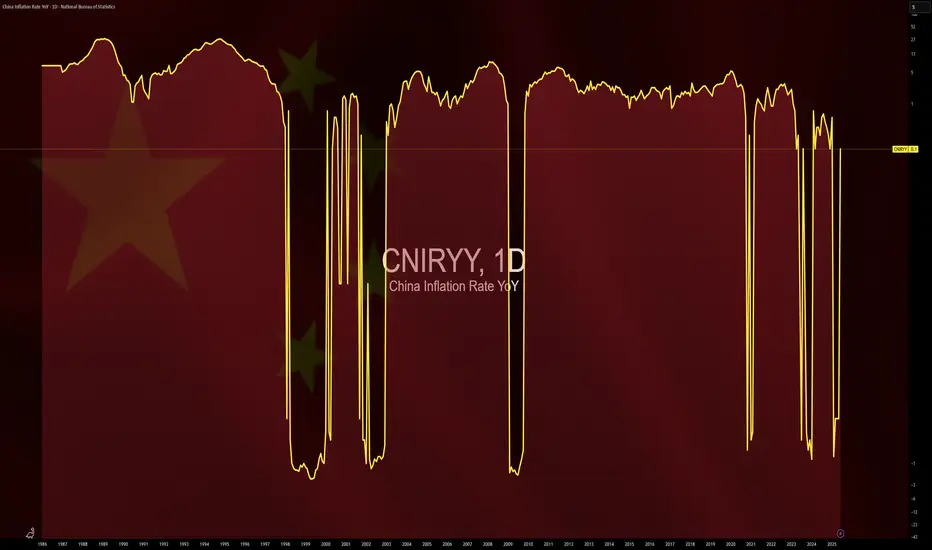
$CNIRYY -China's Inflation Data (June/2025)ECONOMICS:CNIRYY
June/2025
source: National Bureau of Statistics of China
- China’s consumer prices rose by 0.1% yoy in June 2025,
reversing a 0.1% drop in the previous three months and surpassing market forecasts of a flat reading.
It marked the first annual increase in consumer inflation since January, driven by e-commerce shopping events, increased subsidies for consumer goods from Beijing, and easing trade risks with the U.S.
Core inflation, which excludes volatile food and fuel prices, rose 0.7% yoy, marking the highest reading in 14 months and following a 0.6% gain in May.
On a monthly basis, the CPI fell 0.1%, after May's 0.2% drop, pointing to the fourth monthly decline this year.
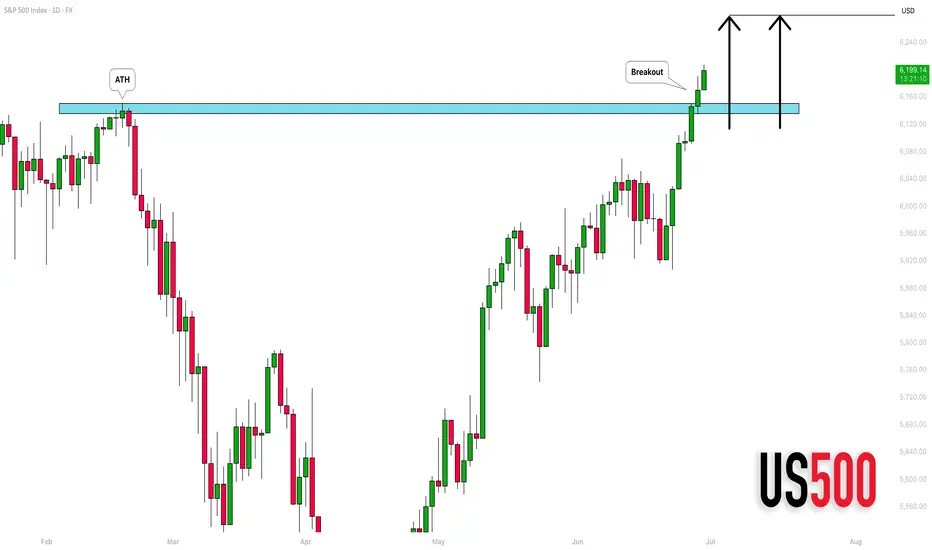
S&P500 INDEX (US500): New ATH & More Growth
S&P500 index updated the all-time high on Friday.
The market successfully broke and closed above an underlined resistance.
More growth is coming and the index is going to reach 6280 level soon.
❤️Please, support my work with like, thank you!❤️
DOW JONES INDEX (US30): Consolidation is Over
Dow Jones Index completed a bullish accumulation on a daily.
The price violated a key horizontal resistance cluster and closed above that.
Next goal for bulls is 43790.
❤️Please, support my work with like, thank you!❤️
I am part of Trade Nation's Influencer program and receive a monthly fee for using their TradingView charts in my analysis.

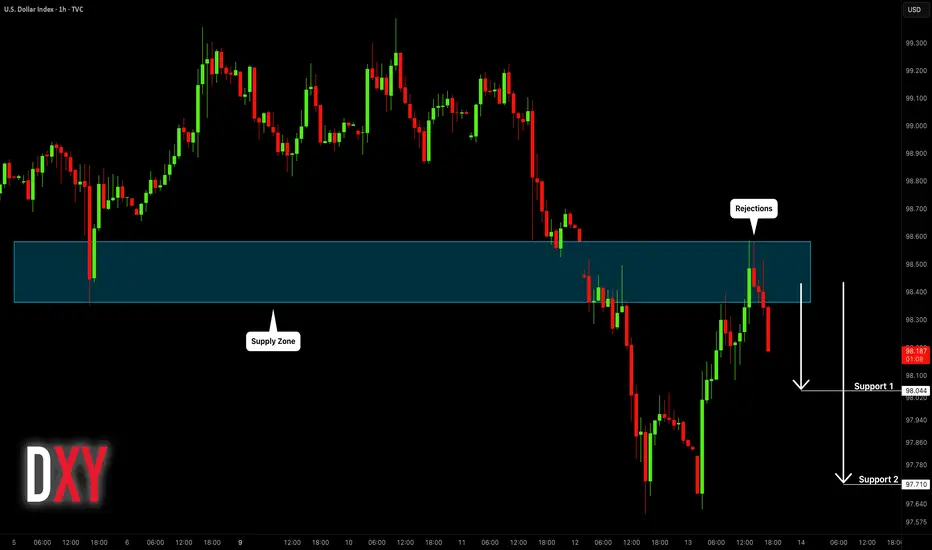
DOLLAR INDEX (DXY): Bearish Again?!
Dollar Index leaves clear bearish clues after a test
of a significant intraday/daily supply area.
I think that the market will continue falling at reach at least 98.04 level.
❤️Please, support my work with like, thank you!❤️
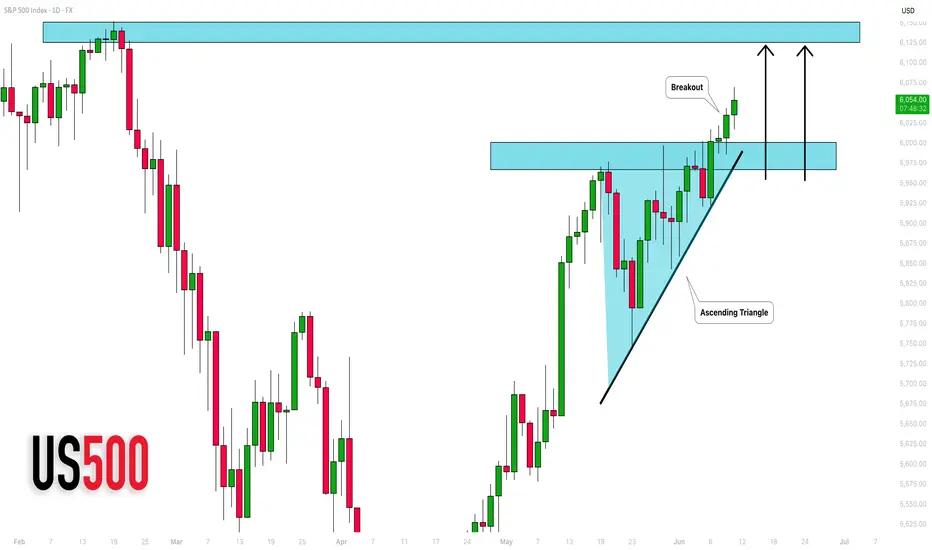
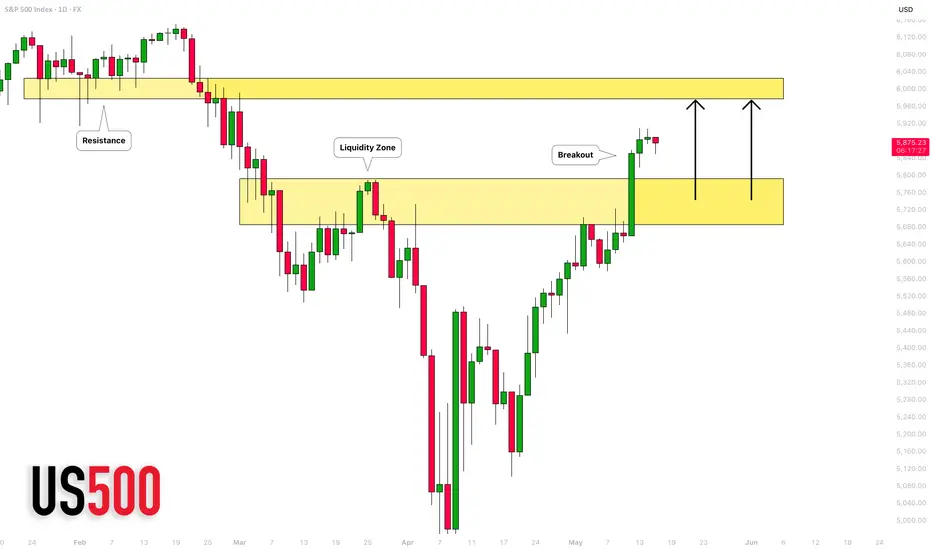
S&P500 INDEX (US500): More Growth Ahead
US500 broke and closed above a neckline of an ascending triangle
pattern on a daily time frame.
It is a strong bullish pattern that indicates a strong bullish interest.
With a high probability, buyers will push at least to 6124 resistance.
❤️Please, support my work with like, thank you!❤️
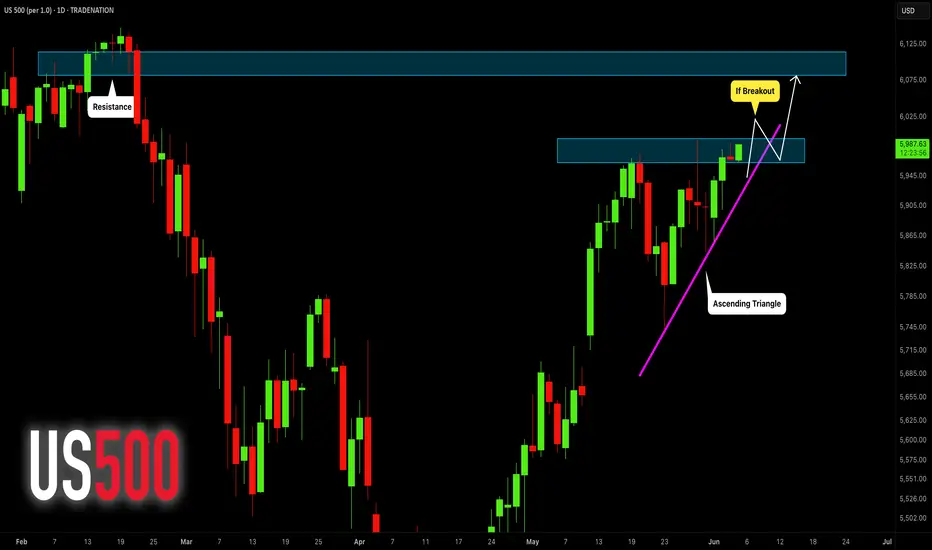
S&P500 Index (US500): Bullish Accumulation Pattern
I spotted a nice example of an ascending triangle pattern on a daily time frame.
To confirm a bullish continuation, we will need a bullish breakout
of its neckline.
A daily candle close above 5996 will provide a reliable confirmation.
A rise will be anticipated at least to 6080 resistance then.
❤️Please, support my work with like, thank you!❤️
I am part of Trade Nation's Influencer program and receive a monthly fee for using their TradingView charts in my analysis.
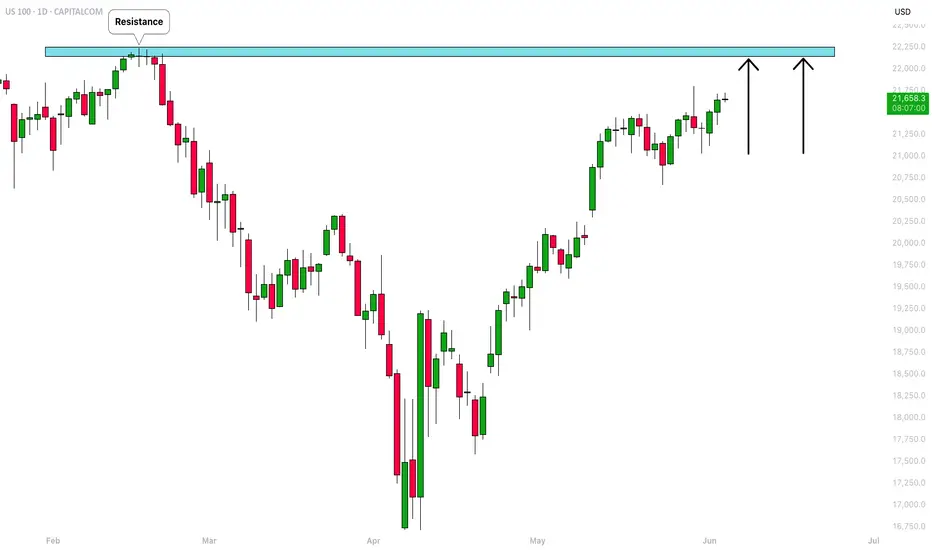
NASDAQ INDEX (US100): More Growth Ahead
For some unknown reason, I was asked by a dozen
of my subscribers to provide the update for US100.
Since early May, the index successfully updates the highs on a daily.
Such a tendency will remain at least till a test of a current ATH.
I think that the market is going to grow and reach at least 22100 level soon.
❤️Please, support my work with like, thank you!❤️
NQ's next targetCME_MINI:NQ1! looks to be in a 50/50 probability...maybe
I am only expecting price to reach $21557
This is the clearest target so far. This is subject to Sundays open also.
But looking for price to reach this level and then we will get a better understanding on the next draw.

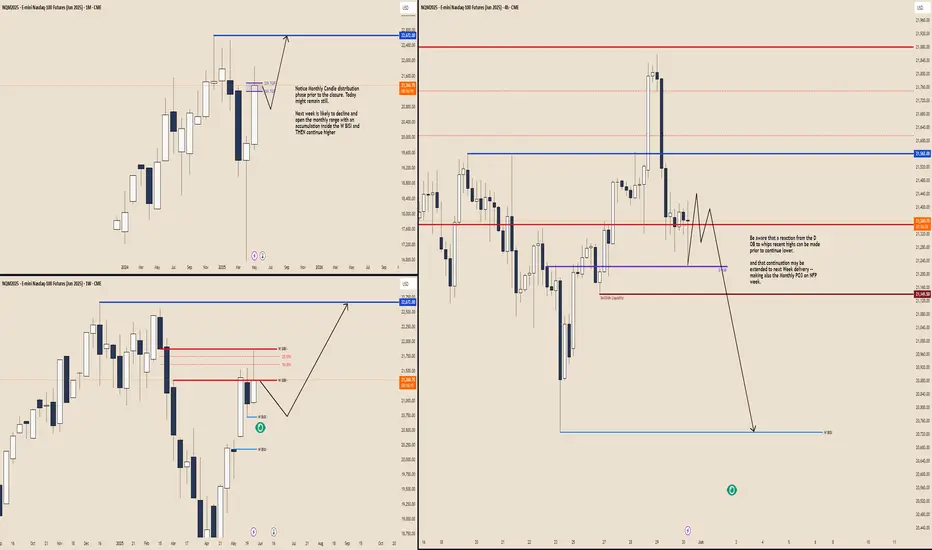
Nasdaq Next Week and June Month ForecastNotice Monthly Candle distribution phase prior to the closure. Today might remain still and whips recent swings highs and lows as a reaction from the D +orderblock
Next week is likely to decline and open the monthly range with an accumulation inside the W BISI and THEN continue higher throughout the rest of the month and reach 22,672.00

NASDAQ D Bias Change to Bearish. New TargetsNASDAQ D Bias Change to Bearish. New Targets:
D Wick CE: 21,400.75
and the D BISI if further
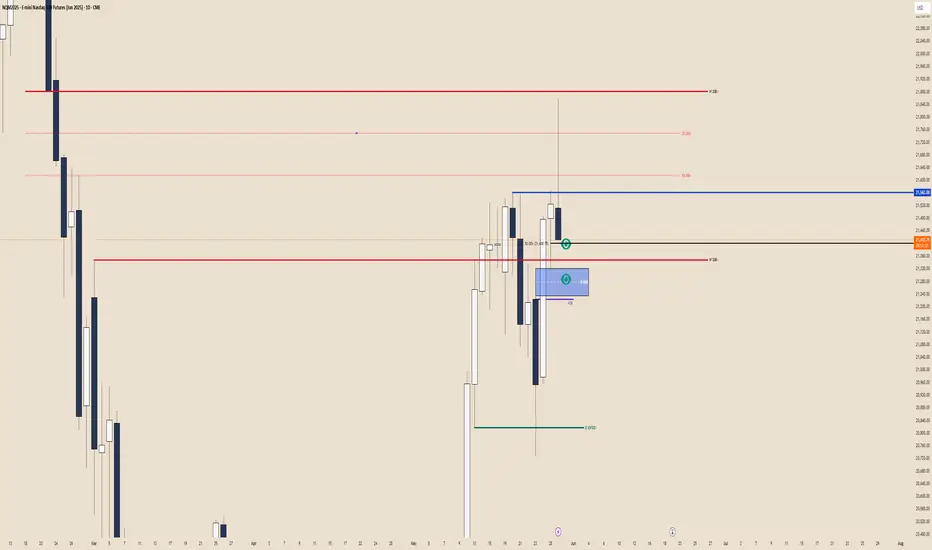
Potential Reversal Level on NasdaqLooking for Price to retrace as far as the H1 OB (max 21,440.00 to remain bullish), to potentially provide a reaction and continue his grind higher or at least return back to 50% of today range.
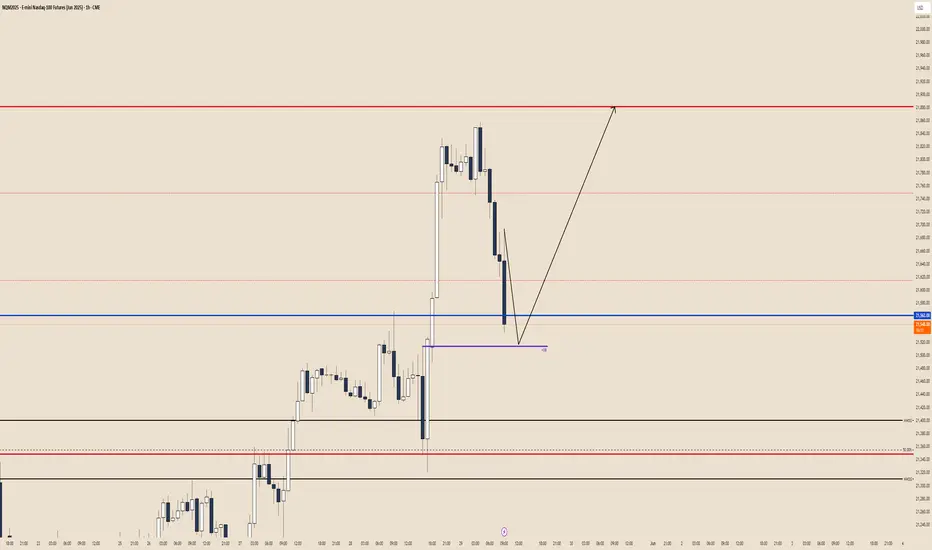
Nasdaq and Indexes Week 22 BiasWhile the Indexes maitain a Bullish perspective on Weekly right now, I would not dare to anticipate next week "Flavour" but rather wait for The New Week Opening and if necessary till FOMC Minutes on Wednesday.
I would like to see immediate rejection from where price it's right now (allowing it to reach the IFVG starting at 20,690.00) to maintain a bullish bias rather then a deeper retrace, otherwise Bias may change on a Daily basis and pause that Weekly View for a later time .
DOW JONES INDEX (US30): Your Plan to Buy Explained
There is a high chance that US30 will resume growth soon.
The index is currently testing a wide daily support cluster.
My signal to buy will be a bullish violation and a candle close above
41920 minor horizontal resistance.
A bullish movement will be anticipated at least to 42200 level then.
❤️Please, support my work with like, thank you!❤️
I am part of Trade Nation's Influencer program and receive a monthly fee for using their TradingView charts in my analysis.

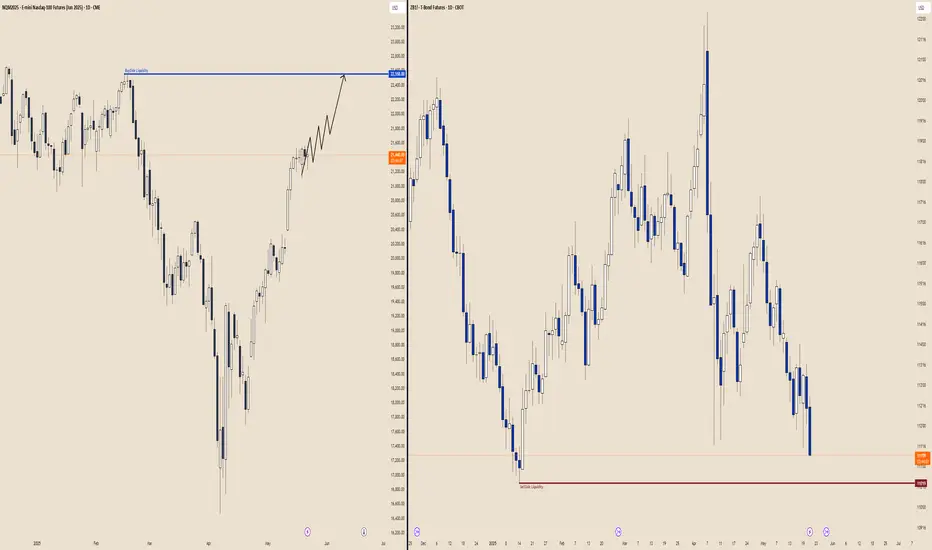
Indexes Daily "Slow" Trend anticipationExpecting a Daily slowliness a.k.a. HRLR (ICT Concepts) due to the Bonds decorrelation which is bearish. Once Bonds has reached Sell Side Liquidity Target, acceleration will be seen on Indexes higher. Meanwhile "give and take" is expected on a Daily and 4h basis.
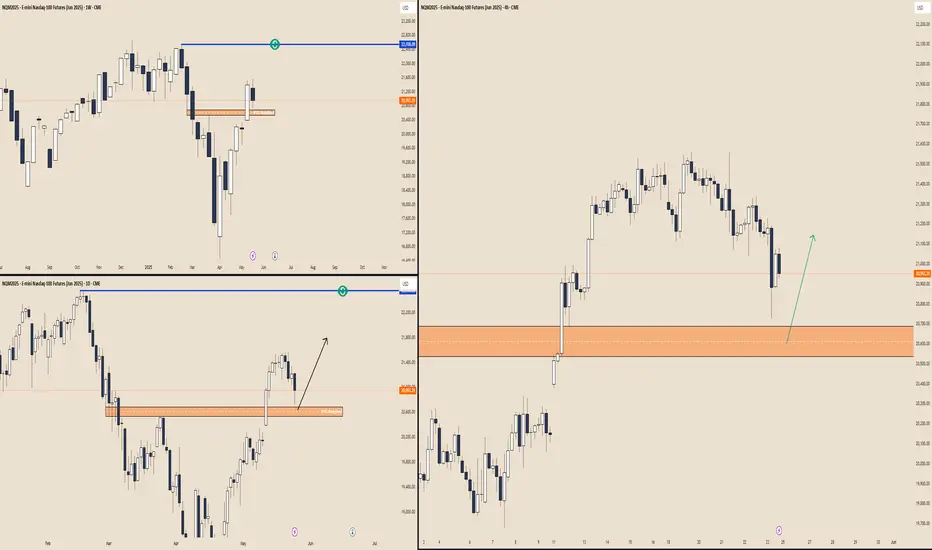
Bullish Weekly Bias IndexesBullish Indexes Target on Weekly perspective.
Expecting Nasdaq to breach trough the W IFVG and reach 22,5588.00 within the next few weeks.
Expecting S&P500 to use the W IFVG as "Support" and reach 6,235.00

S&P500 INDEX (US500): More Growth is Coming
This week, S&P500 managed to violated a significant
daily demand zone.
It opens a potential for much more growth and trend-continuation.
Next resistance - 5973
❤️Please, support my work with like, thank you!❤️
DOLLAR INDEX (DXY): Bullish Reversal Confirmed?!
Dollar Index formed an inverted head and shoulders pattern on a daily.
Its neckline breakout is a strong bullish reversal signal.
The broken neckline of the pattern turns into a significant support now.
We can expect a growth from that at least to 101.25 resistance.
❤️Please, support my work with like, thank you!❤️
