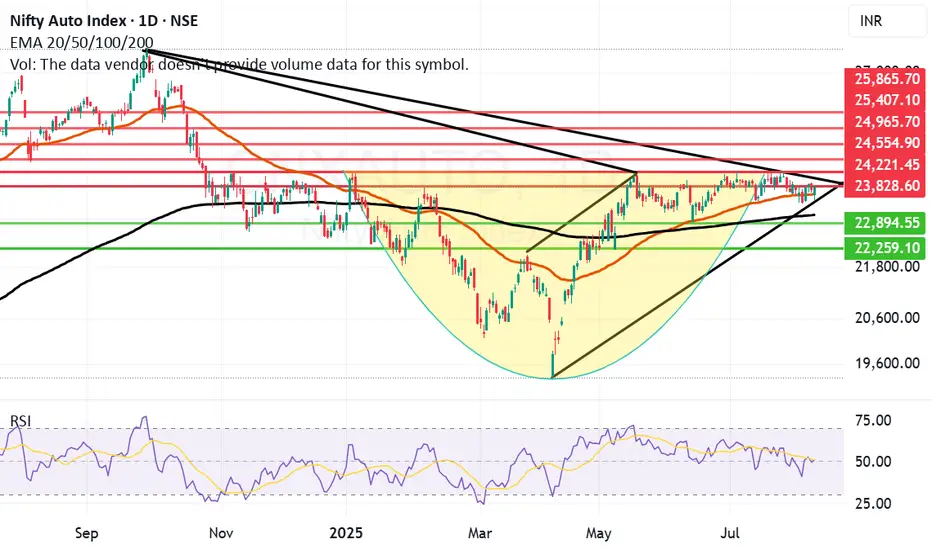
Auto Index has consolidated and might be in search of a BreakoutCNX Auto Index has consolidated for a long time in the range of 22800 and 24250 since May 25. If the index can cross the resistance zone between 23828 and 24221 and if we get a weekly closing above 24221 or 24250 then we might see a rally in this index towards 25K or even near 26K. Currently the index closed on Thursday at 23808. Lot of Auto and Auto component companies gave good results during the last quarter.
When the index is strong and gives a breakout it means that the undercurrent in majority of the companies which constitute the index is strong. There will be some companies which will obviously drag the index down as there can not be one way traffic. To know amongst these which companies to invest in an investor should look at fundamentals of the company, recent and past results, cash flows, Sales and order books, EPS and many other factors. While a Technical investor should look at charts of the companies before investing.
A smart investor would be a person who looks at both fundamentals and technicals of the company and invests in a fundamentally strong company which is giving a technical breakout. For this one has to learn Techno-Funda analysis. I have written a book on the subject called The Happy Candles Way To Wealth Creation. In this book you will learn the basics of Techno-Funda investing. The book is available on Amazon and is one of the highest rated books in its category. With an approval rating of 4.8/5 as on date. Lot of investors call it as a Hand book for Techno Funda investing. Most of the chapters are standalone and can be read at your own accord. It will be really helpful to you.
The companies that constitute this index are Maruti Suzuki, Tata Motors, M&M, MRF, TI India, Exide, Samvardhana Motherson, Ashok Leyland, Hero Moto, TVS Motors, Bharat Forge, Bosch, Balkrishna, Bajaj Auto and Eicher Motors. Amongst these companies due to Tariff uncertainties one should focus on companies which will be least dependent on export and have major market which caters to local consumption or exports not related to US. Two-Wheeler manufacturers and Two Wheeler component manufacturers are looking particularly strong in the index as most of them are consumed and sold locally. The rains so far this monsoon have been good so the Farm equipment and Tractor manufacturers also can try to push the index upwards if the monsoon remains strong in India.
If we get a closing above 24250 we can easily see index moving 1000 to 1500 points northwards if positivity in the index sustains. The resistances currently for the Auto index are at 23828, 24221, 24554, 24965, 25407 and 25865. The supports for Auto index remain at 23620 (Mother line support), 23087 (Father line support), 22894 (Below this level index becomes very weak) and 22259. To know more about Mother line, Father line and my Mother, Father and Small child theory you should once again I recommend, read my book the Happy Candles Way to Wealth Creation.
Disclaimer: The above information is provided for educational purpose, analysis and paper trading only. Please don't treat this as a buy or sell recommendation for the stock or index. The Techno-Funda analysis is based on data that is more than 3 months old. Supports and Resistances are determined by historic past peaks and Valley in the chart. Many other indicators and patterns like EMA, RSI, MACD, Volumes, Fibonacci, parallel channel etc. use historic data which is 3 months or older cyclical points. There is no guarantee they will work in future as markets are highly volatile and swings in prices are also due to macro and micro factors based on actions taken by the company as well as region and global events. Equity investment is subject to risks. I or my clients or family members might have positions in the stocks that we mention in our educational posts. We will not be responsible for any Profit or loss that may occur due to any financial decision taken based on any data provided in this message. Do consult your investment advisor before taking any financial decisions. Stop losses should be an important part of any investment in equity.
Indextowatch
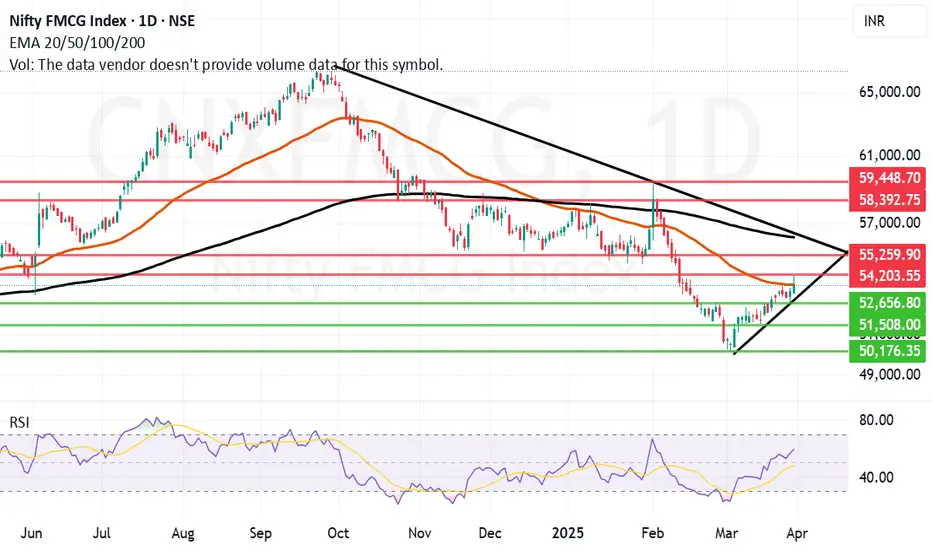
The Index to watch next week: FMCG IndexThe index that is trying to break out and one needs to watch the next week seems to be the FMCG Index.
The FMCG index is currently facing the Mother line resistance. If the index can overcome the Mother line resistance which is at 53619 there is a chance that this index in the near future can go on to its net resistance levels which are at 54203, 55259 or even 56230. A closing above 56230 or the Father line and the trend line near by in a few weeks or the next quarter can lead the index to gain some previous levels like 57K, 58K or even 59K. The support for FMCG index is currently at 52656, 51508 and 50176.
To know more about supports, Resistances, investing in stocks based on sector index, Trend lines Parallel Channels, Mother, Father and small Child Theory, Behavioural finance, Fundamental analysis, Technical analysis, Profit booking etc. Read my book The Happy Candles Way to Wealth creation. It is as on date one of the highest rated books on Amazon. The paperback version and Kindle can be bought through Amazon. You can also contact me to buy the same.
Now if this breakout actually happens in the Nifty FMCG index the some of the stocks that composites the FMCG index will be the beneficiaries. Some might benefit more some might benefit less and some might not benefit but for index to move upward the stocks composing it have to perform well. To know which stocks will do better than others we will have to look at their individual charts. The stocks which make the Nifty FMCG index are Tata Consumer, Britannia, Radico Khaitan, Godrej Consumer Products, UBL, Dabur, United Spirits, Nestle, Colgate, Marico, PGHH, Dabur, Balrampur Chini, Hindustan Unilever, Varun Bevreges and ITC. The Index Can Perform if the majority constituents or the stocks with heavy weightage perform. Some of these stocks can perform others might not. Choose wisely after consulting your investment advisor, studying fundamentals and Technicals of each company.
Disclaimer: The above information is provided for educational purpose, analysis and paper trading only. Please don't treat this as a buy or sell recommendation for the stock. No one can guarantee any success in highly volatile market or otherwise. There is also chance of bias in our opinion. The supports and resistances indicated are based on data which has a cycle time of being 3 months or older so it is not necessary that it will work. The author or Smart Investment will not be responsible for any Profit or loss that may occur due to any financial decision taken based on any data provided in this message.