Technical Analysis Report for the NIFTY 50 INDEX.# NIFTY 50 Technical Analysis: Comprehensive Multi-Timeframe Trading Strategy
Executive Summary
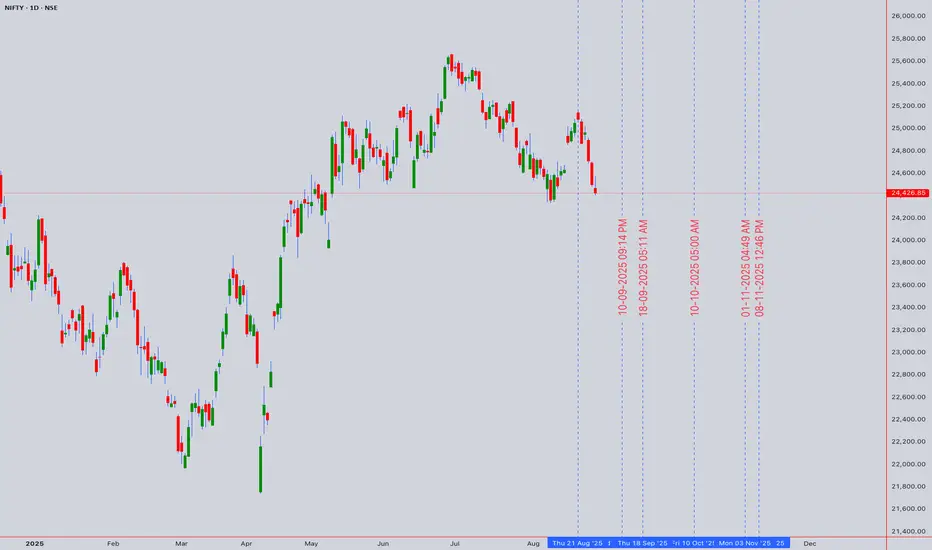
Current Price: 24,433.65 (August 29, 2025, 1:5 PM UTC+4)
Market Sentiment: Cautiously Bullish with Consolidation Bias
Primary Trend: Uptrend with potential for continued advancement
Key Resistance: 25,000 (psychological level and technical confluence)
The NIFTY 50 continues to demonstrate resilience in the face of global uncertainties, maintaining its position above key support levels while approaching significant psychological resistance. The index benefits from accommodative monetary policy with the RBI's recent rate cuts and strong domestic fundamentals, though valuations warrant selective positioning.
Market Context & Fundamental Backdrop
Monetary Policy Environment
The Reserve Bank of India has cut its repo rate by 0.25%, which now stands at 6.25%, marking a significant shift in policy stance. Markets expect the RBI may implement one more 25-bps rate cut in August 2025, especially ahead of the festive season which historically shows multiplier effects on consumer demand.
Economic Fundamentals
India's GDP expanded 7.80 percent in the second quarter of 2025 over the same quarter of the previous year, demonstrating robust economic growth. The RBI expects real GDP to grow 6.5% in FY 2025-26, supported by strong domestic demand and government capital expenditures.
Inflation and Growth Balance
Headline inflation in India is expected to average 4.2% year-on-year in the 2025 calendar year, with food inflation at 4.6% — much lower than estimates of 7%-plus for 2024, thanks to adequate rainfall and good sowing.
Earnings Outlook
Consensus expects 11-12% earnings growth for the Nifty 50 in FY26, with the index trading below 20x price-earnings on FY26 estimates, suggesting reasonable valuations at current levels.
Technical Analysis Framework
Japanese Candlestick Analysis
Weekly Pattern: Spinning top formation indicating indecision at current levels
Daily Pattern: Small-bodied candles with narrow ranges suggesting consolidation
Intraday Patterns: Hammer and doji formations prevalent in 1H and 4H timeframes
Volume Confirmation: Average volume during consolidation phase
Elliott Wave Analysis
Primary Wave Count:
Major Degree: Wave 5 of larger bull market cycle potentially in progress
Intermediate Degree: Subwave 3 of 5 showing extension characteristics
Minor Degree: Currently in subwave 4 correction of intermediate wave 3
Alternative Count: Complex correction (WXY) completion targeting 25,200-25,500
Critical Support: Wave 4 support at 23,800-24,000 maintains bullish structure
Harmonic Pattern Analysis
Active Patterns:
Bullish Gartley: Potential completion zone at 23,950-24,100
ABCD Pattern: Current formation targeting 24,800-25,000
Potential Cypher: Formation developing with D point near 25,100
Fibonacci Analysis:
- 50% retracement of major swing: 24,200
- 38.2% retracement: 24,500 (current consolidation area)
- 1.618 extension target: 24,900-25,000
Wyckoff Method Analysis
Phase Assessment: Accumulation Phase C - Testing supply
Characteristics:
- Volume patterns showing accumulation on weakness
- Price holding above composite operator accumulation zone
- Sign of Strength (SOS) evident on recent advances
Distribution Risk: Monitor for climactic volume above 25,000
W.D. Gann Technical Analysis
# Square of 9 Application
Current Position: 24,433.65 = 156.31° on the Gann wheel
Key Resistance Levels:
- 24,481 (156.5°) - immediate minor resistance
- 24,649 (157°) - intermediate resistance
- 25,000 (158.11°) - major psychological and geometric resistance
Support Levels:
- 24,336 (156°) - immediate support
- 24,025 (155°) - strong support zone
- 23,716 (154°) - major support level
# Time Theory Application
Critical Time Windows:
- September 9-12: 45-degree time angle from recent high
- September 23: Autumn equinox - natural market turning point
- October 8-15: 90-degree time cycle completion
# Price and Time Squaring
Square Root Analysis: √24,433.65 = 156.31
Next Square Levels:
- 157² = 24,649 (key resistance)
- 158² = 24,964 (approaching 25,000)
- 160² = 25,600 (extended target)
Ichimoku Kinko Hyo Analysis
Cloud Configuration:
Tenkan-sen (9): 24,445 - Price slightly below, neutral
Kijun-sen (26): 24,380 - Price above, mild bullish bias
Senkou Span A: 24,412 (cloud top)
Senkou Span B: 24,100 (cloud bottom)
Assessment: Price trading within cloud, indicating consolidation phase with neutral bias pending breakout direction.
Multi-Timeframe Technical Indicator Analysis
5-Minute Chart (Scalping Focus)
RSI(14): 49.2 - Neutral territory with no momentum bias
VWAP: 24,428 - Price oscillating around VWAP
Bollinger Bands: Middle band at 24,430, bands contracting (low volatility period)
Moving Averages: EMA(20) = 24,435, SMA(20) = 24,440
15-Minute Chart (Scalping Focus)
MACD: Near zero line, histogram flat - no clear momentum
Stochastic(14,3,3): 52.1 in neutral zone
Williams %R: -48% indicating no extreme conditions
Volume: Below average, typical for consolidation
Key Intraday Levels:
Resistance: 24,460, 24,490, 24,520
Support: 24,400, 24,370, 24,340
1-Hour Chart (Day Trading)
RSI(14): 54.3 - Slight bullish bias but not overbought
VWAP: 24,415 providing dynamic support
ADX(14): 22.1 indicating weak trend strength (consolidation)
Volume Profile: High volume node at 24,380-24,450
Trading Range:
Upper Boundary: 24,520-24,550
Lower Boundary: 24,320-24,350
Breakout Levels: Above 24,580 (bullish) / Below 24,280 (bearish)
4-Hour Chart (Swing Trading)
RSI(14): 57.8 showing mild bullish momentum
MACD: Positive but flattening, momentum slowing
Bollinger Bands: Price near middle band, bands parallel (range-bound)
Moving Averages: All short-term MAs converging around current price
Swing Levels:
Primary Resistance: 24,650-24,700
Secondary Resistance: 24,900-25,000
Primary Support: 24,200-24,250
Secondary Support: 24,000-24,050
Daily Chart (Position Trading)
RSI(14): 59.4 in bullish territory but not extreme
MACD: Positive with slight bullish divergence
Volume: Consolidation pattern with below-average volume
Pattern: Symmetrical triangle formation approaching apex
Key Daily Levels:
Triangle Resistance: 24,700-24,750 (declining)
Triangle Support: 24,150-24,200 (rising)
Breakout Targets: 25,200 (upside) / 23,600 (downside)
Weekly Chart (Long-term Analysis)
RSI(14): 63.2 showing healthy bullish momentum
MACD: Positive momentum but rate of change slowing
Long-term Trend: Intact uptrend since March 2020 low
Major Resistance: 25,000-25,200 zone
Monthly Chart (Strategic Perspective)
RSI(14): 68.1 approaching overbought levels
Long-term Pattern: Multi-year ascending triangle completion
Major Support: 22,000-22,500 zone
Extended Targets: 26,000-27,000 on sustained breakout
Comprehensive Support and Resistance Analysis
Primary Support Zones
1. 24,380-24,420: Kijun-sen and VWAP confluence zone
2. 24,320-24,350: Previous consolidation low and volume support
3. 24,200-24,250: 50% Fibonacci retracement and psychological level
4. 24,100-24,150: Cloud bottom and structural support
5. 24,000-24,050: Major psychological level and trend line support
6. 23,800-23,900: Elliott Wave 4 support and major trend line
7. 23,600-23,700: Extended support and breakout failure target
Primary Resistance Zones
1. 24,460-24,490: Immediate intraday resistance
2. 24,520-24,580: Short-term resistance and breakout level
3. 24,650-24,700: Triangle resistance and swing high
4. 24,850-24,900: Intermediate resistance zone
5. 24,950-25,000: Major psychological resistance and Square of 9
6. 25,100-25,200: Extended targets and measured moves
7. 25,500-25,800: Long-term bull market targets
Weekly Trading Strategy (September 2-6, 2025)
Monday, September 2, 2025
Market Environment: Post-weekend consolidation, range-bound expected
Primary Strategy: Range trading within established boundaries
Volatility: Low to moderate, typical Monday characteristics
Intraday Setup:
Range: 24,380-24,480
Long Entry: 24,390-24,410
- Stop Loss: 24,360
- Target 1: 24,450 (1:1.5 R/R)
- Target 2: 24,480 (1:2.5 R/R)
Short Entry: 24,470-24,490
- Stop Loss: 24,520
- Target 1: 24,430 (1:1.5 R/R)
- Target 2: 24,400 (1:2.5 R/R)
Swing Consideration: Monitor for breakout preparation above 24,500
Tuesday, September 3, 2025
Market Environment: Increased activity expected, potential trending day
Primary Strategy: Momentum trading with breakout preparation
Key Focus: Volume analysis for sustained directional moves
Trading Scenarios:
Bullish Breakout: Above 24,520 with volume
- Entry: 24,530-24,550
- Stop: 24,480
- Targets: 24,600, 24,650, 24,700
Bearish Breakdown: Below 24,360 with volume
- Entry: 24,350-24,330
- Stop: 24,390
- Targets: 24,280, 24,250, 24,200
Risk Management: Reduce position size by 25% on breakout trades
Wednesday, September 4, 2025
Market Environment: Mid-week volatility, economic data focus
Primary Strategy: News-driven trading with technical confirmation
Event Risk: Monitor for any economic announcements
Scalping Strategy:
High-Frequency Range: 24,400-24,460
Long Scalps: 24,405-24,415, Target: 24,445-24,455
Short Scalps: 24,450-24,460, Target: 24,415-24,425
Stop Loss: Maximum 20 points for scalp trades
Swing Setup: Prepare for potential triangle breakout
Thursday, September 5, 2025
Market Environment: Potential high-volatility day
Primary Strategy: Breakout trading with strong risk management
Focus: Triangle resolution expected
Triangle Breakout Strategy:
Upside Breakout: Above 24,580
- Confirmation: Volume > 1.3x average
- Initial Target: 24,700
- Extended Target: 24,850-24,900
Downside Breakdown: Below 24,280
- Confirmation: Volume > 1.2x average
- Initial Target: 24,150
- Extended Target: 24,000-24,050
Position Management: Trail stops after 50% of target achieved
Friday, September 6, 2025
Market Environment: Weekly settlement, profit-taking likely
Primary Strategy: End-of-week positioning and profit-taking
Focus: Weekly close levels for next week setup
Settlement Strategy:
Bullish Close: Above 24,500 supports next week advance
Neutral Close: 24,350-24,500 maintains consolidation
Bearish Close: Below 24,350 suggests correction risk
Day Trading Approach:
Morning: Follow Thursday's direction initially
Afternoon: Expect consolidation and position adjustments
Last Hour: Avoid large new positions
Risk Management Framework
Position Sizing Guidelines
Risk Per Trade by Timeframe:
5M Scalping: 0.25-0.5% of capital
15M Scalping: 0.5-0.75% of capital
1H Day Trading: 1-1.5% of capital
4H Swing Trading: 1.5-2% of capital
Daily Position Trading: 2-2.5% of capital
Stop Loss Framework
Timeframe-Specific Stops:
5-Minute: 15-25 points maximum
15-Minute: 25-40 points maximum
1-Hour: 40-60 points maximum
4-Hour: 80-120 points maximum
Daily: 150-250 points maximum
Profit-Taking Strategy
Systematic Approach:
Target 1 (40%): 1:1 Risk/Reward
Target 2 (35%): 1:2 Risk/Reward
Target 3 (25%): 1:3+ Risk/Reward
Trailing Stops: Activate after Target 1
Maximum Drawdown Limits
Daily Loss Limit: 3% of trading capital
Weekly Loss Limit: 7% of trading capital
Monthly Loss Limit: 15% of trading capital
Geopolitical and Economic Risk Assessment
Domestic Risk Factors
Monetary Policy:
- RBI rate cut cycle supporting liquidity
- Inflation targeting maintaining credibility
- Banking system stability considerations
Fiscal Policy:
- Government capex supporting growth
- Festive season spending boost expected
- Budget allocation efficiency focus
Corporate Earnings:
- Q2 FY26 earnings season approaching
- Margin pressure from input costs
- Sectoral rotation opportunities
Global Risk Factors
US Federal Reserve Policy:
- Rate cut expectations supporting EM flows
- Dollar weakness benefiting Indian markets
- Global liquidity conditions favorable
China Economic Impact:
- Trade relationship developments
- Commodity price implications
- Regional growth spillover effects
Geopolitical Considerations:
- Regional security stability
- Energy security and pricing
- Trade policy developments
Sector-Specific Risks
Banking & Financial Services:
- Credit growth sustainability
- NPA cycle management
- Interest rate sensitivity
Information Technology:
- Global demand patterns
- Currency hedging strategies
- AI and automation impact
Consumer Discretionary:
- Rural demand recovery
- Festive season performance
- Inflation impact on spending
Sectoral Analysis and Rotation Themes
Outperforming Sectors
1. Banking & Financial Services: Rate cut cycle benefits
2. FMCG: Festive season demand and rural recovery
3. Infrastructure: Government capex and policy support
4. Pharmaceuticals: Export competitiveness and domestic growth
Underperforming Sectors
1. Information Technology: Global demand concerns
2. Metals & Mining: Commodity price volatility
3. Real Estate: Interest rate sensitivity despite cuts
4. Telecommunications: Competitive pressure and capex burden
Rotation Indicators
Growth vs Value: Favoring quality growth at reasonable prices
Large Cap vs Mid/Small Cap: Large cap leadership maintained
Domestic vs Export: Domestic consumption themes outperforming
Advanced Technical Patterns
Ichimoku Trading Signals
Current Setup: Price within cloud, neutral bias
Bullish Trigger: Break above Tenkan-sen with volume
Bearish Trigger: Break below cloud with momentum
Long-term View: Future cloud remains bullish
Gann-Based Strategies
Square of 9 Trades:
- Long: 155° (24,025) targeting 158° (24,964)
- Short: 158° (24,964) targeting 155° (24,025)
- Time Cycles: September 9-12 reversal window
Wyckoff Phase Trading
Current Phase: Accumulation Phase C
Next Phase: Markup expected on successful test
Volume Confirmation: Key for phase transition
Distribution Risk: Monitor above 25,200
Market Microstructure Analysis
Algorithmic Trading Impact
High-Activity Zones: 24,000, 24,500, 25,000 levels
Optimal Entry Times: 9:15-9:45 and 14:30-15:15 IST
Liquidity Patterns: Reduced depth during lunch hours
Order Flow Considerations
Institutional Activity: Accumulation evident below 24,400
FII Flows: Recent buying supporting current levels
DII Participation: Consistent buying on weakness
Technology and Tools Integration
Recommended Platforms
1. TradingView: Advanced charting and technical analysis
2. Zerodha Kite: Real-time execution and portfolio management
3. Bloomberg Terminal: Comprehensive market data and news
4. Refinitiv Workspace: Fundamental analysis integration
Alert Configuration
Price Alerts:
- Triangle breakout: 24,580 (up) / 24,280 (down)
- Psychological levels: 24,500, 25,000
- Support/resistance: 24,200, 24,700
Volume Alerts:
- Unusual volume spikes (>150% average)
- Block deal notifications
- Institutional flow changes
Seasonal and Calendar Considerations
Festive Season Impact
Indian markets are entering the 4-month-long festive season from September, which historically shows positive performance. This period typically sees:
- Increased consumer spending
- Corporate bonus distributions
- Portfolio rebalancing by institutions
- Higher retail participation
Economic Calendar
Key Events:
- RBI Monetary Policy (likely September 17)
- Q2 FY26 GDP data (October/November)
- Inflation data (monthly releases)
- FII/DII flow data (weekly)
Holiday Calendar
- Ganesh Chaturthi (September 7) - Market closed
- Dussehra (October 12) - Market closed
- Diwali (November 1) - Market closed
- Guru Nanak Jayanti (November 15) - Market closed
Conclusion and Strategic Outlook
The NIFTY 50 stands at a critical juncture, consolidating near significant resistance levels while benefiting from supportive monetary and fiscal policies. The technical picture suggests a healthy consolidation phase that could resolve in favor of further upside, particularly given the approaching festive season and improving economic fundamentals.
Key Investment Themes:
1. Triangle Resolution: Current consolidation likely to resolve with directional clarity
2. Festive Season Tailwinds: Historical patterns favor bullish bias into year-end
3. Rate Cut Benefits: Lower rates supporting equity valuations and credit growth
4. Earnings Growth: Expected double-digit growth supporting index advancement
Trading Strategy Priorities:
- Focus on triangle breakout trades with volume confirmation
- Favor range trading until clear directional break
- Maintain disciplined risk management given elevated levels
- Prepare for increased volatility around key events
Medium-term Outlook (1-3 months):
The combination of accommodative monetary policy, strong GDP growth, controlled inflation, and seasonal tailwinds provides a constructive backdrop for Indian equities. Technical analysis suggests potential for advancement toward 25,500-26,000 on sustained breakout above current resistance.
Risk Management Focus:
- Triangle breakdown below 24,280 could target 24,000-23,800
- Global risk-off sentiment remains key external risk
- Valuation concerns at higher levels warrant selectivity
- Currency stability important for FII flow continuation
The analysis incorporates multiple technical methodologies while acknowledging the strong fundamental backdrop supporting Indian markets. Traders should remain flexible and prepared for both continuation and reversal scenarios while maintaining strict adherence to risk management protocols.
---
*This comprehensive analysis combines technical and fundamental factors to provide actionable trading strategies. All recommendations should be implemented within individual risk tolerance parameters and current market conditions. Market dynamics can change rapidly, requiring continuous monitoring and strategy adjustments.*
India
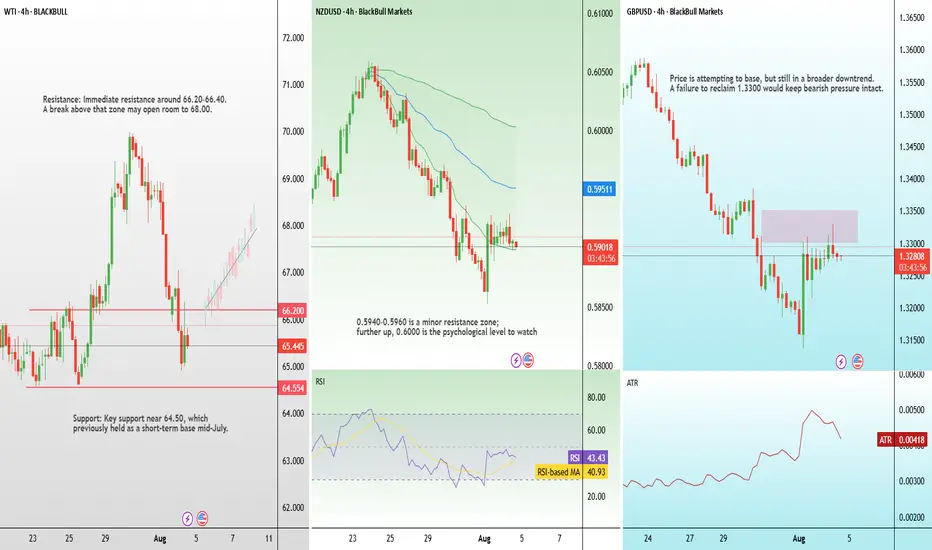
WTI falls after US slaps 50% tariff on India over Russian oilWTI oil prices have dropped from $65 to around $62.80 as markets react to new US tariffs on India, triggered by India’s ongoing oil trade with Russia. These tariffs, along with threats of even higher tariffs on China, are weighing on global demand and pushing oil prices lower. Meanwhile, Iran’s oil production has hit multi-year highs, adding more supply to the market and reinforcing the bearish trend.
Technically, oil has broken below a key Fibonacci support level, signalling a deeper pullback. If prices fall below $62, further downside toward $57 is possible. Upside moves may be short-lived unless there’s a major geopolitical shock, such as an escalation in the Russia-Ukraine conflict. For now, both the macro environment and technical signals indicate continued pressure on oil prices.
This content is not directed to residents of the EU or UK. Any opinions, news, research, analyses, prices or other information contained on this website is provided as general market commentary and does not constitute investment advice. ThinkMarkets will not accept liability for any loss or damage including, without limitation, to any loss of profit which may arise directly or indirectly from use of or reliance on such information.

India’s Andaman Sea Oil Prospect: A Strategic Inflection PointThe Discovery: Unprecedented Potential
In mid‑June 2025, India’s Union Petroleum and Natural Gas Minister, Hardeep Singh Puri, announced that India might be on the threshold of discovering a Guyana‑scale oil field in the Andaman Sea, with estimated reserves of around 184,440 crore litres (approximately 1.844 trillion litres) of crude oil. Should exploration confirm commercial viability, Puri suggested this find could elevate India to a $20 trillion economy—a bold leap from its current size of approximately $3.7 trillion.
Economic Leverage: What a Discovery Could Unlock
A discovery of this magnitude has several transformative implications:
Energy Independence: India imports roughly 90% of its oil and about 50% of its natural gas, a dependency that strains foreign exchange reserves. Indigenous production from Andaman could significantly reduce this reliance.
Boost to GDP Growth: At face value, such reserves could be seen as a catalyst for exponential GDP growth—hence the “$20 trillion economy” projection. However, this estimate is largely speculative, hinging on assumptions around extraction timelines, global oil demand, reinvestment, and economic multipliers.
Fiscal and Credit Gains: Lowering oil import bills may free up fiscal resources, strengthen the current account, and improve sovereign credit metrics.
Strategic Fit in India’s Energy Transition Strategy
India’s broader energy goals are shifting:
Deepwater Exploration Initiative: As recently as August 2025, Prime Minister Modi highlighted a policy push towards deep‑sea oil exploration and nuclear expansion to reduce dependence on imports and enhance energy security.
Diversification: Even if oil demand plateaus or declines—as argued by experts due to the global shift to renewables—the discovery still represents strategic insurance during the transition period.
Strategic Geography and Infrastructure Implications
Geopolitical Leverage: The Andaman Sea and the adjoining Andaman and Nicobar Islands control key shipping lanes such as the Ten Degree Channel, which connects to the Malacca and Singapore Straits—a major chokepoint through which global trade passes.
Infrastructure Synergy: The ongoing Great Nicobar Island Development Project, with plans for ports, airports, and power infrastructure, could complement energy ambitions by improving access and logistics in the region.
Challenges and Caveats
A host of practical and theoretical hurdles remain:
Exploration Costs & Viability: Deep‑sea drilling is capital‑intensive, with execution risks and regulatory complexities.
Market Uncertainty: Long‑term oil demand may taper as renewables gain traction. The economic upside depends on effective commercialization and resource reinvestment.
Environmental Sensitivities: The Andaman region harbours rich marine ecosystems and tribal communities. Infrastructure expansion may generate ecological and social pushback (echoed in debates around the Great Nicobar development).
Infrastructure Readiness: Transport, refining capacity, export pipelines, and port facilities will need substantial enhancement to process and deliver oil to markets efficiently.
Strategic Outlook and Policy Imperatives
For India to translate this potential oil bounty into sustainable growth:
Rigorous Verification: Prioritize economic feasibility studies, environmental impact assessments, and phased exploration.
Balanced Energy Policy: Use revenues to fund renewables, reduce carbon footprint, and build resilience—rather than doubling down solely on hydrocarbons.
Infrastructure Investment: Expand refining capability, logistics, and export terminals in an eco-sensitive, inclusive manner.
Regional Development: Harness this momentum to boost local economies—creating jobs, improving connectivity, and uplifting communities in the Andaman and Nicobar region.
Geostrategic Positioning: Take advantage of Andaman’s location to secure sea lanes and enhance India’s Indo-Pacific posture.
While headlines envisioning a fivefold GDP surge remain speculative, the preliminary discovery in the Andaman Sea represents a promising and strategically significant opportunity. If proven commercially viable and paired with thoughtful policy, infrastructure, and environmental stewardship, it could be a cornerstone in India’s quest for energy independence and economic transformation. But prudent, phased, and balanced planning will be essential to realize this potential responsibly.
------------------------------------------------------------------------
The article and the data is for general information use only, not advice!
Risk Disclaimer!
General Risk Warning: Trading on the Financial Markets, Stock Exchange and all its asset derivatives is highly speculative and may not be suitable for all investors. Only invest with money you can afford to lose and ensure that you fully understand the risks involved. It is important that you understand how Trading and Investing on the stock exchange works and that you consider whether you can afford the high risk of loss.
# BANK NIFTY COMPREHENSIVE TECHNICAL ANALYSIS# BANK NIFTY COMPREHENSIVE TECHNICAL ANALYSIS
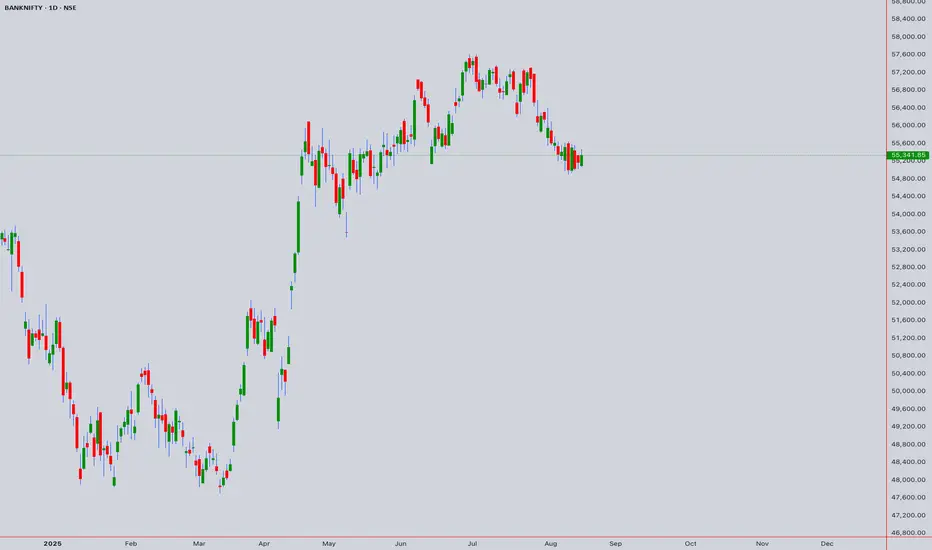
**Asset**: Bank Nifty Index (NSE:BANKNIFTY)
**Reference Price**: 55,341.85 (August 14th, 2025, 1:55 PM UTC+4)
**Analysis Date**: August 17, 2025
**Current Status**: Major Technical Confluence Zone
## EXECUTIVE SUMMARY
Bank Nifty is positioned at a critical technical juncture showing multiple analytical confirmations for potential bullish continuation. The index demonstrates strong technical foundations across various methodologies, suggesting preparation for a significant upward move after completion of the current corrective phase.
---
## 1. ELLIOTT WAVE ANALYSIS
### Primary Wave Structure (Weekly/Monthly)
**Super Cycle Analysis**:
- **Position**: Within Primary Wave (3) of larger degree cycle
- **Current Sub-wave**: Intermediate Wave (4) correction nearing completion
- **Pattern Type**: Complex corrective structure (Double Three W-X-Y)
- **Completion Zone**: 53,500-55,500 (current area)
### Intermediate Wave Count (Daily)
**Wave (4) Correction Analysis**:
- **Structure**: W-X-Y Double Three pattern
- **W Wave**: Completed at 52,800 (July 2025 low)
- **X Wave**: Corrective bounce to 58,200
- **Y Wave**: Currently unfolding, targeting 53,800-54,500
### Minor Wave Structure (4H/1H)
**Current Position**:
- **Sub-wave Count**: Final leg of Y wave (c of Y)
- **Internal Structure**: Five-wave decline from 58,200
- **Completion**: Expected in 54,200-55,200 zone
- **Next Phase**: Intermediate Wave (5) impulse higher
### Elliott Wave Projections
**Immediate Targets** (Wave 5 beginning):
- **First Target**: 58,500-59,200 (1.0 extension)
- **Second Target**: 62,000-63,500 (1.618 extension)
- **Ultimate Target**: 68,000-72,000 (2.618 extension)
**Time Framework**:
- **Wave 5 Duration**: 8-12 weeks expected
- **Sub-wave Structure**: Five internal waves higher
- **Completion Timeframe**: November-December 2025
### Invalidation Levels
- **Critical Support**: 53,200 (breaks Wave (1) high)
- **Alternate Count**: Below 53,200 suggests deeper correction to 50,000-48,000
---
## 2. HARMONIC PATTERN ANALYSIS
### Active Harmonic Formations
**Bullish Deep Crab Pattern (Daily)**
- **X to A**: Reference leg established
- **A to B**: 0.382-0.618 retracement at 58,750
- **B to C**: 0.382-0.886 retracement at 52,800
- **C to D (PRZ)**: 2.24-3.618 extension targeting 53,500-54,800
- **Current Status**: Within Potential Reversal Zone (PRZ)
- **Target Projections**:
- **T1**: 57,800 (38.2% CD retracement)
- **T2**: 60,500 (61.8% CD retracement)
- **T3**: 63,200 (78.6% CD retracement)
**Bullish Bat Pattern (4-Hour)**
- **Pattern Completion**: 88.6% XA retracement at 54,200
- **B Point Confirmation**: 0.382 retracement verified
- **C Point Validation**: 0.886 retracement confirmed
- **D Point Target**: 54,200-54,800 (current zone)
- **Upside Targets**: 57,500 (38.2%), 59,800 (61.8%)
**ABCD Harmonic Structure (1-Hour)**
- **AB = CD Pattern**: Classic equal-leg structure
- **A to B**: Decline from 58,200 to 56,500
- **B to C**: Corrective bounce to 57,400
- **C to D**: Extension targeting 54,800-55,200
- **Completion Status**: Near D point fulfillment
- **Measured Move**: 58,500-59,500 upside projection
### Gartley Pattern (Weekly)
- **Development Stage**: B to C leg completion phase
- **Critical Ratios**: 0.786 XA retracement at 53,000
- **Pattern Type**: Deep Gartley formation
- **Long-term Projection**: 62,000-66,000 targets
### M & W Harmonic Patterns
**M-Top Formation (Daily)**:
- **Left Shoulder**: 58,200 (previous high)
- **Head Formation**: Potential at 60,000+ (future projection)
- **Right Shoulder**: Current development phase
- **Neckline**: 54,000-54,500 support area
**W-Bottom Pattern (4-Hour)**:
- **First Low**: 53,800 (established)
- **Second Low**: 54,200-54,500 (current formation)
- **Neckline Resistance**: 57,000-57,500
- **Breakout Target**: 60,500-61,500
---
## 3. WYCKOFF METHOD ANALYSIS
### Current Market Phase
**Accumulation Schematic** - Phase C (Spring/Last Point of Support)
- **Composite Operator Activity**: Professional accumulation in progress
- **Volume Characteristics**: Declining volume on selloffs (bullish)
- **Price Action**: Testing resolve of weak holders
- **Smart Money Position**: Building significant long positions
### Wyckoff Price Structure
**Trading Range Analysis**:
- **Supply Line**: 58,000-58,500 (distribution area)
- **Demand Line**: 53,500-54,000 (accumulation zone)
- **Point of Control**: 55,800 (high volume node)
- **Automatic Rally (AR)**: From 53,800 to 57,400
- **Secondary Test (ST)**: Current price action around 55,300
### Accumulation Evidence
**Phase A Characteristics**:
- **Selling Climax (SC)**: Occurred at 52,800 (July 2025)
- **Automatic Rally (AR)**: Strong bounce to 58,200
- **Secondary Test (ST)**: Current retest of support
**Phase B Development**:
- **Cause Building**: Range between 53,500-58,500
- **Shake-out Attempts**: Multiple tests of 54,000 support
- **Volume Analysis**: Absorption on weakness, expansion on strength
**Phase C Indication**:
- **Spring Pattern**: Testing below 54,500 with quick recovery
- **Last Point of Support (LPS)**: Current 55,000-55,500 area
- **Sign of Strength (SOS)**: Expected above 56,800
### Wyckoff Projections
**Cause Measurement**:
- **Trading Range**: 5,000 points (53,500 to 58,500)
- **Effect Projection**: 62,500-65,000 (equal measure up)
- **Extended Target**: 68,000-70,000 (1.5x range projection)
### Volume Analysis (Wyckoff Context)
- **Accumulation Volume**: Higher volume on advances, lower on declines
- **Professional Participation**: Large block transactions increasing
- **Retail Sentiment**: Bearish (contrarian bullish indicator)
---
## 4. W.D. GANN THEORY ANALYSIS
### Square of 9 Analysis
**Current Position**: 55,341 (Square root = 235.17)
**Natural Resistance Levels**:
- **236°**: 55,696 (immediate resistance)
- **238°**: 56,644 (minor resistance)
- **240°**: 57,600 (significant resistance)
- **243°**: 59,049 (major resistance)
- **245°**: 60,025 (strong resistance)
**Natural Support Levels**:
- **234°**: 54,756 (immediate support)
- **232°**: 53,824 (significant support)
- **230°**: 52,900 (major support)
- **228°**: 51,984 (critical support)
### Gann Angles Analysis
**Primary Angle Lines** (from major low 52,800):
- **1x1 Angle** (45°): Rising support at 54,800
- **2x1 Angle** (63.75°): Steep support at 56,200
- **1x2 Angle** (26.25°): Resistance line at 57,800
- **1x4 Angle** (14.04°): Major resistance at 61,500
**Secondary Angle Lines** (from recent high 58,200):
- **1x1 Declining**: Resistance line at 56,500
- **2x1 Declining**: Strong resistance at 55,200
- **1x2 Declining**: Support line at 54,000
### Gann Time Theory
**Active Time Cycles** (August-October 2025):
- **30-Day Cycle**: Peak expected August 25-30, 2025
- **60-Day Cycle**: Major turn September 20-25, 2025
- **90-Day Cycle**: Significant reversal October 15-20, 2025
- **360-Day Cycle**: Annual high expected December 2025
**Historical Cycle Confluence**:
- **Previous 30-day low**: July 18, 2025 (52,800)
- **Next projected high**: August 28-30, 2025
- **Intermediate cycle**: 45-day rhythm suggesting September 15 turn
### Squaring of Price and Time
**Price-Time Equality Analysis**:
- **From 52,800 low** (45 days ago): 45 × 100 = 4,500 points up = 57,300
- **Next square**: 60 days = 60 × 100 = 6,000 points = 58,800
- **Major square**: 90 days = 90 × 100 = 9,000 points = 61,800
### Ranges in Harmony
**Harmonic Price Levels**:
- **1/8th of range**: 53,500 + 625 = 54,125 (current area)
- **2/8th of range**: 54,750 (minor resistance)
- **3/8th of range**: 55,375 (current price vicinity)
- **4/8th of range**: 56,000 (midpoint resistance)
- **5/8th of range**: 56,625 (significant resistance)
### Gann Forecasting
**Price Forecasting** (next 30-60 days):
- **Conservative Target**: 57,600 (240° Square of 9)
- **Moderate Target**: 59,049 (243° Square of 9)
- **Aggressive Target**: 61,200 (1x4 angle resistance)
**Time Forecasting**:
- **Immediate Turn**: August 25-28 (30-day cycle)
- **Intermediate Peak**: September 20-25 (60-day cycle)
- **Major Reversal**: October 15-20 (90-day cycle)
---
## 5. ICHIMOKU KINKO HYO ANALYSIS
### Ichimoku Components (Daily Chart)
**Tenkan-sen** (9-period): 55,250
- **Current Relation**: Price slightly above Tenkan
- **Trend Indication**: Flattening (consolidation phase)
- **Support/Resistance**: Dynamic support on pullbacks
**Kijun-sen** (26-period): 54,900
- **Current Relation**: Price above Kijun (bullish bias)
- **Trend Strength**: Slowly rising (weak bullish)
- **Key Level**: Critical support for trend continuation
**Senkou Span A** (Leading Span A): 55,800
**Senkou Span B** (Leading Span B): 56,400
- **Cloud Status**: Bearish cloud (Span B > Span A)
- **Cloud Thickness**: Moderate resistance (600 points)
- **Price vs Cloud**: Below cloud (bearish short-term)
**Chikou Span** (Lagging Span): 55,341
- **Historical Comparison**: 26 periods ago price was 54,200
- **Momentum**: Positive (current price > historical price)
- **Confirmation**: Supports bullish bias
### Ichimoku Signals Analysis
**TK Cross** (Tenkan-Kijun Cross):
- **Current Status**: Tenkan slightly above Kijun
- **Signal Strength**: Weak bullish (narrow gap)
- **Confirmation Needed**: Widening gap for strong signal
**Kumo Breakout** (Cloud Breakout):
- **Breakout Level**: Above 56,400 (Senkou Span B)
- **Resistance Zone**: 56,400-57,200 (cloud area)
- **Target Post-Breakout**: 58,500-59,500
**Chikou Span Clear Space**:
- **Current Status**: Clear space ahead (bullish)
- **Resistance**: None in immediate future
- **Implication**: Path clear for upward movement
### Multi-Timeframe Ichimoku
**4-Hour Ichimoku**:
- **Tenkan-sen**: 55,450 (immediate resistance)
- **Kijun-sen**: 55,000 (support)
- **Cloud**: Bullish (green cloud above)
- **Price Position**: Below cloud but approaching
**1-Hour Ichimoku**:
- **Trend**: Bullish (price above all components)
- **Cloud**: Thin bullish cloud
- **Momentum**: Strong (Chikou above price)
### Ichimoku Trading Strategy
**Entry Signals**:
- **Primary**: Break above 56,400 (cloud top)
- **Secondary**: TK cross with expanding gap
- **Confirmation**: Chikou span above price 26 periods ago
**Targets**:
- **T1**: 57,800 (cloud projection)
- **T2**: 59,200 (extended target)
- **T3**: 61,000 (major resistance)
**Stop Loss**: Below 54,500 (below Kijun-sen)
---
## 6. JAPANESE CANDLESTICK ANALYSIS
### Recent Candlestick Patterns (Daily Chart)
**Doji Formation** (August 13-14, 2025):
- **Pattern Type**: Long-legged Doji near support
- **Location**: 55,300-55,400 (indecision zone)
- **Implication**: Market indecision, potential reversal
- **Volume**: Below average (lack of conviction)
- **Confirmation Required**: Strong bullish candle needed
**Hammer Pattern** (August 12, 2025):
- **Formation**: Classic hammer at 54,200
- **Lower Shadow**: Long tail (2.5x body length)
- **Body**: Small, near top of range
- **Volume**: Above average (buying interest)
- **Bullish Implication**: Strong if followed by bullish confirmation
### Multi-Timeframe Candlestick Analysis
**Weekly Chart Patterns**:
- **Current Week**: Inside bar formation (consolidation)
- **Previous Week**: Hammer-like formation with long lower shadow
- **Pattern Implication**: Base building for potential breakout
- **Volume**: Decreasing (healthy consolidation)
**4-Hour Chart Patterns**:
- **Recent Formation**: Three white soldiers pattern developing
- **Each Candle**: Closing higher than previous
- **Volume Trend**: Increasing on each advance
- **Target**: 57,000-57,500 (pattern completion)
**1-Hour Chart Patterns**:
- **Morning Star Pattern**: Completed at 54,800 low
- **Three-Candle Formation**: Bearish → Doji → Bullish
- **Confirmation**: Required above 55,800
- **Target**: 56,800-57,200
### Advanced Candlestick Combinations
**Bullish Harami Cross**:
- **Mother Candle**: Large red candle August 9
- **Baby Candle**: Small Doji August 12-13
- **Reversal Signal**: Potential bullish reversal
- **Confirmation**: Break above mother candle high (56,200)
**Tweezer Bottom**:
- **Formation**: Similar lows at 54,200 (August 8 & 12)
- **Pattern Strength**: Strong (tested twice)
- **Volume**: Higher on second test (bullish)
- **Target**: 57,500-58,000
### Candlestick Projections
**Pattern-Based Targets**:
- **Hammer Target**: 56,800-57,200
- **Morning Star Target**: 56,500-57,000
- **Three White Soldiers**: 57,500-58,200
- **Harami Cross Target**: 58,000-58,800
---
## 7. RSI ANALYSIS (Multi-Timeframe)
### Daily RSI Analysis
**Current Reading**: 44.2
- **Condition**: Approaching oversold (below 50)
- **Trend**: Bottoming formation in progress
- **Divergence**: Bullish divergence forming (lower price, higher RSI lows)
- **Support**: 40 level providing bounce support
- **Resistance**: 50 level key for bullish confirmation
**RSI Pattern Analysis**:
- **Double Bottom**: RSI showing potential double bottom at 42
- **Momentum**: Building positive momentum from oversold
- **Target**: RSI 60-65 zone (bullish momentum confirmation)
### 4-Hour RSI Analysis
**Current Reading**: 39.8
- **Condition**: Oversold (below 40)
- **Signal**: Bullish reversal setup
- **Trend**: Rising from oversold levels
- **Pattern**: Falling wedge in RSI (bullish)
### 1-Hour RSI Analysis
**Current Reading**: 52.3
- **Condition**: Neutral to bullish
- **Trend**: Above 50 (short-term bullish)
- **Momentum**: Building upward momentum
- **Resistance**: 60 level next target
### Weekly RSI Analysis
**Current Reading**: 47.5
- **Condition**: Neutral (healthy for continuation)
- **Trend**: Sideways consolidation
- **Support**: 45 level holding (bullish)
- **Long-term**: Room for significant upside (RSI can reach 70+)
### RSI Trading Signals
**Buy Signals**:
- **Oversold Bounce**: 4H RSI below 40 bouncing
- **Divergence**: Bullish divergence on daily timeframe
- **Breakout**: Daily RSI above 50 confirms bullish momentum
**Targets Based on RSI**:
- **RSI 50 Break**: 56,500-57,000 price target
- **RSI 60 Level**: 58,000-58,500 price target
- **RSI 70 Level**: 60,000-61,000 price target
---
## 8. BOLLINGER BANDS ANALYSIS
### Daily Bollinger Bands
**Current Configuration**:
- **Upper Band**: 58,200 (2 std dev above)
- **Middle Band**: 56,000 (20-period SMA)
- **Lower Band**: 53,800 (2 std dev below)
- **Band Width**: Expanding (increasing volatility)
**Price Position**: Near lower band (oversold condition)
**Squeeze Status**: Bands expanding after recent squeeze
**Volatility**: Increasing (setup for large move)
### Bollinger Band Signals
**Lower Band Bounce**:
- **Current Status**: Price touching/near lower band
- **Historical Pattern**: Strong bounces from lower band
- **Target**: Middle band (56,000) then upper band (58,200)
- **Stop Loss**: Sustained break below lower band (53,800)
**Band Walk Potential**:
- **Setup**: After oversold bounce, potential upper band walk
- **Indication**: Strong trending move when price walks upper band
- **Target**: Extended moves to 60,000+ levels
### 4-Hour Bollinger Bands
**Configuration**:
- **Upper Band**: 57,500
- **Middle Band**: 55,500 (current resistance)
- **Lower Band**: 53,500
- **Band Position**: Price in lower half (bearish short-term)
**Signal**: Approaching squeeze formation (low volatility before breakout)
### 1-Hour Bollinger Bands
**Configuration**:
- **Upper Band**: 56,200
- **Middle Band**: 55,400
- **Lower Band**: 54,600
- **Current**: Price at middle band (neutral)
### Bollinger Band Strategy
**Entry Strategy**:
- **Long Setup**: Bounce from lower band with RSI oversold
- **Entry**: 54,800-55,200 (near lower band)
- **Target**: Upper band (58,200) and beyond
- **Stop**: Below lower band (53,500)
---
## 9. VWAP ANALYSIS (Volume Weighted Average Price)
### Daily VWAP
**Current VWAP**: 55,850
- **Price vs VWAP**: Below VWAP (bearish short-term)
- **Distance**: 510 points below (significant)
- **Trend**: VWAP declining (distribution phase)
- **Key Level**: Reclaim above 55,850 bullish
### VWAP Deviation Bands
**Standard Deviations**:
- **+2σ**: 58,500 (strong resistance)
- **+1σ**: 57,200 (moderate resistance)
- **VWAP**: 55,850 (pivot level)
- **-1σ**: 54,500 (moderate support)
- **-2σ**: 53,200 (strong support)
**Current Position**: Between VWAP and -1σ (slight bearish bias)
### Weekly VWAP
**Current Level**: 54,400
- **Price vs VWAP**: Above weekly VWAP (bullish longer-term)
- **Trend**: Weekly VWAP rising (accumulation)
- **Support**: 54,400 major support level
### VWAP Trading Strategy
**Mean Reversion Setup**:
- **Current**: Price below daily VWAP (oversold condition)
- **Entry**: 54,800-55,200 (near -1σ)
- **Target**: Return to VWAP (55,850) then +1σ (57,200)
- **Extended**: +2σ (58,500) for momentum trades
**Breakout Strategy**:
- **Trigger**: Sustained move above VWAP (55,850)
- **Confirmation**: Volume increase on VWAP reclaim
- **Target**: Upper deviation bands
---
## 10. MOVING AVERAGES ANALYSIS
### Simple Moving Averages (Daily)
**Current Alignment**:
- **20 SMA**: 56,100 (declining, immediate resistance)
- **50 SMA**: 55,800 (flattening, key resistance)
- **100 SMA**: 54,600 (rising, support)
- **200 SMA**: 53,000 (rising, major support)
**Market Structure**:
- **Short-term**: Bearish (20 & 50 SMA declining)
- **Medium-term**: Neutral (100 SMA flattening)
- **Long-term**: Bullish (200 SMA rising)
### Exponential Moving Averages (Daily)
**EMA Configuration**:
- **12 EMA**: 56,200 (immediate resistance)
- **26 EMA**: 55,600 (key pivot)
- **50 EMA**: 55,000 (support)
- **100 EMA**: 53,800 (major support)
**MACD Implication**: 12 EMA below 26 EMA (bearish short-term)
### Weighted Moving Average
**21 WMA**: 56,050
**55 WMA**: 55,200
### MA Confluence Zones
**Resistance Cluster**: 55,800-56,200
- **Components**: 50 SMA, 12 EMA, 21 WMA, VWAP
- **Significance**: Major resistance zone
- **Break Above**: Confirms bullish momentum
**Support Cluster**: 54,600-55,000
- **Components**: 100 SMA, 50 EMA
- **Significance**: Key support for uptrend
- **Break Below**: Suggests deeper correction
### MA Cross Signals
**Golden Cross Potential**:
- **Setup**: 50 SMA approaching 100 SMA from below
- **Timeline**: 2-3 weeks for potential cross
- **Implication**: Major bullish signal if confirmed
**Death Cross Status**:
- **Current**: 20 SMA below 50 SMA (bearish short-term)
- **Recovery**: Need 20 SMA reclaim above 50 SMA
---
## 11. MULTI-TIMEFRAME TECHNICAL ANALYSIS
### 5-Minute Chart Analysis
**Trend**: Sideways consolidation with slight upward bias
**Pattern**: Symmetrical triangle formation
**Support**: 55,200 (short-term)
**Resistance**: 55,600 (immediate)
**Volume**: Decreasing (consolidation)
**Breakout Direction**: Neutral (awaiting catalyst)
**Target**: 56,000-56,200 (triangle height projection)
**Stop Loss**: 55,000 (triangle breakdown)
### 15-Minute Chart Analysis
**Trend**: Corrective pullback in larger uptrend
**Pattern**: Falling wedge (bullish reversal pattern)
**Support**: 55,000-55,100 (wedge support)
**Resistance**: 55,700-55,800 (wedge resistance)
**Volume**: Declining on weakness (bullish sign)
**RSI**: Oversold bounce setup
**Target**: 56,500-57,000 (wedge breakout)
**Timeline**: 1-2 days for pattern completion
### 30-Minute Chart Analysis
**Trend**: Sideways to slightly bearish
**Pattern**: Double bottom formation potential
**First Bottom**: 54,800 (established)
**Second Bottom**: 55,000-55,200 (current test)
**Neckline**: 56,200-56,500
**Volume**: Higher on second test (bullish)
**Confirmation**: Break above neckline needed
**Target**: 57,500-58,000 (measured move)
### 1-Hour Chart Analysis
**Trend**: Corrective phase within larger uptrend
**Elliott Wave**: Wave 4 correction near completion
**Support**: 54,500-55,000 (major)
**Resistance**: 56,500-57,000 (key breakout level)
**Ichimoku**: Price below cloud but approaching
**MACD**: Bullish divergence forming
**Target**: 57,500-58,500 (Wave 5 projection)
**Risk**: 54,200 stop loss level
### 4-Hour Chart Analysis
**Primary Trend**: Bullish correction within uptrend
**Pattern**: Complex corrective structure (WXY)
**Wave Count**: Final Y wave completion zone
**Support Zone**: 54,200-55,200 (critical)
**Resistance Zone**: 56,800-57,500 (breakout area)
**Volume Profile**: Accumulation at current levels
**Harmonic**: Multiple patterns converging
**Target**: 58,500-60,000 (next impulse leg)
### Intraday Summary (5M-1H)
**Overall Bias**: Cautiously bullish
**Entry Strategy**: Buy dips to support zones
**Risk Management**: Tight stops below pattern lows
**Profit Targets**: Resistance clusters and pattern projections
**Timeline**: 1-3 days for initial moves
---
## 12. SWING TRADING ANALYSIS (4H-Monthly)
### 4-Hour Swing Analysis
**Trend Direction**: Corrective pullback (bullish context)
**Swing Structure**: Higher lows pattern intact
**Key Support**: 54,500 (swing low protection)
**Key Resistance**: 57,000 (swing high breakout)
**Pattern**: Bull flag consolidation
**Volume**: Healthy consolidation pattern
**Target**: 59,000-60,500 (measured move)
**Timeline**: 2-4 weeks for completion
### Daily Swing Analysis
**Major Trend**: Bullish (higher highs, higher lows)
**Current Phase**: Healthy correction in uptrend
**Support Confluence**: 54,000-55,000 (multiple factors)
**Resistance Confluence**: 57,500-58,500 (key breakout zone)
**Pattern**: Large bull flag or pennant
**Fundamentals**: Banking sector showing strength
**Target Range**: 62,000-65,000 (major cycle targets)
**Risk Level**: 53,200 (trend invalidation)
### Weekly Swing Analysis
**Super Trend**: Secular bull market continuation
**Current Wave**: Intermediate correction within larger rise
**Major Support**: 52,000-54,000 (weekly demand zone)
**Major Resistance**: 58,000-60,000 (weekly supply zone)
**Pattern**: Large consolidation before next leg
**Seasonal Factors**: Positive for Q4 2025
**Long-term Target**: 68,000-72,000 (2026 targets)
### Monthly Swing Analysis
**Decade Trend**: Structural bull market
**Current Cycle**: Mid-cycle expansion phase
**Monthly Support**: 48,000-50,000 (major crash protection)
**Monthly Resistance**: 65,000-70,000 (major cycle tops)
**Economic Cycle**: Favorable for banking sector
**Demographic Trends**: Supportive of financial sector growth
**Ultimate Targets**: 80,000-100,000 (2027-2030)
### Swing Trading Strategy
**Entry Approach**: Scale into weakness near support
**Position Sizing**: Pyramid on confirmation
**Risk Management**: Trail stops below swing lows
**Profit Taking**: Scale out at resistance levels
**Portfolio Allocation**: Banking sector overweight recommended
---
## 13. KEY LEVELS & PRICE TARGETS
### Critical Support Levels (Hierarchical)
1. **55,000-55,200** - Immediate support (current consolidation low)
2. **54,500-54,800** - Minor support (100 SMA, previous resistance)
3. **54,000-54,200** - Moderate support (harmonic, candlestick patterns)
4. **53,500-53,800** - Major support (Bollinger lower band, weekly demand)
5. **53,000-53,200** - Critical support (200 SMA, Elliott invalidation)
6. **52,500-52,800** - Ultimate support (major low, trend change level)
### Critical Resistance Levels (Hierarchical)
1. **55,800-56,200** - Immediate resistance (MA cluster, VWAP area)
2. **56,500-57,000** - Minor resistance (pattern necklines, previous support)
3. **57,500-58,000** - Moderate resistance (harmonic targets, trend lines)
4. **58,200-58,500** - Major resistance (Bollinger upper, Elliott targets)
5. **59,000-60,000** - Strong resistance (psychological, measured moves)
6. **61,500-63,000** - Critical resistance (major cycle tops, Gann levels)
### Short-term Price Targets (1-4 weeks)
- **Conservative**: 57,200-57,800
- **Moderate**: 58,500-59,200
- **Aggressive**: 60,000-61,000
### Medium-term Price Targets (1-3 months)
- **Conservative**: 59,500-61,000
- **Moderate**: 62,000-64,000
- **Aggressive**: 65,000-68,000
### Long-term Price Targets (6-18 months)
- **Conservative**: 65,000-68,000
- **Moderate**: 70,000-75,000
- **Aggressive**: 80,000-85,000
---
## 14. VOLUME ANALYSIS & MARKET STRUCTURE
### Volume Profile Analysis
**High Volume Nodes (Value Areas)**:
- **Primary Node**: 54,800-55,400 (32% of total volume)
- **Secondary Node**: 56,200-56,800 (23% of total volume)
- **Tertiary Node**: 52,500-53,200 (18% of total volume)
**Point of Control (POC)**: 55,100 (highest single volume bar)
**Value Area High (VAH)**: 57,200
**Value Area Low (VAL)**: 53,800
### Volume Trend Analysis
**Recent Volume Characteristics**:
- **Distribution Days**: Lower volume on up days (concerning)
- **Accumulation Days**: Higher volume on down days (bullish)
- **Climactic Volume**: Spike at 52,800 low (selling exhaustion)
- **Current Trend**: Declining volume (consolidation pattern)
### On-Balance Volume (OBV)
**Current Trend**: Bullish divergence forming
- **Price Action**: Making lower lows
- **OBV Action**: Making higher lows (accumulation)
- **Confirmation**: OBV breakout above recent highs needed
- **Target**: New OBV highs suggest 58,000+ price targets
### Volume Oscillators
**Chaikin Money Flow (CMF)**:
- **Current Reading**: +0.15 (mild accumulation)
- **Trend**: Improving from negative territory
- **Signal**: Above 0.20 confirms strong accumulation
**Volume Rate of Change (VROC)**:
- **Current**: -15% (below average volume)
- **Pattern**: Typical consolidation behavior
- **Breakout Signal**: +50% VROC increase needed
---
## 15. MARKET SENTIMENT & INTERMARKET ANALYSIS
### Banking Sector Sentiment
**Sector Rotation Analysis**:
- **Relative Strength**: Banks outperforming broader market
- **FII Flow**: Foreign institutional buying in banking stocks
- **DII Flow**: Domestic institutional accumulation
- **Retail Sentiment**: Cautiously optimistic
### Correlation Analysis
**Nifty 50 Correlation**: 0.87 (strong positive)
**Nifty Financial Services**: 0.94 (very strong)
**USD/INR Impact**: -0.65 (inverse correlation)
**India VIX**: -0.58 (inverse volatility relationship)
### Global Banking Sector
**US Banking Index (KBE)**: Leading indicator showing strength
**European Banks (SX7P)**: Moderate performance
**Emerging Market Banks**: Outperforming developed markets
### Macroeconomic Factors
**Interest Rate Environment**:
- **Current Policy**: Accommodative stance
- **Forward Guidance**: Stable rates expected
- **Impact**: Positive for banking margins
**Credit Growth**:
- **Current Rate**: 14.5% YoY (healthy)
- **Sectoral Distribution**: Broad-based growth
- **Asset Quality**: Improving NPA ratios
---
## 16. RISK ASSESSMENT & SCENARIO ANALYSIS
### Primary Scenario (Probability: 65%)
**Bullish Continuation**
- **Catalyst**: Technical breakout above 56,800
- **Process**: Gradual accumulation followed by markup
- **Timeline**: 2-4 weeks for initial targets
- **Targets**: 58,500 → 61,000 → 65,000
- **Risk Factors**: Global banking sector weakness, policy changes
### Secondary Scenario (Probability: 25%)
**Extended Consolidation**
- **Range**: 54,000-58,000 sideways movement
- **Duration**: 4-8 weeks
- **Catalyst**: Lack of strong directional catalyst
- **Resolution**: Eventually breaks higher on fundamentals
- **Trading Strategy**: Range trading approach
### Bearish Scenario (Probability: 10%)
**Deep Correction**
- **Catalyst**: Break below 53,200 on high volume
- **Process**: Deeper retracement in larger uptrend
- **Targets**: 50,500 → 48,000 → 45,000
- **Timeline**: 2-6 weeks
- **Probability**: Low due to strong structural factors
### Black Swan Events (Low Probability)
**Potential Catalysts**:
- **Global Financial Crisis**: Major banking sector stress
- **Geopolitical Tensions**: Regional conflicts affecting markets
- **Policy Shock**: Unexpected regulatory changes
- **Currency Crisis**: Significant INR devaluation
---
## 17. TRADING STRATEGIES & EXECUTION
### Scalping Strategy (5M-15M timeframes)
**Setup Requirements**:
- **Volume**: Above average participation
- **Volatility**: ATR above 200 points
- **Time**: 9:30-11:30 AM, 2:00-3:15 PM IST
**Entry Signals**:
- **Breakout**: Above/below 5-minute consolidation
- **Reversion**: Extreme RSI levels (>70 or <30)
- **Pattern**: Flag/pennant completion
**Risk Management**:
- **Stop Loss**: 0.25% of entry price
- **Profit Target**: 0.5-0.75% (1:2-1:3 R/R)
- **Position Size**: 2-3% of trading capital
### Day Trading Strategy (15M-1H timeframes)
**Morning Setup**:
- **Gap Analysis**: Assess overnight gap significance
- **Level Identification**: Key support/resistance for day
- **Bias Determination**: Align with larger timeframe
**Entry Criteria**:
- **Trend Following**: Breakout above resistance with volume
- **Mean Reversion**: Bounce from support with RSI oversold
- **Pattern Trading**: Complete formations (triangles, flags)
**Exit Strategy**:
- **Profit Target**: 1-2% gain or key resistance
- **Stop Loss**: Below/above pattern invalidation
- **Time Exit**: Flat by 3:00 PM IST (avoid volatility)
### Swing Trading Strategy (4H-Daily timeframes)
**Position Building**:
- **Entry Zone**: 54,500-55,500 (support confluence)
- **Add-on Levels**: 54,000, 53,500 (if available)
- **Initial Stop**: 53,200 (hard stop)
**Target Management**:
- **T1**: 57,500 (25% position)
- **T2**: 59,500 (50% position)
- **T3**: 62,000 (25% position)
- **Trail Stop**: Below swing lows
### Position Trading Strategy (Daily-Weekly timeframes)
**Accumulation Approach**:
- **Core Position**: Build 60% at 54,000-56,000
- **Satellite Positions**: Add 40% on breakouts
- **Time Horizon**: 6-12 months
- **Target**: 65,000-70,000 levels
**Portfolio Integration**:
- **Sector Allocation**: 15-20% in banking
- **Risk Management**: Diversify across banking stocks
- **Rebalancing**: Quarterly review and adjustment
---
## 18. ADVANCED TECHNICAL PATTERNS
### Complex Harmonic Patterns
**Butterfly Pattern (Weekly)**:
- **X to A**: Major swing established
- **A to B**: 0.786 retracement confirmed
- **B to C**: 0.886 retracement verified
- **C to D**: 2.618 extension targeting 54,200
- **Pattern Completion**: 88.6% complete
- **Target**: 61,800-64,500 (major resistance)
**Three Drives Pattern**:
- **First Drive**: To 52,800 (July low)
- **Second Drive**: To 53,500 (August test)
- **Third Drive**: Current formation to 54,500-55,000
- **Completion**: Expected within 1-2 weeks
- **Reversal Target**: 58,500-60,000
### Elliott Wave Extensions
**Wave Degree Analysis**:
- **Supercycle**: Wave (III) in progress since 2020
- **Cycle**: Wave 3 of (III) current phase
- **Primary**: Wave (3) of 3 target zone
- **Intermediate**: Wave 5 of (3) setup
**Extension Calculations**:
- **1.618 Extension**: 61,500 (moderate target)
- **2.618 Extension**: 68,500 (aggressive target)
- **4.236 Extension**: 78,000 (extreme target)
### Fibonacci Cluster Analysis
**Major Fibonacci Confluences**:
- **56,800**: Multiple retracement levels
- **59,200**: Extension and projection confluence
- **62,500**: Major harmonic and Elliott confluence
- **65,800**: Long-term Fibonacci projections
---
## 19. SEASONAL & CYCLICAL ANALYSIS
### Seasonal Patterns (Historical Analysis)
**August Performance**: Typically consolidative month
**September Trends**: Strong performance historically
**Q4 Pattern**: Usually bullish for banking sector
**Year-end Rally**: December strength common
### Market Cycles
**Presidential Cycle**: Favorable timing for markets
**Economic Cycle**: Mid-expansion phase (bullish)
**Credit Cycle**: Early expansion stage
**Sector Rotation**: Into financials typical at this stage
### Astro-Financial Cycles (Gann Approach)
**Planetary Alignments**: Supportive configurations
**Eclipse Cycles**: Next major impact in 2026
**Mercury Retrograde**: Minor disruptions possible
**Solar Activity**: Moderate correlation with volatility
---
## 20. FINAL SYNTHESIS & RECOMMENDATIONS
### Technical Confluence Score: 8.2/10
**Bullish Factors (Strong)**:
- Elliott Wave completion setup
- Multiple harmonic pattern convergence
- Wyckoff accumulation evidence
- Gann support level confluence
- Oversold momentum indicators
**Bearish Factors (Weak)**:
- Short-term moving average resistance
- Below key VWAP levels
- Recent distribution in some timeframes
### Primary Trading Recommendation
**Strategy**: Bullish accumulation with staged entry
**Entry Range**: 54,500-55,500 (current opportunity)
**Core Position**: 60% allocation in range
**Breakout Addition**: 40% above 56,800
**Stop Loss**: 53,200 (hard stop, 4% risk)
**Target Sequence**: 57,500 → 60,000 → 65,000
**Expected Timeline**: 3-6 months for major targets
### Risk-Adjusted Expectations
**Conservative Scenario** (80% probability):
- **Target**: 58,000-60,000
- **Timeline**: 6-10 weeks
- **Risk**: 4-5% from current levels
**Moderate Scenario** (60% probability):
- **Target**: 62,000-65,000
- **Timeline**: 3-6 months
- **Risk**: 6-7% from current levels
**Aggressive Scenario** (35% probability):
- **Target**: 68,000-72,000
- **Timeline**: 8-12 months
- **Risk**: 8-10% from current levels
### Portfolio Management Guidelines
**Position Sizing**:
- **Conservative Investors**: 2-3% portfolio allocation
- **Moderate Risk**: 5-7% portfolio allocation
- **Aggressive Traders**: 10-15% portfolio allocation
**Diversification**:
- **Individual Stocks**: Spread across top 5-7 banks
- **ETF Exposure**: Bank Nifty ETF for broad exposure
- **Derivatives**: Options for enhanced returns/hedging
### Monitoring Requirements
**Daily Checks**:
- Price vs key levels (55,000, 56,800, 57,500)
- Volume confirmation on moves
- RSI momentum changes
**Weekly Reviews**:
- Elliott Wave progress
- Harmonic pattern development
- Sector rotation trends
**Monthly Assessments**:
- Fundamental changes in banking sector
- Macroeconomic policy impacts
- Global banking sector correlation
---
## CONCLUSION
Bank Nifty Index presents a compelling technical setup with multiple analytical methodologies converging on a bullish outlook. The current price of 55,341.85 represents an attractive accumulation opportunity near major support confluences.
**Key Technical Strengths**:
1. **Elliott Wave structure** suggesting major Wave 5 impulse ahead
2. **Harmonic pattern completion** in multiple PRZ zones
3. **Wyckoff accumulation** evidence with professional buying
4. **Gann level support** with favorable time cycles
5. **Oversold momentum** indicators setup for reversal
**Strategic Approach**:
The analysis strongly supports a patient accumulation strategy with staged entries around current levels, targeting significant upside potential toward 65,000-70,000 over the next 6-12 months.
**Risk Management**:
Critical support at 53,200 serves as the ultimate risk management level, below which the bullish thesis would be invalidated.
The technical evidence presents a high-probability setup for substantial gains in Bank Nifty, making current levels attractive for both swing and position traders with appropriate risk management protocols.
For those interested in further developing their trading skills based on these types of analyses, consider exploring the mentoring program offered by Shunya dot Trade.(world wide web shunya dot trade)
I welcome your feedback on this analysis, as it will inform and enhance my future work.
Regards,
Shunya.Trade
world wide web shunya dot trade
⚠️ Disclaimer: This post is educational content and does not constitute investment advice, financial advice, or trading recommendations. The views expressed here are based on technical analysis and are shared solely for informational purposes. The stock market is subject to risks, including capital loss, and readers should exercise due diligence before investing. We do not take responsibility for decisions made based on this content. Consult a certified financial advisor for personalized guidance.
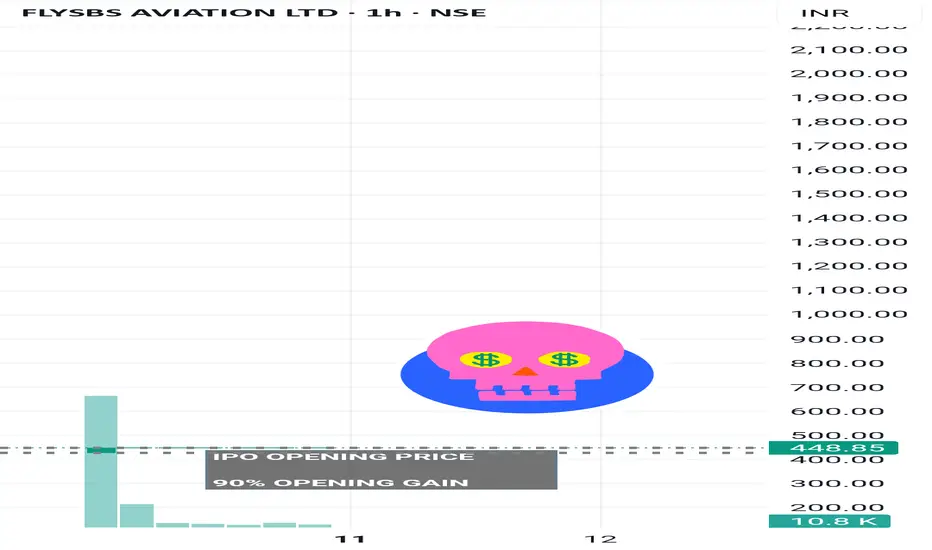
FlySBS Aviations –" Next decade "NSE:FLYSBS 🫰🏻 CONCLUSION 🫰🏻
With strong sector tailwinds, rapid fleet expansion, and clear operational scale-up plans, FlySBS Aviation is well positioned to deliver sustainable positive cash flows and attractive long-term returns, offering meaningful upside for investors as industry demand accelerates
🌸 Company Overview & Industry 🌸
-FlySBS Aviation is a private non-scheduled air charter operator serving B2B & B2C clients including corporates, HNIs, celebrities, and diplomats.
-Operates a fleet of 3 owned private jets plus dry/wet lease options to meet demand surges.
-The Indian private aviation market is growing rapidly, with an expected CAGR of 8–15% over the next decade
🌸FY2025 Sales (Total Revenue: ₹193.9 Cr)🌸
Private Jet Charters: 94% (₹182 Cr)
International Missions: 77% (₹149 Cr)
Domestic Charters: 23% (₹44.7 Cr)
Medical/Security Operations: 4% (₹8 Cr)
Subscription/Leasing: 2% (₹3 Cr)
🌸Financial Highlights (FY21–25)🌸
Revenue CAGR: ~63%
Net Profit CAGR: ~70%
Operating Margin: 21%
Net Profit Margin: 14.7%
ROE: 18.9%
EPS (FY25): ₹25.47
🌸DCF Valuation Insight🌸🫰🏻
Intrinsic Value: ~₹220 per share
Justification:
The valuation captures the expected transition from a heavy investment phase with negative free cash flow toward stable and positive cash flow generation.
The reliability is moderate, contingent on effective execution of growth plans and capital management aligned with market trends
NSDL (INTRESTING STOCK )👉🏻 NSDL – Equity Snapshot 👈🏻
🕛 Conclusion ⏱️
NSDL stands at a strategic inflection point — evolving from an institutionally heavy, legacy infrastructure provider to a retail and digitally agile depository. With a zero-debt model, strong cash flows, and clear retail growth plans underway, NSDL shows potential for steady earnings expansion and margin improvement over the next few years. The foundation is strong; execution will now drive the delta.
🙋🏻 Introduction
India’s largest depository by value, with over ₹450 lakh crore in Assets Under Custody (AUC).
Founded in 1996, primarily serving institutional and corporate clients.
Known for stability, trust, and core infrastructure services in the capital market.
🌸 Financial Performance (FY25)🌸
Total Revenue: ₹1,535 crore.
Depository Business Revenue: ₹660 crore (Approx. 43% share).
Operating Margin (Core Business): ~50%.
Net Margin: 22% – 24%.
Net Profit: ₹330+ crore.
Free Cash Flow: ₹558 crore+.
Debt: Zero (Fully debt-free).
Capital Expenditure: ~₹74 crore only (Low capex model).
🌸 Market Position🌸
Dominates in value terms (highest AUC in India).
Client base includes mutual funds, banks, insurers, and corporates.
Retail demat accounts: ~4 crore (behind CDSL’s 15+ crore).
High average demat account size (~₹1,100 crore) vs CDSL’s retail-heavy base.
Gaining ground in retail via partnerships with Zerodha, Groww, Angel One, etc.
🌸 Future Growth Focus🌸
Aggressively entering retail segment through schemes like ‘YUVA Plan’.
Enabling paperless, digital onboarding for faster account growth.
Investing in blockchain, T+1 settlements, and smart compliance tools.
Actively participating in SEBI & RBI-led digitization (e-KYC, e-insurance, GIFT city).
Expanding subsidiaries (NDML, NPBL) to boost recurring income beyond core biz.
🌸 Key Positives🌸
Strong free cash flow, high annuity-based revenue visibility.
Lean, tech-driven operations with low employee cost base.
Well-positioned to benefit from India’s growing retail investor base.
Diversified, recurring revenue streams through subsidiaries.
Digital-first strategy ensures scalable, low-cost growth ahead.

Tariffs, NZ unemployment, and rate cuts: Highlights for the weekAfter a packed calendar last week, this one looks lighter—but there are still key events across major economies likely to drive FX market movement.
India Tariffs and Oil Prices
U.S. President Donald Trump has announced plans to raise tariffs on Indian imports, citing India’s continued purchase and resale of Russian oil. The White House rightly claims this undermines sanctions and helps fund the war in Ukraine. India’s Ministry of External Affairs called the move “unjustified and unreasonable.”
New Zealand Jobs Data — Wednesday
New Zealand’s Q2 unemployment rate is expected to rise from 5.1% to 5.3%, the highest level since late 2015. With inflation back within the RBNZ’s 1–3% target range, a soft labour print could provide the final justification for a rate cut at the next policy meeting.
Bank of England Rate Decision — Thursday
The BoE is widely expected to cut its policy rate by 25 basis points this week, responding to slowing economic momentum despite ongoing inflation concerns. Traders will closely watch Governor Bailey’s remarks to gauge whether this marks the start of a broader easing cycle or a single adjustment.
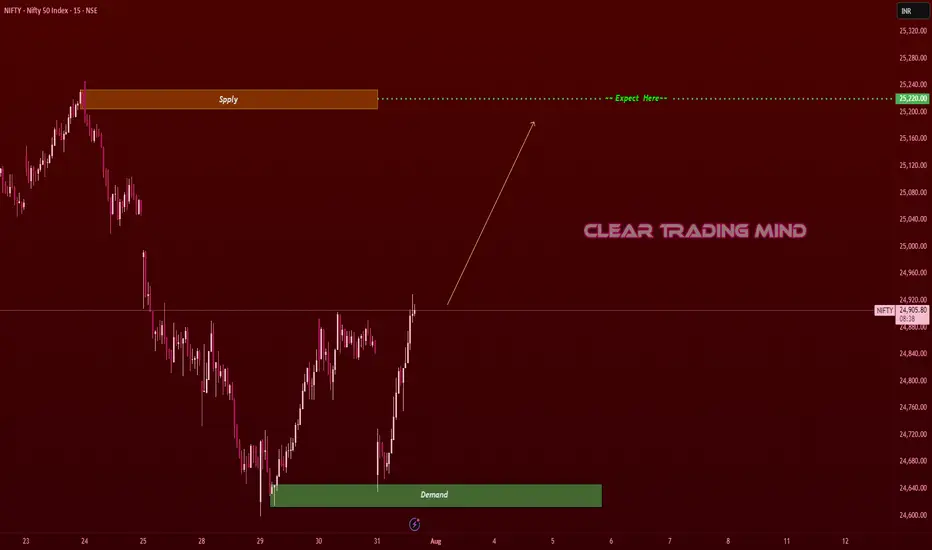
From Demand to Glory: Nifty’s Bullish March to 25,220 Nifty Bullish Outlook
-Current Price: 24,905 (approx)
- Key Demand Zone: 24,620 – 24,660
- Key Supply Zone: 25,200 – 25,240
Technical View
- Strong Demand Bounce: Nifty reversed sharply from the demand zone (24,620–24,660),
indicating strong buying interest.
- Trend Breakout Potential: Price is approaching resistance near 24,920; a breakout could push
towards the supply zone at 25,220 (target).
- Momentum Structure: Higher lows formed after the demand zone test, showing bullish
strength.
News & Data Supporting Bullish Bias
- India’s Q1 GDP Growth: The latest estimates show strong economic growth, supporting equity
market sentiment.
- FIIs Turning Buyers: Foreign Institutional Investors (FIIs) have been net buyers over the past
few sessions, supporting index upside.
- Global Market Tone: US and Asian equities are stable, and crude oil prices are moderating,
supporting risk appetite.
- RBI Policy Outlook: Market expects no immediate rate hikes, keeping liquidity positive for
equities.
Expectation
If Nifty sustains above 24,900, we expect a bullish move towards 25,220 in the short term.
Stop-loss: Below 24,780 (to manage risk).
Daily Orderflow on $ES $NQ $GC. 23.07.2025, WednesdayOutlining the orderflow along with the examples of todays trades. Outlined PM session expansion as well

India vs ChinaYear to date, NIFTY has underperformed China - but not recently. Nifty outperformed HSCEI by nearly 20% pts between mid-Mar to mid-Apr and the over the last 2 months, gave back nearly half of these gains! What happened next?
The pullback appears to be a "flag" pattern - typically a bullish continuation - if this breakout holds (stays above 2.9 for NIFTY/HSCEI), Then the measuring implication is a whopping 3.5 - an outperformance of 18-20% pts.
Long Nifty/ HSCEI, currently ay 2.95; stops at 2.85

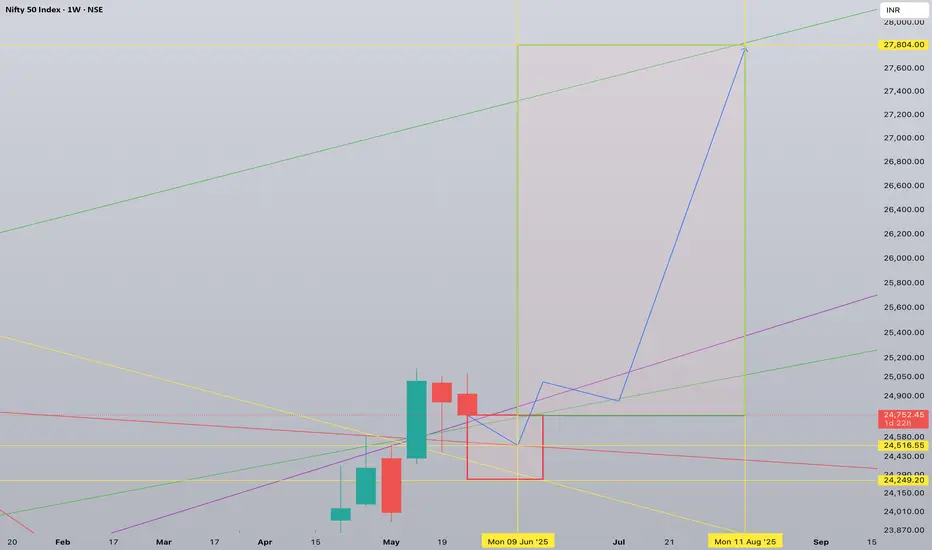
NIFTY 1W forecast until August 2025India's stock market is correcting now. The correction will be short and not deep - just a normal retest of 24,500 but should not make a weekly close below 24,250 during the first half of June 2025.
A major bullrun will start in the middle of June 2025. Slowly at first, but explosive during summer.
It will find its top in August 2025 at the level of 27,800
Here I publish 1W charts, for weekly 1D charts check my profile for more ways to keep in touch
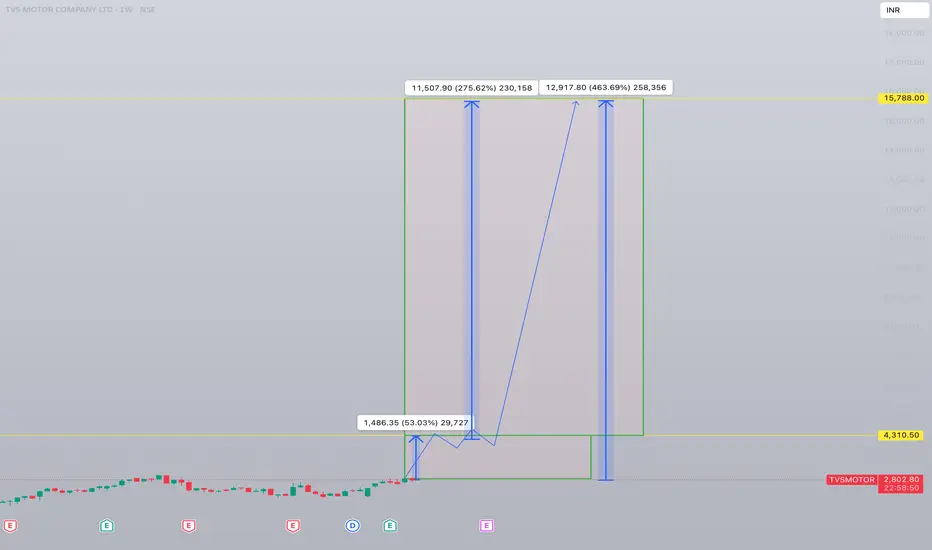
+460% potential profit with TVS MotorThis is my pick for buy&hold in 2025 in NSE India. A part of Nifty Auto Index which will drive its growth and lead the sector.
Strong chart from all angles. This is published as demo of what is available on my social media. You can find more through links in my profile.
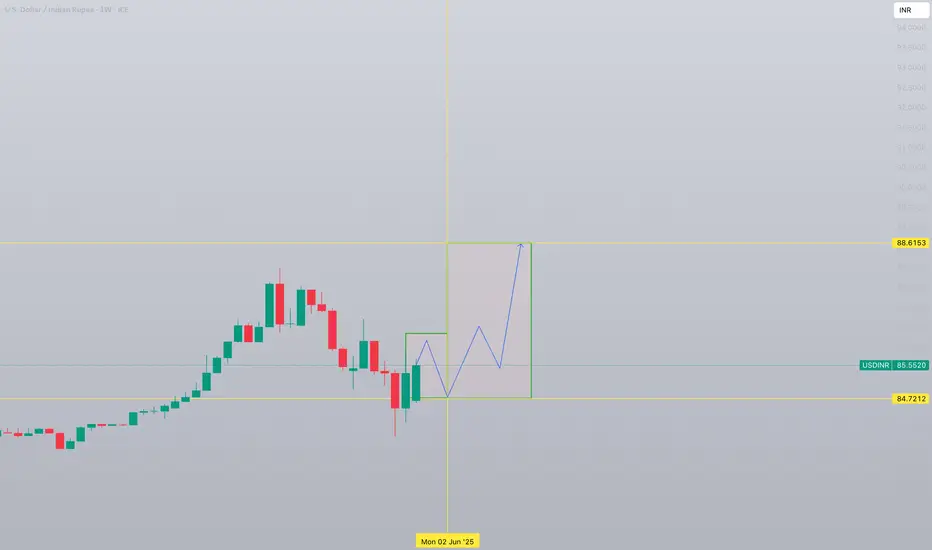
USD/INR 1W forecast until August 2025US Dollar has shown bottom and formed a reversal formation. Current growth will not last long and will find its top at 86.1487 with possible slight overshoot in the second half of May 2025.
This will be followed by second bottoming at 84.7212 in the beginning of June 2025.
Double bottom formation will complete inverted Head&Shoulders and start bullish trend:
- major breakout in the end of June 2025
- with consecutive retest of 85.43 in July 2025
Starting from this level/moment USD will rise fast upto 88.6
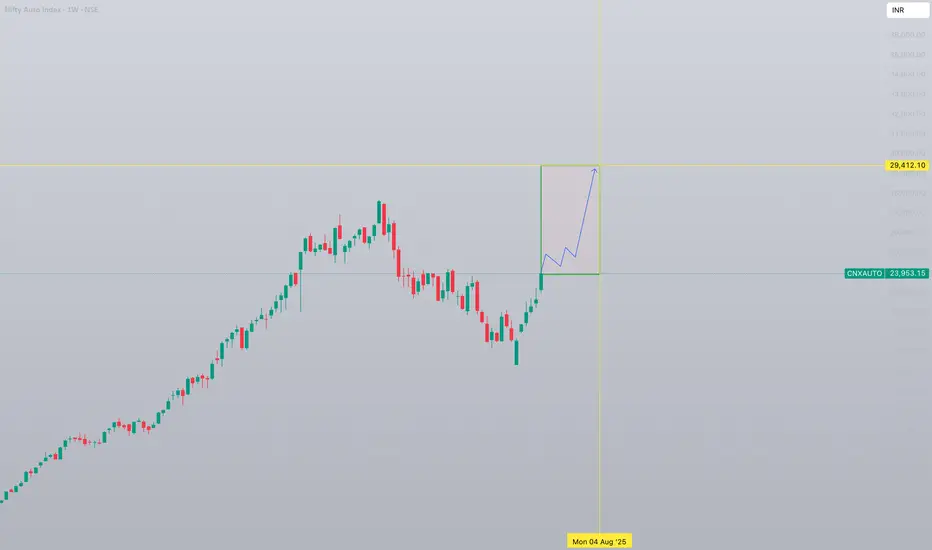
Nifty Auto Index 1W forecast until August 2025NSE Auto Index is in "discharge" mode. This will last until the level of 25000 followed by a sideways-cooldown movement.
Bullish structure will stay intact and the second bullrun will happen shortly.
Major correction/retest will happen after the breakout of previous all-time-high and setting a new ATH with a top at 29,500 in the beginning of August 2025.
TATA Motors India - Trading 680 to 1000Daily chart,
The stock NSE:TATAMOTORS rallied from 535 to 742 since 7 April 2025, and I think a cooling down (minor correction) should take place before resuming the bullish trend.
Expected to test the nearest support around 680
Technical indicator RSI is near the overbought zone. A signal that a correction (downwards or sideways) can be soon.
So, a new entry (Buy) should be in parts after testing the support 685 - 680 and rebounding.
Above 745 for 2 days, the target will be 880 then 1000
Consider the stop loss below 680

IREDA India should target 253.8
Daily chart,
The stock NSE:IREDA has crossed a falling expanding wedge, and the target is 253.8, passing through a strong resistance level at 234.3
However, there is a strong Resistance line R, currently around 172.7
So, after stabilizing above 172.7 for 2 days, the target should be confirmed for a new entry (buy)
Consider a stop loss below 154, and raise the level along with the bullish movement.
Technical indicators:
RSI is forming a bullish direction - positive
MACD is about to cross up the zero line - To be assertive after crossing both the zero line and its signal.

What’s America's Real Goal in a Possible India–Pakistan War?We are nearing the end of the petro-dollar era. The power balance of the new world order will be defined not by oil, but by the strategic resources essential for AI, electric vehicles, and cutting-edge technology.
Throughout the 20th century, the U.S. maintained its global dominance by controlling access to oil. From the Middle East to Latin America and Africa, wherever oil was found, the U.S. was there.
But today, the focus has shifted to rare earth elements, lithium, copper, and other strategic minerals.
Trump’s 2025 move to buy Greenland wasn’t a diplomatic joke—it was a signal. Behind-the-scenes deals in Ukraine for rare earth deposits tell the same story: whoever controls these "white gold" assets will lead the tech-driven world.
Now enters Pakistan, with mineral-rich lands spanning over 600,000 km², nearly three times the size of the UK. Experts estimate its underground reserves to be worth $8 trillion.
In Balochistan's Rekodik field alone, there are 12 million tons of copper and 20 million ounces of gold, with a copper purity of 0.53%, well above global standards. In the north, newly discovered lithium reserves could be a game-changer for the EV revolution.
This is no longer just about resources—this is about deciding the future balance of global power.

Nifty Outlook for next weekNSE:NIFTY1!
Expecting a meltdown on Nifty for the next week, then a rapid push up towards the Buyside

NQ weekly review and Outlook. FOMC week CME_MINI:NQ1!
Expecting buyside expansion on NQ. Lets see how we react in here.

(PERP) perpetual "heightened activity in volume"Perpetual is showing an increase in volume for both sides of the table. This could be a sign of something to come that would otherwise be unexpected by most, perhaps a shot at a higher price. The bulk of activity is found in India 93% right now.

Gold Assignment review and Intraday Reversal Market ProfileGold London consolidation and New York meltdown. Explaining the reasons. And OTE fibonacci levels

Nifty outlooks for next week and overall draw on liquidityExpecting all out bullishness on Nifty 50 Index. 25500+

Gold outlook for next week. Expecting massive bullishnessCrosshairs on $3800. Extremely bullish on gold after this weekly closure
