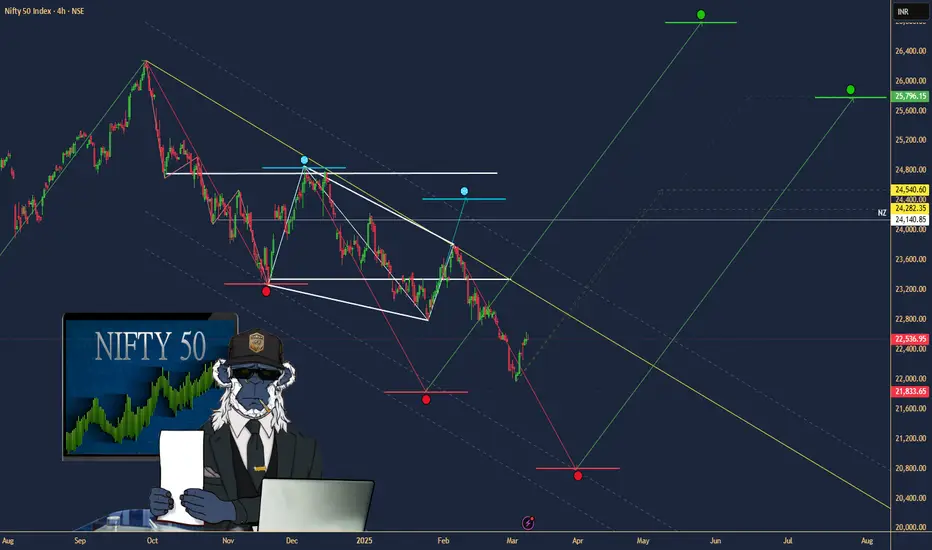
$NIFTY: Nifty 50 – India’s Market Meltdown or Hidden Gem?(1/9)
Good Morning, folks! ☀️ NSE:NIFTY : Nifty 50 – India’s Market Meltdown or Hidden Gem?
Gift Nifty’s at 22,555, down 65 points, and the index is off 13% since October 2024! Is this a crash landing or a golden ticket in disguise? Let’s unpack the chaos! 🔍
(2/9) – PRICE PERFORMANCE 📊
• Gift Nifty: 22,555, down 65 points (Mar 6, 2025) 💰
• Recent Trend: 13% drop from Oct 2024 highs 📏
• Sector Mood: Autos, real estate dragging, per web reports 🌩️
It’s a bumpy ride, but bargains might be brewing! 🔧
(3/9) – MARKET POSITION 📈
• Index Weight: 50 top Indian firms, 65% of NSE market cap 🏅
• Scope: Spans 13 sectors, from banks to tech ⏳
• Trend: Bearish streak persists, down 13% since Oct 🎯
Still a heavyweight, but feeling the squeeze! 🌐
(4/9) – KEY DEVELOPMENTS 🔑
• Earnings Slowdown: Growth at 5%, down from 20%+ 🔄
• Macro Woes: U.S. tariffs, trade tensions spook investors 🌍
• Market Vibe: Gift Nifty signals a sour start 📋
Tough times, but sectors might shine through! 💡
(5/9) – RISKS IN FOCUS ⚡
• Geopolitics: U.S. tariff threats hit exports 🔍
• Sector Slump: Autos, real estate under pressure 📉
• Volatility: Bearish trend grips tight 🌪️
Rough waters ahead, but storms pass! 🛡️
(6/9) – SWOT: STRENGTHS 💪
• Diversity: 13 sectors, broad economic play 🏆
• Scale: Tracks India’s biggest players 📈
• Value: Potentially undervalued, per web buzz 🔩
A battered champ with fight left! 💼
(7/9) – SWOT: WEAKNESSES & OPPORTUNITIES ⚖️
• Weaknesses: 5% earnings growth, macro drag 📉
• Opportunities: Sector plays in banks, tech shine 📈
Can it dodge the punches and rally? 🤔
(8/9) – 📢Nifty at 22,555 (Gift), down 13%—your call? 🗳️
• Bullish: $24K soon, undervalued steal 🦬
• Neutral: Flatline, risks offset ⚖️
• Bearish: $20K next, bears rule 🐻
Vote below! 👇
(9/9) – FINAL TAKEAWAY 🎯
Nifty’s 13% slide and $116 Gift price signal trouble 📉, but undervalued sectors tease upside 🌱. Volatility’s our mate—dips are DCA fuel 🔥. Buy low, aim high! Hit or miss?
Indiamarkets
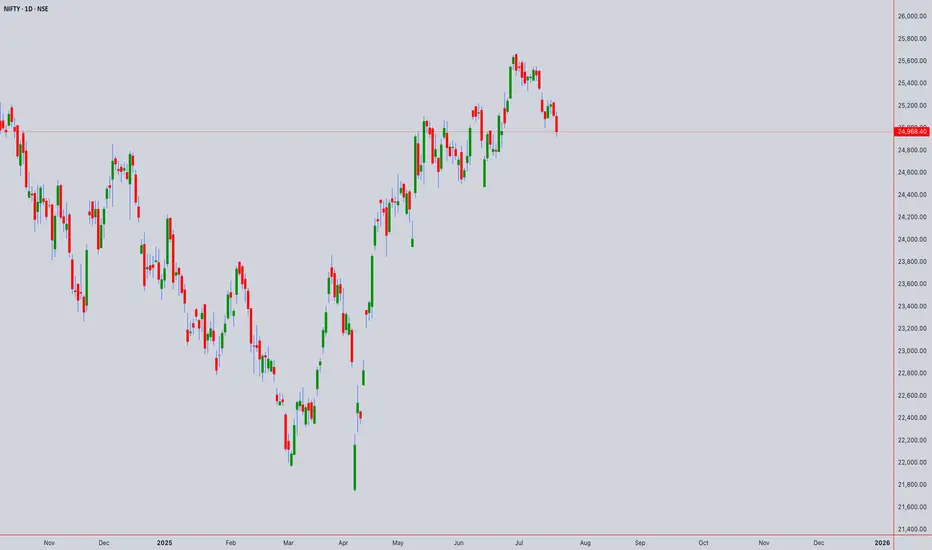
Technical Analysis: NIFTY50 (Closing: ₹24,968.40 on 18-Jul-2025)*Analysis as of 21-Jul-2025 (Monday)*
1. Candlestick Patterns
Daily: A bearish engulfing pattern formed on 18-Jul-2025, closing below the prior candle’s low. Signals short-term reversal risk.
Weekly: Doji formation (indecision) near all-time highs. Weekly close below ₹25,000 warns of exhaustion.
Intraday (4H): Bearish pin bars at ₹25,100 resistance. Watch for follow-through selling below ₹24,900.
2. Harmonic Patterns
Daily: Potential Bearish Bat pattern in development:
XA: ₹23,200 → ₹25,200 (100%)
B: 61.8% retracement at ₹24,400 (pending)
Confirmation below ₹24,400 targets ₹23,800 (0.886XA).
3. Elliott Wave Theory
Weekly: Final waves of Wave 5 (impulse) likely complete at ₹25,200.
Daily: Starting ABC corrective wave:
Wave A: ₹25,200 → ₹24,800 (if breaks ₹24,900)
Wave B: Rally to ₹25,000–25,100 (short opportunity)
Wave C: Target ₹24,300 (1.618xA).
Intraday (1H): Minute wave iii down in progress below ₹24,950.
4. Wyckoff Theory
Phase: Potential distribution near highs:
Upthrust (18-Jul high ₹25,120) failed to hold.
Spring Level: ₹24,900. Break confirms downtrend (test supply).
Downside target: ₹24,500 (fall after distribution).
5. W.D. Gann Analysis
Square of 9:
Key support: √24,968 ≈ 158.0 → 158² = 24,964 (critical pivot).
Close below 24,964 opens ₹24,650 (next square).
Time Cycles:
21-Jul is 180° from 21-Jan 2025 high. Watch for trend change.
Gann Angle: 1x1 angle from Jul-2025 high at ₹25,200 → breaks below imply ₹400/day decline.
6. Ichimoku Kinko Hyo (Daily)
Tenkan: ₹24,950 (resistance)
Kijun: ₹24,800 (support)
Cloud: Lagging span below price; cloud thinning (bearish momentum).
Signal: Price below Kijun → trend weakness.
7. Key Indicators
RSI (Daily): 62 → declining from overbought (70). Bearish divergence.
Bollinger Bands (4H): Price testing lower band (₹24,900). Break targets ₹24,600 (2σ lower).
VWAP (1H): ₹25,050 → intraday resistance.
Moving Averages:
Death Cross (50-DMA/200-DMA): Not triggered, but 5-DMA (₹25,020) crossed below 20-DMA (₹25,050).
Timeframe Summary
Timeframe Key Levels Bias Pattern/Thesis
5M/15M Res: ₹24,990 Bearish Scalp shorts below VWAP (₹25,050)
30M/1H Res: ₹25,050 Sup: ₹24,900 Bearish Bearish EW wave iii; RSI < 50
4H Res: ₹25,100 Sup: ₹24,800 Neutral Break below ₹24,800 confirms Wyckoff distribution
Daily Res: ₹25,200 Sup: ₹24,400 Bearish Bearish Bat + ABC correction
Weekly Res: ₹25,500 Sup: ₹24,000 Neutral Doji warns of reversal; hold ₹24,400 key
Actionable Outlook
Intraday (21-Jul):
Short below ₹24,900 (SL: ₹25,050) → Target ₹24,800.
Break below ₹24,800 extends to ₹24,650.
Swing (1–2 Weeks):
Sell rallies near ₹25,100 (SL: ₹25,250) → Target ₹24,400.
Weekly close > ₹25,200 invalidates bearish view.
Critical Supports: ₹24,800 (Wyckoff spring) → ₹24,400 (Harmonic/EW target) → ₹24,000 (psychological).
Key Resistances: ₹25,050 (VWAP) → ₹25,200 (ATH) → ₹25,500 (Gann square).
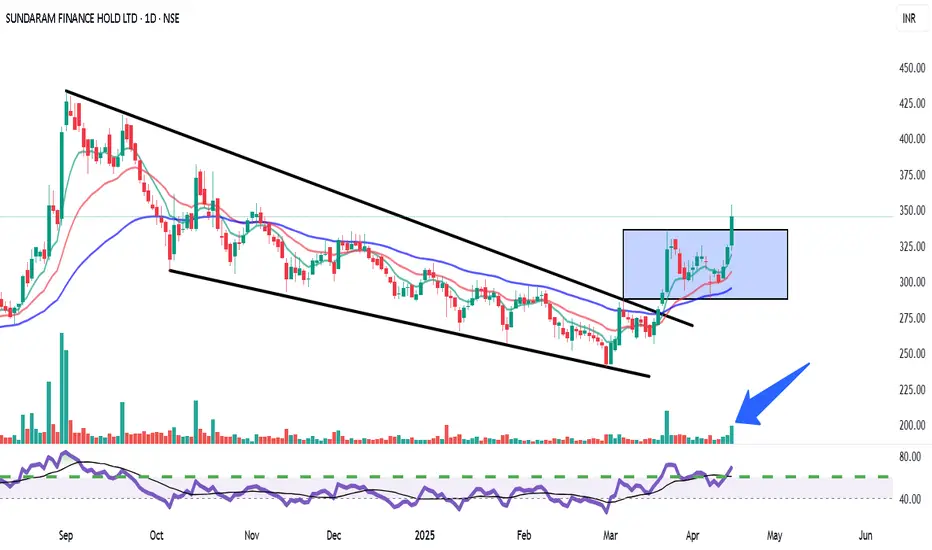
Sundaram Finance | Falling Wedge Breakout with Strong Volume Pattern: Falling Wedge breakout followed by consolidation (bullish continuation).
Breakout Confirmation: Clean breakout from both the wedge and the consolidation box with strong volume.
Indicators:
Volume: Spike visible (🔵 arrow) – confirming strength.
RSI: Crossed above 60 – entering bullish momentum territory.
EMAs: Price trading above all major EMAs – trend supportive.
Buy Recommendation:
Entry Range: ₹340–₹350
(Post-breakout retest may offer ideal entries if available)
🎯 Target Levels:
Short-Term Target: ₹375
Mid-Term Target: ₹410–₹425
(Based on previous swing highs and wedge height projection)
🛑 Stop Loss:
SL Level: ₹320 (below the consolidation box low)
for educational purposes only