HCL Copper 1M, TF Anticipating Growth & Key Levels ⚙️ Materials: Commodity Cycle Turnaround
(Green energy metals, China recovery)
Government of India Enterprise
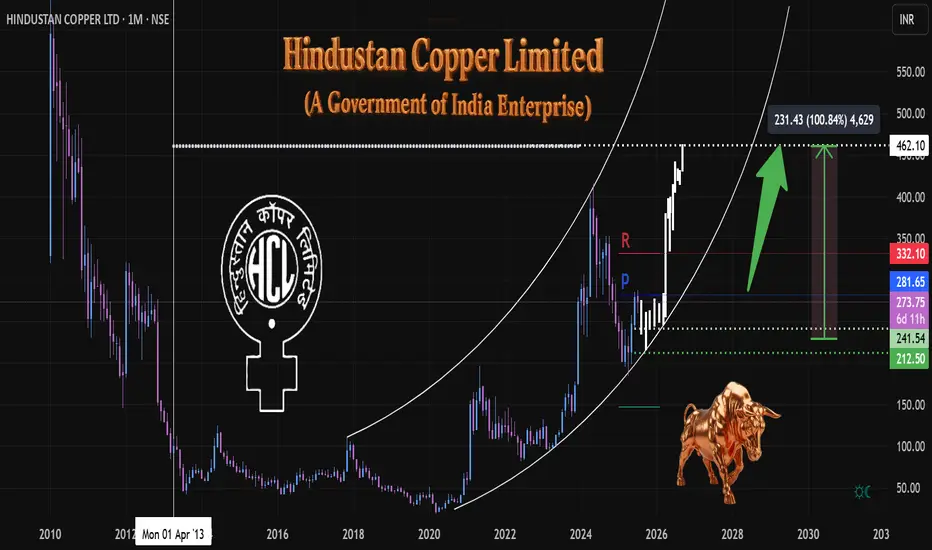
Hindustan Copper Limited (HCL)
The company is undergoing a significant mine expansion, projecting a 5x increase in output. This positive development is already reflected in institutional interest, with DIIs increasing their exposure by 8.2% in Q1.
At the time of this analysis, the price stood at 273.
We've observed a volume climax at the bottom, suggesting a potential exhaustion of selling pressure and a base formation.
The white ghost candles pattern illustrate an anticipated future price path, which I project based on current market dynamics and patterns. This projection outlines a potential trajectory we will monitor closely as price develops.
A strong engulfing bullish candle formation above the 281 pivot (🔵) would signal significant bull strength and confirm a strong upward momentum.
A confirmed breakout above the monthly resistance level (🔴) would be a critical bullish signal. initiating further long positions upon a successful retest of this breakout level.
My primary accumulation zone for potential entries is identified in green (🟢 dotted), ranging between 241 and 212. This range represents an area where I anticipate favorable risk-reward for entry.
Target & Time Horizon:
While precise timing is always challenging, I estimate the projected target up to 100% ( above in the white dotted line) could be reached around Q2 2026 or before as markets perform.
Disclaimer:
This analysis represents a personal projection
based on current market observations.
Trade Safely,
Always DYOR
#हिन्दुस्तान कॉपर लिमिटेड
#indianeconomygrowth
Indianeconomy
Long Term Nifty Analysis.(With Economic Commentary). We saw phenomenal resistance by Indian markets today after the Tariff announcements. Nifty bounced back and at one point was 330 points above low of the day. However there was Profit booking and selling on bounce due to prevailing Tariff uncertainties and Nifty came of the peak to close at 24768. Even after losing a lot of ground which it gained it ended up 133 points from the low of the day. Nifty ended the day in the negative losing 87.6 points from yesterday's close. This was much better than estimation of many experts. We might not be out of the woods yet but nevertheless fight back was phenomenal.
Now coming to Tariffs. I am not an expert in economy but let us assume the worst case scenario that trade negotiations fail and this is the tariff stays at 25% + Penalty. Again assuming that we loose 50% of our exports to US due to this decision. Say tariff would apply to 50b worth goods exported by us to USA and we 25b worth business. The impact on GDP will be as under.
GDP Impact = 25b/3.7T= 0.0067 = 0.67% of our GDP will be shaved off..(Rough Estimate). So say our is say 6.5. Then we continue to grow at 5.9 or 5.8. (Again I am not an expert and this estimate is based on a lot of assumption). This loss of GDP can be covered by increasing local consumption or exploring other market. Enhancing ties with markets outside USA. Thus it is not something which is going to kill Indian markets. We survived 1991, We survived Covid, We survived, Ukraine - Russia war, Israel-Iran conflict, Operation Sindoor Lows so we will survive this too and continue thriving. India is destined to become 3rd Largest Economy and unless there are local / internal political mishaps or mess-ups our growth will continue.
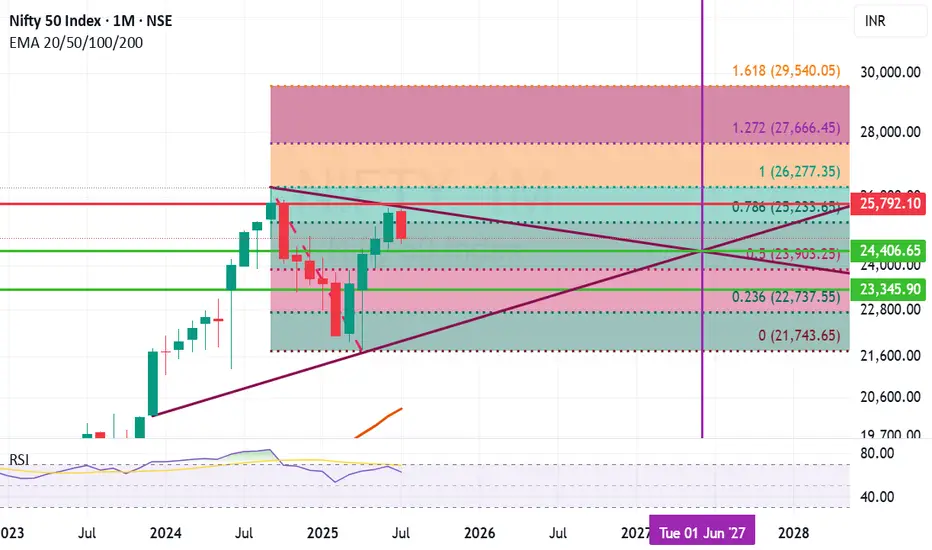
Fibonacci retracement of Nifty ant trend line analysis suggests few important support and resistance levels. The Horizontal line in the chart here suggests the cut off date. The chart suggests that:
Important Supports for Nifty remain at: 24406 (Mid Trend Support), 23903 (Important Fibonacci Support), 23345 (Important Candle support), (Below 23345 Nifty becomes very week and we will be in Bear grip where bears can drag Nifty down to 22737 or even 21742 in unlikely circumstances).
Important Resistance Levels: 25233 (Important Fibonacci resistance), 25792 (Important Candle resistance), 26277 (Previous All Time high), In the long term we might reach 27666 or even 29540 in close to 24 months time.
Conclusion:
Scenario 1) Indian Growth story continues and business thrive the optimistic range for Nifty by June 2027 seems to be the range between 26277 to 29540 or above.
Scenario 2) Indian economy faces changes and internal / external issues hamper progress the pessimistic range for Nifty by June 2027 seems to be anywhere between 23090 to 26277.
Scenario 3) Local or Global catastrophic events unfurl. Global and Indian economy takes a hit (Long drawn wars or local political leadership changes, Covid like events etc.) during this time frame 23090 to 21743 or below..(This does not seem likely but you never say never).
Disclaimer: The above information is provided for educational purpose, analysis and paper trading only. Please don't treat this as a buy or sell recommendation for the stock or index. The Techno-Funda analysis is based on data that is more than 3 months old. Supports and Resistances are determined by historic past peaks and Valley in the chart. Many other indicators and patterns like EMA, RSI, MACD, Volumes, Fibonacci, parallel channel etc. use historic data which is 3 months or older cyclical points. There is no guarantee they will work in future as markets are highly volatile and swings in prices are also due to macro and micro factors based on actions taken by the company as well as region and global events. Equity investment is subject to risks. I or my clients or family members might have positions in the stocks that we mention in our educational posts. We will not be responsible for any Profit or loss that may occur due to any financial decision taken based on any data provided in this message. Do consult your investment advisor before taking any financial decisions. Stop losses should be an important part of any investment in equity.
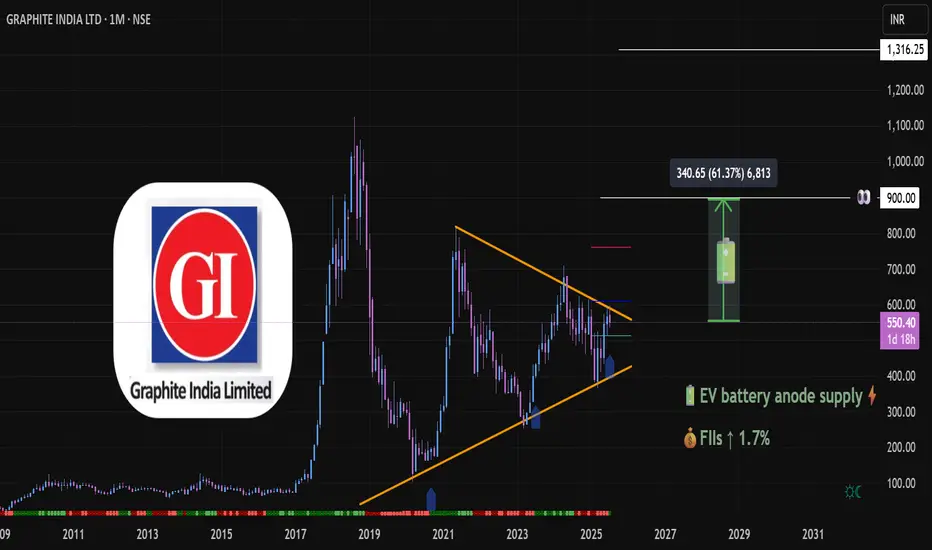
Graphite India (1M TF) - Big Technical Base ►NSE:GRAPHITE
⚙️ Materials: Commodity Cycle Turnaround
(Green energy metals, China recovery)
Sector context: India’s rising graphite demand (e.g. electrode expansion for steel, battery material on horizon) aligns well with Graphite India’s positioning.
►Graphite India is the largest producer of graphite electrodes in the country and one of the largest in the world.
At the time of charting NSE:GRAPHITE PA was at 550
PA in 1D TF has bounced from Support
Trend 1M TF: Long-term Symmetrical 📐triangle formation since 2018 highs — price now testing upper trendline
Monthly shows range‑bound to mild consolidation since topping near ₹623 and bouncing around ₹540‑560.
Multi-year consolidation forming a textbook volatility squeeze, often a precursor to explosive directional moves. Volume compression inside the triangle suggests strong hands accumulating.
Candlestick structure: Bullish engulfing-type recovery candle forming off the trendline support. Breakout Energy above 586 = potential energy. A monthly close👀 above the downtrend line may unlock significant upside ⇗ momentum.
Daily MACD turning positive, weekly and monthly crossovers 🟢suggest building momentum.
Monthly Resistance line 762🔴 Pivot line 🔵611 Support🟢512
₹575–586 is the breakout threshold. Above the pivot and away ⇗
Post-break, next projection target : ₹900 (≈+60%), followed by ₹1,300. (Text Book)
📊 Fundamental Alignment
🔋 EV Battery Anode Narrative: Global lithium/graphite demand surging → Graphite India well-positioned as key electrode supplier.
🌍 China Supply Risks = India graphite players gain global relevance.
💼 FIIs Inflow: Recent uptick (+1.7%) hints at sectoral re-rating in anticipation of capex cycles and commodity upturn.
📉 Valuation Context: After steep de-rating post-2018, current price offers favorable risk-reward compared to earnings expectations and sector re-alignment.
► Graphite electrodes are the main heating element used in an electric arc furnace
extremely high levels of heat generated in EAF.
Graphite electrodes are divided into 4 Types: RP Graphite electrodes, HP Graphite electrodes, SHP Graphite electrodes, UHP Graphite electrodes.
► Needle coke👀 is a key ingredient in the production of graphite electrodes for electric arc furnaces (EAFs) in the steel industry.
🧰 Strategic Outlook
►we'll follow this trade closely and within incoming week we'll up a close up view of 4h TF
Bias: Strongly Bullish on breakout; Neutral if it stalls below ₹550.
Targets: ₹900 (swing), ₹1,300 (positional)
ideal for swing/long-term portfolio adds
Alternate Case: Breakdown below🔻₹480 negates pattern; re-evaluate around ₹400 for demand re-entry.
Always DYOR
See you on the other side
💡 Reflective Close:
“What if true breakouts don’t come from hype — but from time, patience, and the quiet work of smart money preparing long before headlines catch up? Are you watching the price, or are you watching the behavior behind the price?”
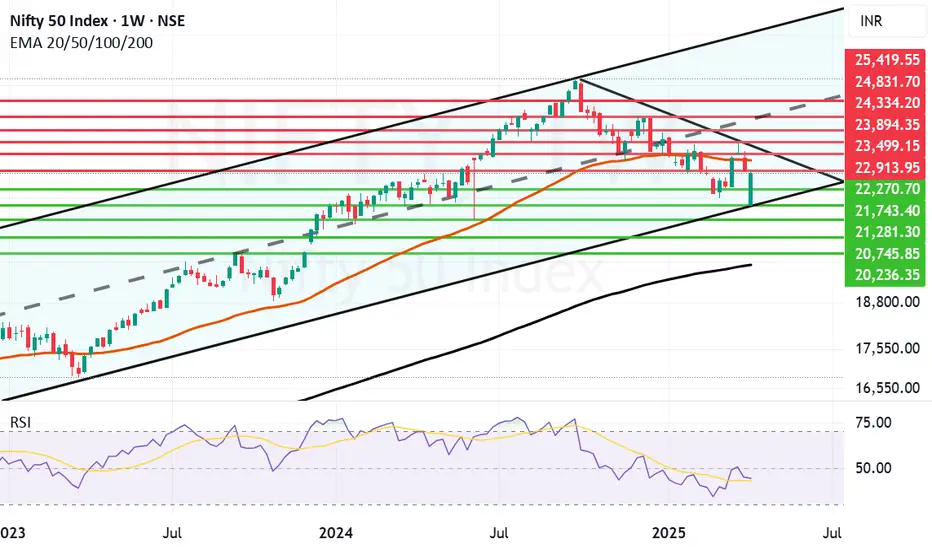
Recovery by Nifty, Resistance zone ahead. (Economic commentary)Nifty has given a strong closing amidst global uncertainty. The uncertainty and heavy volatility will remain in the market so traders are requested to be very cautious especially with regards to Futures and Options. Any positive news can trigger a huge upside at the same time any negative news can trigger a huge downside as well.
India is silently staying neutral and trying to chart it's own deal should be seen as a positive view for long term investors. The focus of Indian investors should remain on companies which procure local raw material and supply it locally these will be the safest bets. MET has predicted a normal Monsoon for India with 103% rainfall which can another shot in the arm for Local markets. FMCG, Specialty Chemicals and Fertilizers, Banks and Financial services should be the sectors to focus.
Along with these sectors commodities and Consumption and can also be the theme as these are dark horses which can benefit from volatility. As Crude is sliding down the companies related to energy and those which are dependent on Oil & Gas, Energy for power and raw material can also benefit. The choice of the stocks should be smart at this juncture to reap rewards.
Long term investors should use this opportunity to invest in Blue chips and High Dividend Yield PSUs and other companies if they are sitting on cash. If not you can use these times to reshuffle your portfolios and align them as per the changing needs of the time. Neutral stance from India can even benefit it by getting FDI (Foreign Direct Investment) if Indian Governments plays it's cards smartly. Too much fog, mist and clouds around on global economy currently for investors to get a clear vision of sunrise sectors. Geo-political uncertainties are also blinding and making the objects in front of us look fuzzy. Investors need to keep patience, avoid speculation and let the dust settle. Even after reconsideration of changing global scenarios Indian GDP will still clock 6%+ so do not have much to worry in the long term. This volatility too shall pass and horizon will definitely be visible in the near future.
To know about how to select good companies to invest in read my book THE HAPPY CANDLES WAY TO WEALTH CREATION. It will help you in making solid triumphant decisions during these uncertain times. It teaches you Behavioural Finance, Fundamental Analysis, Technical Analysis, Profit Booking and many such important topics. The book is one of the highest rated in it's category. The book is available in Amazon in Paperback and Kindle version. You can also contact me directly for getting the same.
Nifty supports remain at: 22270, 21743 (Channel Bottom Support), 21281 (52 week Low support), 20745 and 20236. Below 20236 weekly closing the bears can try to Bring Nifty down to 200 Weeks EMA or the FATHER LINE which is at 19893.
Nifty Resistances remain at: 22913, 23249 MOTHER LINE which will be a (Major resistance), 23499 (Strong Trend line resistance), Above 23499 Bulls can become more active and try to Pull Nifty upwards towards 23894, 24334, 24831 and 25419. After we get a monthly closing above 25419 we can think of regaining 26K levels.
Short Term Outlook : Brace for massive volatility.
Medium Term Outlook: Range Bound Nifty.
Long Term Outlook: Still Very Strong.
Disclaimer: The above information is provided for educational purpose, analysis and paper trading only. Please don't treat this as a buy or sell recommendation for the stock or index. The Techno-Funda analysis is based on data that is more than 3 months old. Supports and Resistances are determined by historic past peaks and Valley in the chart. Many other indicators and patterns like EMA, RSI, MACD, Volumes, Fibonacci, parallel channel etc. use historic data which is 3 months or older cyclical points. There is no guarantee they will work in future as markets are highly volatile and swings in prices are also due to macro and micro factors based on actions taken by the company as well as region and global events. Equity investment is subject to risks. I or my clients or family members might have positions in the stocks that we mention in our educational posts. We will not be responsible for any Profit or loss that may occur due to any financial decision taken based on any data provided in this message. Do consult your investment advisor before taking any financial decisions. Stop losses should be an important part of any investment in equity.
India, USA, China - Government Debt to GDP PerformanceIndia’s Fiscal Discipline Stands Out in a High-Debt Global Economy
Government Debt to GDP Performance Over the Last 20 Years:
China: +217%
USA: +99%
India: +3%
Over the last 2 decades, global economies have increasingly relied on debt to stimulate growth and manage crises.
However, a closer look at long-term Debt-to-GDP trends reveals a stark contrast in fiscal discipline among major economies:
-----------------------------------------------------------------------
India: A Beacon of Fiscal Stability
India has maintained remarkable fiscal discipline, with government debt increasing by just +3% relative to its GDP over the past 20 years.
This demonstrates India’s conservative borrowing strategy, especially notable given the country’s ambitious development goals, infrastructure push, and welfare programs.
This level of restraint positions India well in the face of rising global interest rates and inflation risks.
-----------------------------------------------------------------------
USA: Steady Climb Amid Stimulus Spending
The United States has seen a +99% increase in its debt-to-GDP ratio over the same period, driven by successive rounds of stimulus, defense spending, and entitlement obligations.
While the U.S. enjoys the unique advantage of issuing the world’s reserve currency, the long-term implications of rising debt—especially as interest payments rise—pose potential challenges to fiscal sustainability.
-----------------------------------------------------------------------
China: Debt-Fueled Expansion
China’s debt-to-GDP has surged +217% over the past two decades, reflecting its aggressive infrastructure-led growth model and significant off-balance-sheet local government borrowing.
While this has powered China's rapid urbanization and industrial growth, the mounting debt burden raises questions about long-term efficiency, default risks in the shadow banking sector, and the need for deleveraging.
-----------------------------------------------------------------------
🔍 Key Insights:
1) India’s 3% debt growth over 20 years highlights an underleveraged economy, offering headroom for targeted fiscal expansion if needed.
2) In a world where debt sustainability is becoming a key investment theme, India stands out as a relatively safer macro environment.
3) This fiscal prudence complements India’s improving trade metrics and strengthens its position in global economic leadership.
-----------------------------------------------------------------------
📈 Conclusion:
As the global economy grapples with inflation, rising interest rates, and debt concerns, India’s modest rise in government debt is a key macro strength.
While China and the USA have seen significant increases in their debt burdens, India’s fiscal balance provides confidence to both investors and policymakers for future growth cycles.
This makes India an attractive long-term investment destination in a world of rising uncertainty.

India, USA, China - Trade Deficit Performance after Covid PhaseIndia’s Trade Deficit Nearing a Turning Point – Strong Growth Amid Global Shifts
Trade Deficit Performance Over the Last 5 Years:
India: -10%
USA: -215%
China: +359%
Over the past five years, global trade dynamics have shifted significantly, with India showing promising signs of a turnaround in its trade performance.
India: A Rounding Bottom Pattern?
India’s trade deficit has improved by -10% over the last five years, hinting at a potential rounding bottom pattern that could transition into a trade surplus in the coming years.
This positive shift comes despite global economic headwinds, positioning India as a resilient and emerging export player.
USA: Longer Road to Recovery
In contrast, the United States has seen its trade deficit worsen by -215%, suggesting a deeper structural challenge in its trade balance.
While the U.S. economy remains strong in other metrics, its export-import imbalance will likely take more time and policy adjustments to stabilize.
China: The Export Powerhouse slowdown after Tariffs sanctions ?
China continues to dominate with a staggering +359% improvement in its trade surplus over the past five years, solidifying its position as the world’s top exporter.
However, rising global tariffs and geopolitical tensions could gradually redirect supply chains.
🌏 Macro Implications:
Tariff Realignment: As global companies look to diversify away from China amid escalating tariffs and political tensions, India is emerging as a key beneficiary.
This realignment could significantly bolster India’s export sector.
India’s Growth Story: With structural reforms, expanding manufacturing capabilities, and supportive government policies like PLI (Production-Linked Incentives), India is well-positioned to capture a larger share of global trade flows.
Global Slowdown, Local Resilience: Despite a global economic slowdown, India’s improving trade dynamics signal strong internal momentum and a maturing economy.
📈 Conclusion:
India is on the cusp of a major trade shift.
While China remains the global leader in exports and the USA faces growing imbalances, India’s improving trade performance, geopolitical advantage, and manufacturing push make it a compelling long-term trade and investment story.
Amid Tariffs war and global economy slowdown, India's growth story continues...

India's Nifty 50: A Rising Star in a Geopolitical StormIn 2023, the Indian stock market, represented by the Nifty 50 index, has emerged as a standout performer. Outpacing its U.S. counterpart, the S&P 500, by a significant margin, the Nifty 50 has captured the attention of global investors. Several factors converge to explain this impressive performance, with geopolitical tensions playing a pivotal role.
The Great Manufacturing Shift: India as a Prime Beneficiary
One of the most compelling narratives driving India's economic ascent is the global shift in manufacturing. As the world grapples with heightened geopolitical risks, particularly the escalating tensions between the United States and China, businesses are seeking to diversify their supply chains. India, with its vast market, skilled workforce, and government's "Make in India" initiative, has emerged as a compelling alternative to China for many multinational corporations.
Diversification of Supply Chains: Companies like Apple and Google are actively exploring manufacturing operations in India to reduce their reliance on China. This trend extends to various sectors, including pharmaceuticals, automobiles, and textiles.
Government Support: India's government has proactively created a conducive business environment through infrastructure development, tax incentives, and ease of doing business reforms. These efforts have boosted investor confidence and accelerated the country's industrialization process.
India's Economic Characteristics and Domestic Consumption
India's strong domestic consumption and the rise in manufacturing are major factors in the country's economic expansion. The demand for goods and services is increasing due to the growing middle class and increased disposable incomes. The approach of consumption-led growth enhances the resilience of the Indian economy by acting as a buffer against external shocks.
India's economy boasts several key characteristics:
Rapid Growth: India has consistently been one of the fastest-growing major economies globally.
Large Domestic Market: With a population of over 1.4 billion, India offers a vast consumer base, driving domestic consumption.
Young Population: A large and young workforce provides a demographic dividend, fueling economic potential.
IT and Services Dominance: The IT and services sector is a major contributor to India's GDP, with companies excelling in software development, outsourcing, and business process management.
Agricultural Importance: Agriculture remains a crucial sector, employing a significant portion of the population, although its contribution to GDP is declining.
Challenges and Opportunities
While India's economic trajectory is promising, it faces challenges such as:
Infrastructure Gaps: Improving infrastructure, including transportation, energy, and digital connectivity, is essential for sustained growth.
Poverty and Inequality: Addressing poverty and reducing income inequality remains a priority.
Education and Skill Development: Investing in education and skill development is crucial to enhancing human capital.
Environmental Concerns: One of the main challenges is balancing environmental sustainability with economic growth.
Despite these challenges, India offers immense opportunities for businesses and investors:
Large Consumer Market: The growing middle class presents a lucrative market for consumer goods and services.
Favorable Government Policies: The government's focus on economic reforms and ease of doing business creates a conducive environment for investment.
Digital Transformation: India's rapid adoption of digital technologies presents opportunities in e-commerce, fintech, and digital payments.
The Road Ahead
While the Nifty 50's performance has been impressive, challenges remain. Inflationary pressures, global economic uncertainties, and the potential impact of a prolonged geopolitical standoff could pose risks. However, India's demographic dividend, its digital transformation, and its focus on renewable energy offer promising avenues for long-term growth. Continued focus on infrastructure, education, and skill development will be crucial for realizing its full potential.
In today's complex geopolitical environment, India seems well-placed to take advantage of the opportunities arising from global supply chain disruptions. The performance of the Nifty 50 index reflects India's increasing economic influence and its potential to emerge as a global manufacturing and consumption hub.

Nifty Long Term Analysis, Observations and Conclusion. Nifty Long Term Outlook: (Little Long message but must read analysis for all connected to stock market).
Nifty seems to be moving pretty solidly since 2019 in the long term channel shown in the chart. We have also intersected the chart with fibonacci supports and resistances for the Nifty. The candlesticks used are monthly. The Channel starts from Mid 2019 and extends upto 2026. Top considered for Fibonacci retracement is the pre-covid high and bottom is Covid low. This comprehensive chart gives us various scenarios to study. The same are depicted as under:
a) Nifty is trying to sustain above the mid channel resistance. If the same can be sustained most part of 2024 will be engulfed by the bull run, barring some significantly negative macro or micro event.
b) Considering there is a political stability in the country at least for next 2 to 3 years the best case scenario for Nifty in couple of years time seems to be near 30K+ and worst case scenario seems to be near 24K+.
c) Next long term Fibonacci resistances seem to be near 22268 and 24305 respectively.
d) Fibonacci supports for Nifty seem to be near 20389 and 18687.
e) 50 months EMA for Nifty right now is at 16468 this should be a major support (Mostly Nifty can go there only if there is some global catastrophe or some unlikely event like party expected to win Lok Sabha 2024 loses hands down etc.
Observations:
1) Mid and Small cap have been relatively doing well in recent past coming 2 years can be good for Large cap stocks.
2) It seems that there will be overall growth but secots like Pharma/Healthcare, Infrastructure, FMCG, Capital Goods, Banking and Financials might fare better than IT and Defense have had a long run and might relax a bit for a while.
3) New themes like Clean Energy, Aero-space some other breakthrough technology can disrupt the market space completely.
4) India with it's assertive foreign policy can create and consolidate it's place in global manufacturing.
5) Over all situation seems to be investor friendly. India is in the sweet spot of Global economy. History says that 2 to 5 Trillion USD journey for any of the global economy has had potential to unleash wealth creation for the investors.
Conclusion: We feel those who can lean Techno-Funda Investing / Know Techno-Funda investing will benefit the most during this wealth creation phase.
Question: So how many of you want to learn Techno-funda Analysis and become Aatmanirbhar?
