ShreeRenuka, BUYPossible Reversal. Please follow levels and directions provided on CHART. Please calculate risk/reward before initiating a trade.
Indianstocks

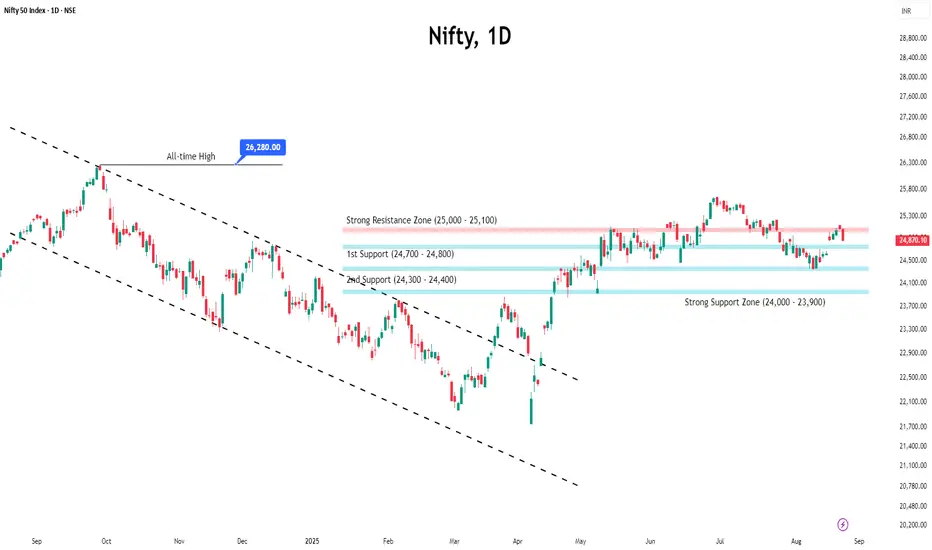
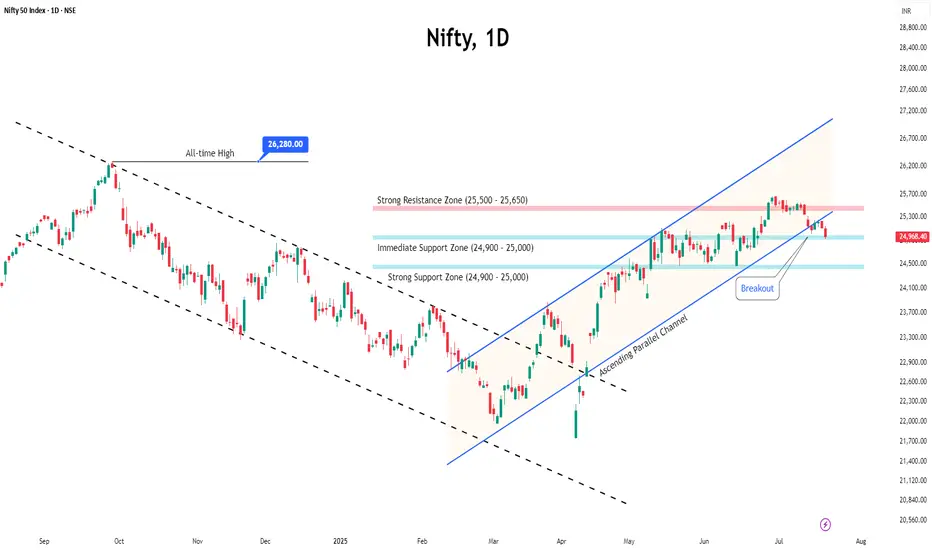
Nifty Ends August in Pain: Can September Spark a Turnaround?Nifty slipped nearly 1.8% in the last week of August as global headwinds and US-India tariff concerns weighed on sentiment.
Selling was broad-based, with Banking and Financials dragging the index down the most.
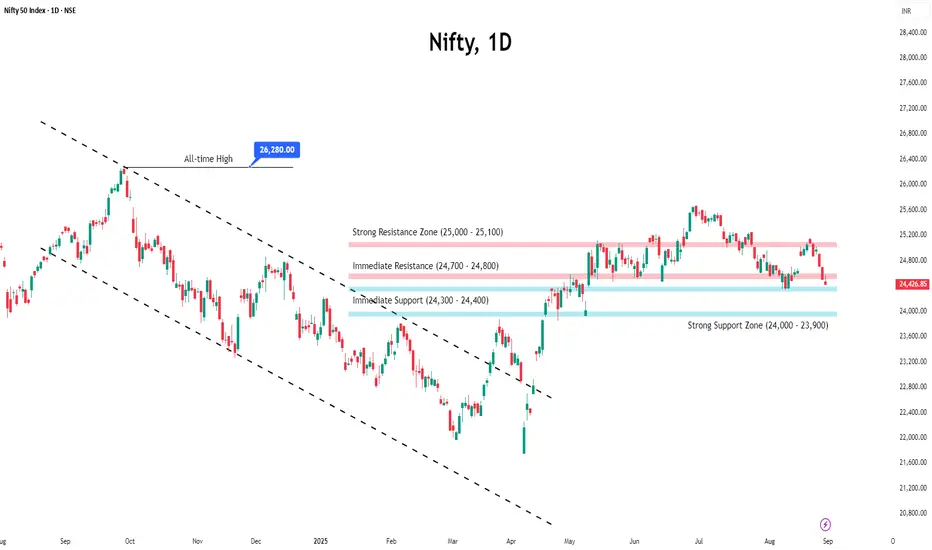
The index currently trades just above 24,400, a crucial support level. Open interest data indicates that the 24,400–24,300 zone may provide short-term support, while the 25,500–25,600 zone remains significant resistance due to heavy call writing. A decisive break below 24,300 could quickly push the index toward 24,000.
Amid the weakness, a silver lining emerges — India’s strong 7.8% GDP growth, the highest in five quarters and well above expectations, may help cushion further downside.
Looking ahead, Monday’s open will set the tone for September—a gap-up above 25,500 could spark a rebound, while staying below may keep Nifty under pressure.
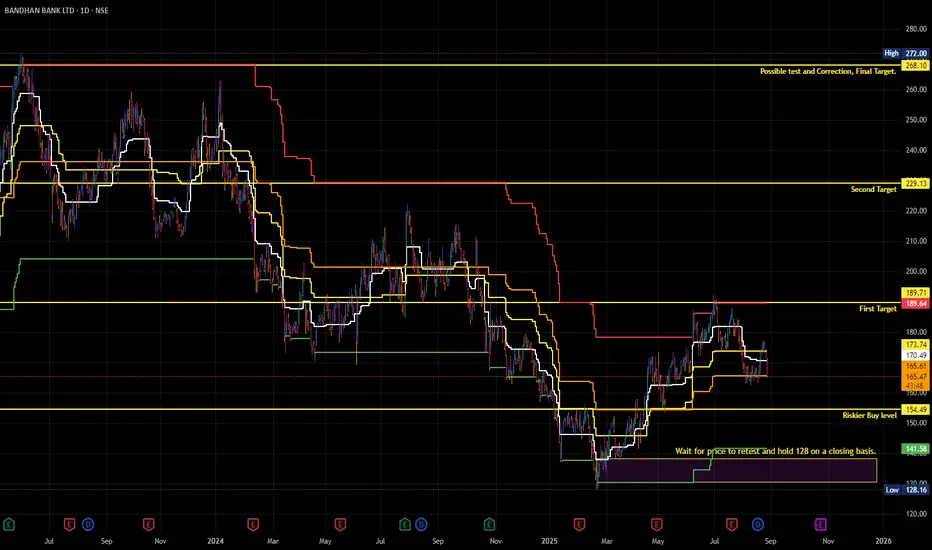
Bandhan BankExtended Correction and possible bottom formation. Stock could reverse.
Please follow the levels mentioned on the chart.
Please calculate risk before considering this suggestion.
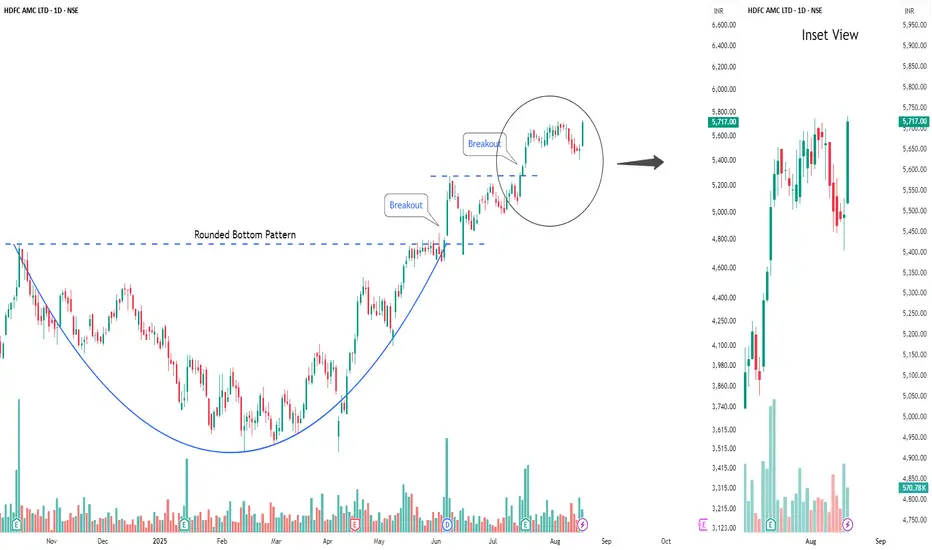
Buy HDFC AMCShort Term Trading Advice by Goodluck Capital
Buy HDFC AMC
● Buy Range- 5600 - 5700
● Target- 5900 - 6000
● StopLoss- below 5380
● Upside Potential- 4% -5%
● Approx trade duration 14 - 15 days
Nifty Hits Resistance; Volatility Looms Ahead of Monthly ExpiryReason Behind the Fall
The Indian market snapped its six-session winning streak on Friday as investors turned cautious ahead of US Federal Reserve Chair Jerome Powell’s speech at the Jackson Hole symposium.
Concerns over the upcoming 25% US tariffs, set to take effect on August 27, further added to market volatility.
Importantly, Powell signalled in his remarks on Friday that the Federal Reserve is likely to cut interest rates in September.
Technical Setup
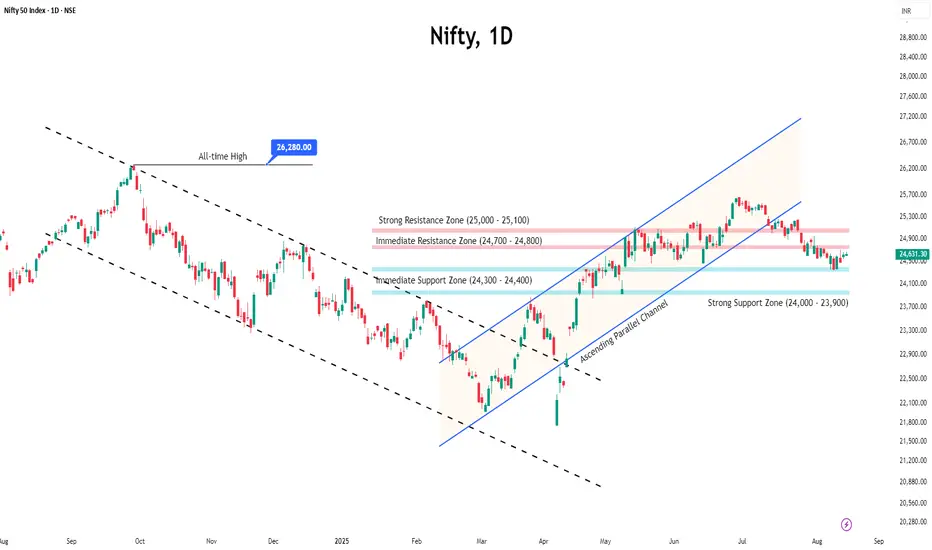
The Nifty faced rejection from the key resistance zone of 25,000–25,100, which may trigger further downside towards 24,500–24,400.
OI Data Analysis
Open interest data shows significant call writing at 25,000, reinforcing it as a strong resistance for the upcoming monthly expiry.
On the downside, 24,800 is emerging as immediate support with notable put writing. If this level fails to hold, the next support is likely near 24,500.
Suggested Strategy
With the additional tariff deadline approaching alongside monthly expiry, heightened volatility is expected.
Traders are advised to stay cautious and adopt a wait-and-watch approach until the index provides clear directional cues.
AARTIIND- Very High RiskPlease follow levels provided on chart.
Please calculate possible losses before entering any suggestion.

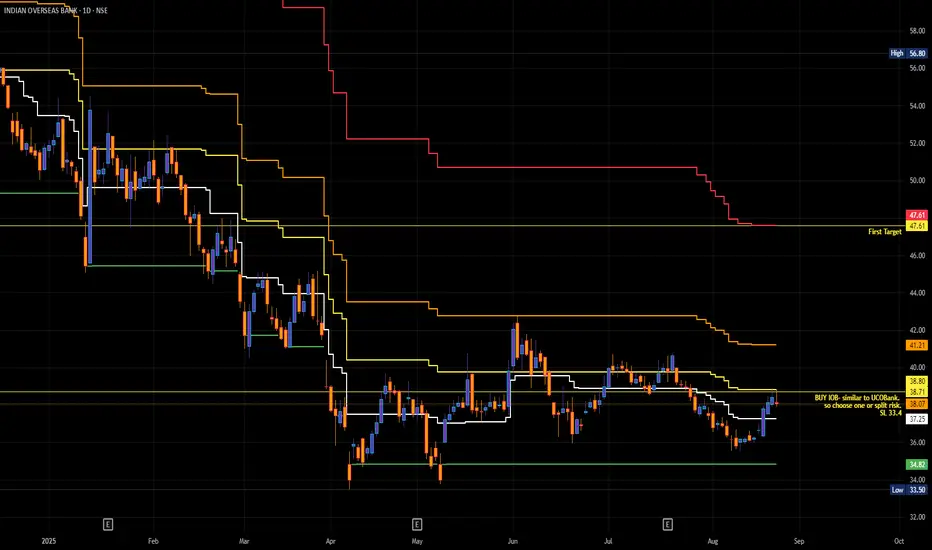
IOBVery similar pattern to UCO Bank.
Please chose either to limit risk or distribute risk across both.
please stick to levels provided on chart.
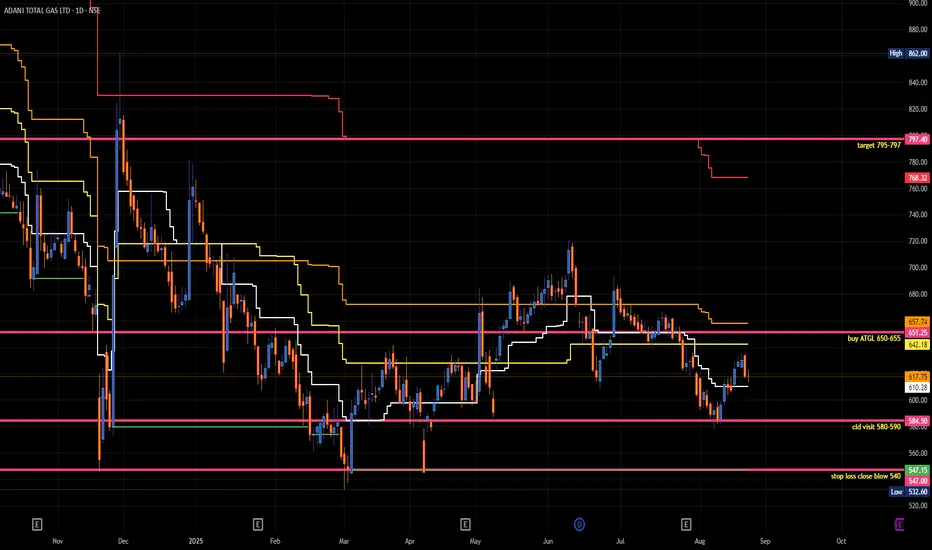
ATGL-VERY HIGH RISKA highly volatile script from a group that spikes and falls with alarming speed. Please strictly understand the risk and loss of capital this suggestion entails before trying it out.
Please adhere to the levels mentioned on the chart.
UCOBANKThis is a risky trade as the pattern is still in the formation stage. Hence the buy and SL are quite close. Please be aware of this before you plan to follow this suggestion.
Please follow the levels on the chart.

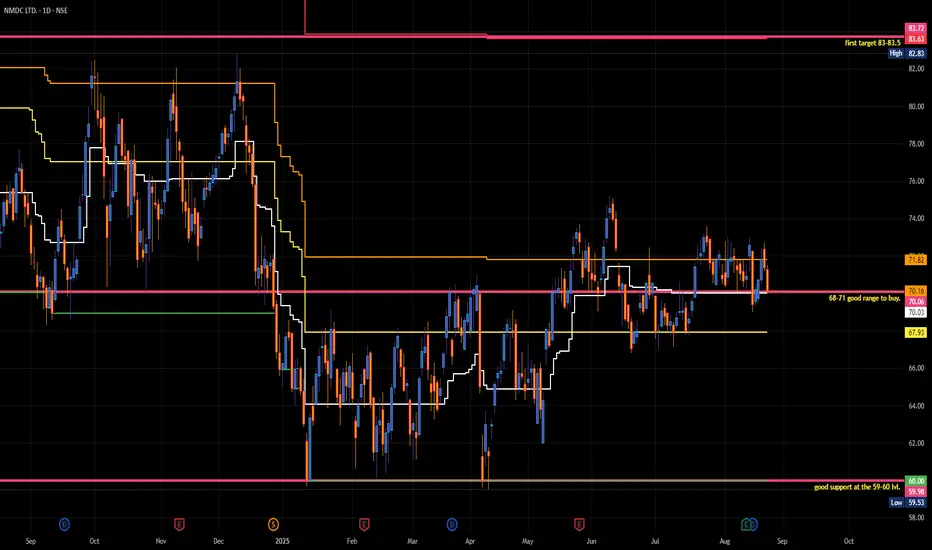
NMDCNMDC looks set to scale for a possible break... It has created a decent support around the 58-60 mark, however fresh downside could open if that gives so this idea would be negated below that level on a closing basis.
Please follow the levels mentioned in the chart.
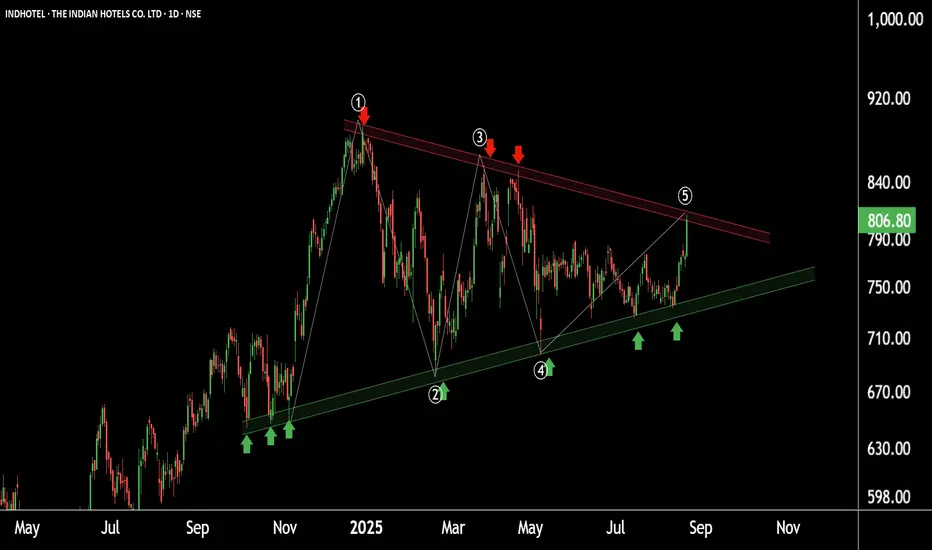
Indian Hotels: Pattern Discovery Signals Potential RallyIndian Hotels is currently forming a Symmetrical Triangle Pattern with:
Support: near ₹730
Resistance Zone: ₹800–810
As the wave structure is now complete, a breakout from this pattern is highly possible.
📈 If the breakout occurs, we may witness new highs in the stock.
THANK YOU !!
TATA MOTORS VALUATION ANALYSIS
🌺Conclusion🌺
Fair value: ₹1,370/share (DCF, FCFF).
Upside vs ~₹676: ~+100%.
Why: 12% growth, margin normalization to 13%, capex glide to 6%, revenue‑weighted global ERP yielding WACC ~11.1%, terminal growth 4.3%.
💁🏻DCF (FCFF) Highlights🌸
Framework: 5-year FCFF + Gordon terminal.
FCFF ramp (₹Cr): 6,541; 20,072; 34,252; 38,362; 42,965.
Assumptions: EBITDA 11.5%→13.0%; D&A ~5.3% of revenue; capex 9.0%→7.5%→6.0%; ΔWC base 0; tax ~18.9%.
Bridge: PV(FCFF) ~₹0.96–0.98L Cr; PV(Terminal) ~₹4.05–4.15L Cr; EV ~₹5.01–5.13L Cr; less net auto debt ₹13,500Cr; equity ~₹4.88–4.99L Cr; per share ₹1,360–₹1,380.
🧐Other Valuation Lenses 🌸
JLR: EV/Sales ~0.7–0.9x or EV/EBITDA on normalized 10–12% margins (discount to luxury peers).
India CV: EV/EBITDA ~6.0–7.5x mid‑cycle.
India PV/EV: EV/EBITDA ~10–12x normalized; use EV/Sales when EBIT soft.
🤔Scenarios (Per‑Share)🤔
Best (EBITDA 13.5–14.0%, capex faster to 6%): ₹1,520–₹1,620.
Base (EBITDA 13.0%): ₹1,360–₹1,380 (headline ₹1,370).
Worst (EBITDA 10.0–11.5%, capex slower to 7%): ₹1,180–₹1,280.
⭐Key Drivers⭐
JLR premium mix (Range Rover/Defender), tariff/FX normalization, China retail.
India PV discounting vs ASP/mix; EV unit economics scale-up.
CV cycle durability; pricing discipline.
Capex cadence and working capital behavior driving cash conversion.
✨Key Numbers✨
WACC ~11.1% (revenue‑weighted ERP, β≈1.30).
Terminal growth 4.3%.
Shares ~3.68B; net automotive debt ₹13,500Cr.
:it's not buy/sell recommendation this report is for info

Nifty Rebounds After Six-Week Fall, Consolidation Continues● Nifty finally ended its six-week losing run, closing the week with a 1.10% gain despite trading in a narrow range.
● Volatility inched higher, with India VIX rising 2.68% to 12.35, reflecting a slightly elevated risk perception, though it remains comfortably low.
● On the technical front, the 24,300–24,400 zone is likely to act as immediate support, while resistance is seen at 24,700–24,800.
● Heading into nest expiry, the index is expected to remain in a neutral phase as it continues to consolidate below key resistance levels. Without a decisive breakout, aggressive buying should be avoided.
● Traders are advised to closely monitor price action around these key levels and manage risk carefully while planning trades.
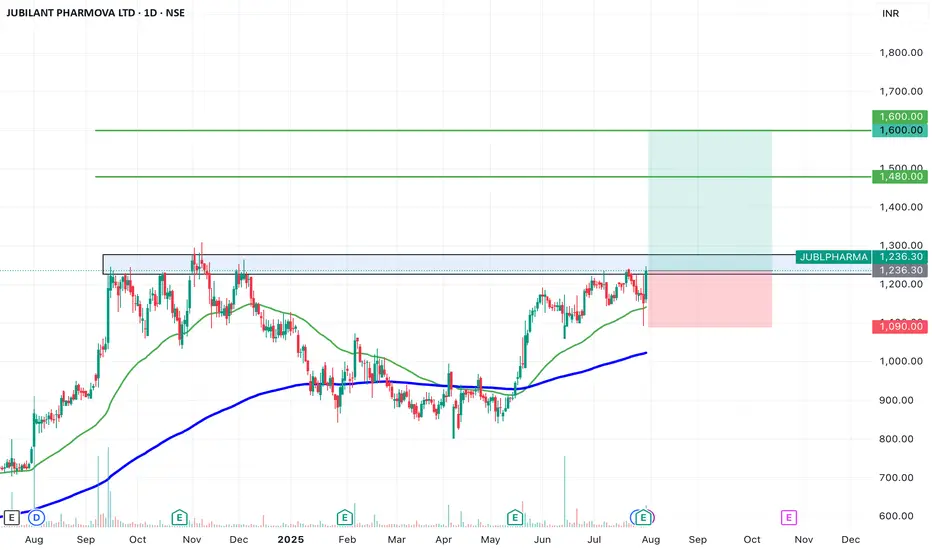
SWING IDEA - JUBILANT PHARMOVAJubilant Pharmova , a diversified pharmaceutical company focused on CRAMS and specialty pharma, is presenting a strong swing opportunity backed by a major pattern breakout and volume confirmation.
Reasons are listed below :
Breakout from an Inverted Head & Shoulders pattern after over a year of consolidation
Attempting breakout above 1250, a key resistance zone with multiple rejections in the past
Strong marubozu candle on the daily chart with a notable volume spike, signaling conviction
Trading near all-time highs, and comfortably above key EMAs, reinforcing trend strength
Target : 1480 // 1600
Stoploss : weekly close below 1090
DISCLAIMER -
Decisions to buy, sell, hold or trade in securities, commodities and other investments involve risk and are best made based on the advice of qualified financial professionals. Any trading in securities or other investments involves a risk of substantial losses. The practice of "Day Trading" involves particularly high risks and can cause you to lose substantial sums of money. Before undertaking any trading program, you should consult a qualified financial professional. Please consider carefully whether such trading is suitable for you in light of your financial condition and ability to bear financial risks. Under no circumstances shall we be liable for any loss or damage you or anyone else incurs as a result of any trading or investment activity that you or anyone else engages in based on any information or material you receive through TradingView or our services.
@visionary.growth.insights
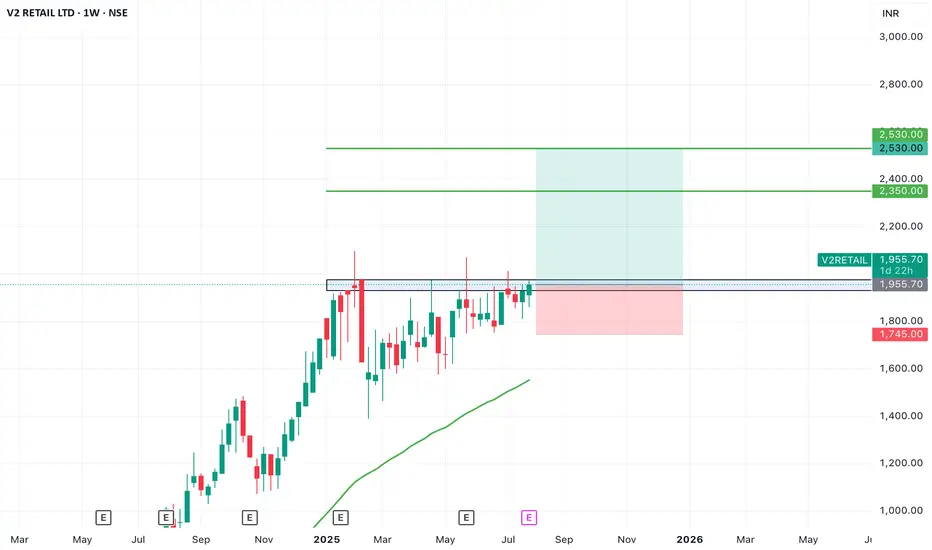
SWING IDEA - V2 RETAILV2 Retail , a small-cap value fashion retailer with a pan-India presence, is showing strong bullish momentum and a textbook swing trade setup backed by multiple breakout signals.
Reasons are listed below :
Breakout from a VCP (Volatility Contraction Pattern) – indicating accumulation and strength
Ascending triangle breakout – classic continuation pattern
Cleared major resistance zone, confirming bullish intent
Maintains a clear uptrend with higher highs and higher lows
Target - 2350 // 2530
Stoploss - weekly close below 1745
DISCLAIMER -
Decisions to buy, sell, hold or trade in securities, commodities and other investments involve risk and are best made based on the advice of qualified financial professionals. Any trading in securities or other investments involves a risk of substantial losses. The practice of "Day Trading" involves particularly high risks and can cause you to lose substantial sums of money. Before undertaking any trading program, you should consult a qualified financial professional. Please consider carefully whether such trading is suitable for you in light of your financial condition and ability to bear financial risks. Under no circumstances shall we be liable for any loss or damage you or anyone else incurs as a result of any trading or investment activity that you or anyone else engages in based on any information or material you receive through TradingView or our services.
@visionary.growth.insights
NIFTY 50 – 1D TF: Expanding Triangle DynamicsInside the triangle we saw a triangle again
Pattern: Classic Broadening wedge —higher highs & lower lows = volatility + indecision
Microstructure: Within the Triangle, a smaller broadening wedge formed, signaling coiling price before potential range expansion.
Sideways & expanding = distribution or re-accumulation phase. (For 1D TF Macro Triangle outlook scroll ↧)
Markers:
🥵Resistance
🥶Pivot
🤢Support
💪🏼⚠️Key levels
💥 Order block from Supply Line breakdown
🪂 Our main Man
❓U-🔻Turn Fake Out, lets see how it goes!
🚀 Let me know your views
Technical Insight
Broadening wedge 📐:
Often signals high emotional volatility— smart money accumulates in the chaos while retail gets whipsawed. Market is struggling to agree on fair value — hence breakout/breakdown traps are common.
Progressively a rejection from the supply💥 line zone could result in a lower high, leading to sharp retracement toward 24,000 or lower → our main man 🪂
Liquidity Grab Setup:
If NIFTY dips near 🪂 23,844 and forms a V-reversal, it could be a liquidity spring towards 25,350 🚀
🚫 Critical Checks to Avoid False Breakouts
Watch out 🪂💥❓
Liquidity Trap: Ignore breakouts with volume < 1.5x avg.
Expiry Week: Reduce position size (PCR/OI noise increases).
VIX Filter: No shorts if VIX < 15 (low volatility traps).
📊 Fundamental Alignment
Macro Tailwinds:
Q2 GDP prints strong: India remains among the fastest-growing economies.
FIIs have returned in phases post-June; DII participation remains robust.
Inflation cooling (CPI near 5%) + expectation of status quo on rates by RBI = positive for equities.
💹Risk Catalysts
Global volatility from US yields, Fed guidance, and oil prices could influence near-term moves.
Upcoming domestic events (elections, fiscal data, monsoon trend) may impact sentiment around key supply zones.
🛠️ Strategic Outlook
Validated (Bullish Continuation)
Setup: Bounce off 24,178 → breakout above 25,118 → reclaim 25,565
Bias: Bullish breakout
Trigger: Daily close above 25,565 with volume
Invalidated (Fakeout then Breakdown)
Setup: Pop above 25,118 → rejection from OB → lower high → flush toward 23,844 and Lower
Bias: Bearish
Trigger: Bearish engulfing near 25,350
Always DYOR,
See you on the other side
💡 Reflective Close:
In expanding structures, the real edge isn’t prediction — it’s patience.
Are you managing risk through structure or emotion through bias?

Nifty Extends Losing Streak: Is a Dead Cat Bounce Coming?The Nifty 50 dropped for the fifth week in a row, losing around 1.5%. Sectors like banks, IT, and consumer stocks are under pressure, and there are no big positive news to lift the market right now.
◉ Why is the Market Falling?
● Poor Q1 Results
Many big companies, especially in banking and IT, reported weaker-than-expected earnings. This disappointed investors and led to selling.
● U.S.–India Trade Trouble
The U.S. has added a 25% tax on Indian exports starting August 1. The two countries couldn’t agree on some trade issues, especially related to agriculture and dairy. This is bad news for export-focused companies.
● Weak Rupee
The rupee is near record lows against the U.S. dollar. This is because foreign investors are pulling money out of India. A weak rupee hurts sectors like IT and pharma, which earn in dollars.
◉ What the Charts Say?
The market has had a tough 5 weeks, but now it’s near a strong support level. This means a short-term bounce (dead cat bounce) is possible — a small recovery before another fall.
● Support at 24,500
There’s a large number of put option writers at this level. This means many traders are confident that Nifty won’t fall below 24,500 — so they’re willing to take that risk. This builds a strong support zone.
● Resistance at 24,700–24,800
There’s heavy call writing in this range. That means traders are betting Nifty won’t go above these levels. As a result, this area acts like a short-term ceiling or resistance.
Expect the Nifty to stay between these levels coming week unless some major news changes the game.
◉ Suggested Strategy
● For Traders: Stay cautious. Avoid aggressive long positions unless Nifty reclaims 25,000 decisively. Look for shorting opportunities near resistance zones with strict stop losses.
● For Investors: Stick to quality. Defensive pockets like FMCG, utilities, and select pharma may offer stability amid broader volatility.

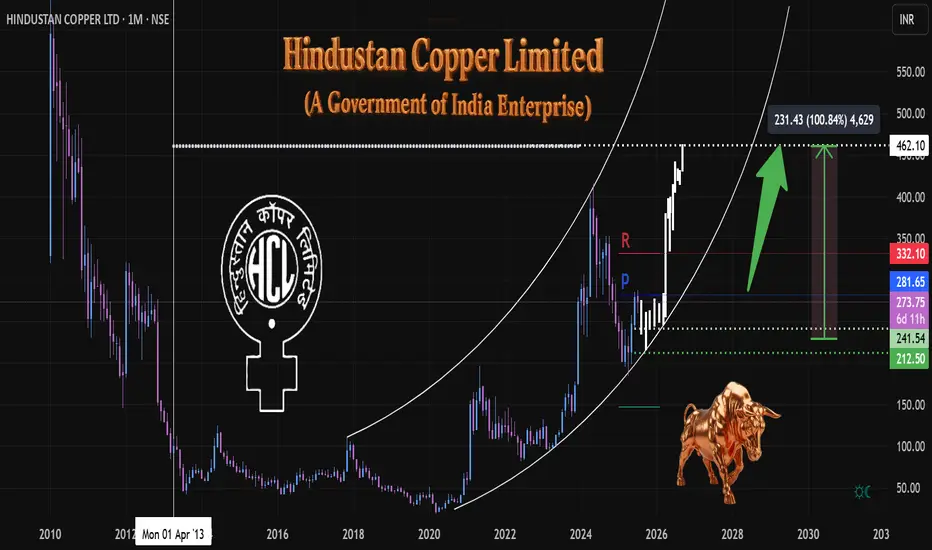
HCL Copper 1M, TF Anticipating Growth & Key Levels ⚙️ Materials: Commodity Cycle Turnaround
(Green energy metals, China recovery)
Government of India Enterprise
Hindustan Copper Limited (HCL)
The company is undergoing a significant mine expansion, projecting a 5x increase in output. This positive development is already reflected in institutional interest, with DIIs increasing their exposure by 8.2% in Q1.
At the time of this analysis, the price stood at 273.
We've observed a volume climax at the bottom, suggesting a potential exhaustion of selling pressure and a base formation.
The white ghost candles pattern illustrate an anticipated future price path, which I project based on current market dynamics and patterns. This projection outlines a potential trajectory we will monitor closely as price develops.
A strong engulfing bullish candle formation above the 281 pivot (🔵) would signal significant bull strength and confirm a strong upward momentum.
A confirmed breakout above the monthly resistance level (🔴) would be a critical bullish signal. initiating further long positions upon a successful retest of this breakout level.
My primary accumulation zone for potential entries is identified in green (🟢 dotted), ranging between 241 and 212. This range represents an area where I anticipate favorable risk-reward for entry.
Target & Time Horizon:
While precise timing is always challenging, I estimate the projected target up to 100% ( above in the white dotted line) could be reached around Q2 2026 or before as markets perform.
Disclaimer:
This analysis represents a personal projection
based on current market observations.
Trade Safely,
Always DYOR
#हिन्दुस्तान कॉपर लिमिटेड
#indianeconomygrowth
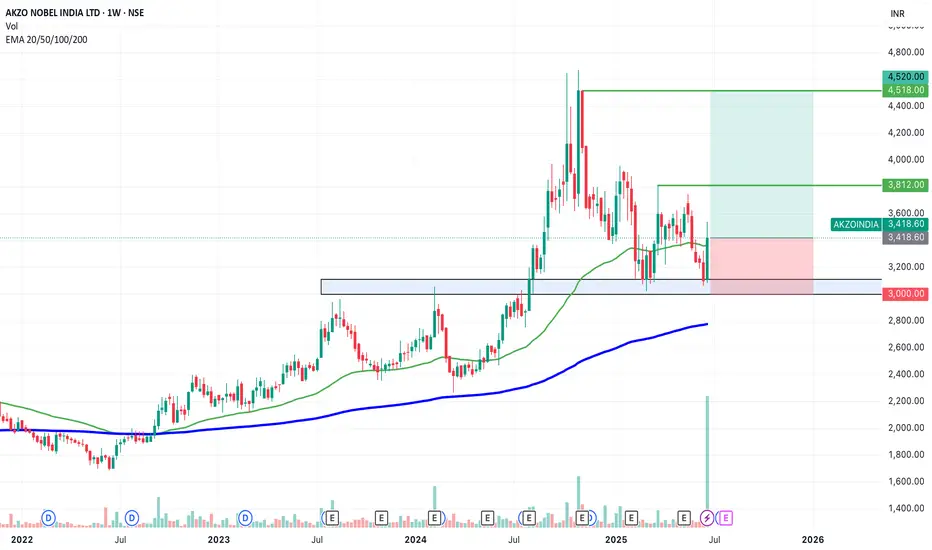
SWING IDEA - AKZO NOBEL INDIA Akzo Nobel India , a subsidiary of the global paints and coatings giant AkzoNobel N.V., is a leading player in India’s decorative and industrial paints market. Known for its premium brand Dulux , the company has strong brand recall, a wide distribution network, and consistent profitability.A strong brand, steady margins, and a bullish chart make this a candidate to watch for a short- to medium-term swing trade.
Reasons are listed below :
Bullish engulfing candle spotted on the weekly timeframe, signaling a potential trend reversal.
Accompanied by the highest-ever volume spike, adding strong conviction to the move.
Price is bouncing off the golden Fibonacci support (0.618), a classic retracement zone where strong reversals often occur.
The level of 3100 acted as a solid support.
The stock is trading above its 50 & 200 EMA on the weekly chart — a sign of long-term strength.
Target - 3812 // 4520
Stoploss - weekly close below 3000
DISCLAIMER -
Decisions to buy, sell, hold or trade in securities, commodities and other investments involve risk and are best made based on the advice of qualified financial professionals. Any trading in securities or other investments involves a risk of substantial losses. The practice of "Day Trading" involves particularly high risks and can cause you to lose substantial sums of money. Before undertaking any trading program, you should consult a qualified financial professional. Please consider carefully whether such trading is suitable for you in light of your financial condition and ability to bear financial risks. Under no circumstances shall we be liable for any loss or damage you or anyone else incurs as a result of any trading or investment activity that you or anyone else engages in based on any information or material you receive through TradingView or our services.
@visionary.growth.insights
Pressure Builds on Nifty Before ExpiryThe Nifty traded in a tight range for most of the week but eventually slipped below the 25,000 mark, ending on a weak note.
With the monthly expiry approaching, the index is likely to remain under pressure, and volatility may pick up in the coming sessions.
Key resistance levels are seen at 25,200 and 25,500. A decisive move above 25,500 could trigger an upside breakout. On the downside, support is expected around 24,500 and 24,400.
Given the current structure, traders are advised to stay cautious, focus on selective opportunities, and avoid aggressive positions until a clearer trend emerges.
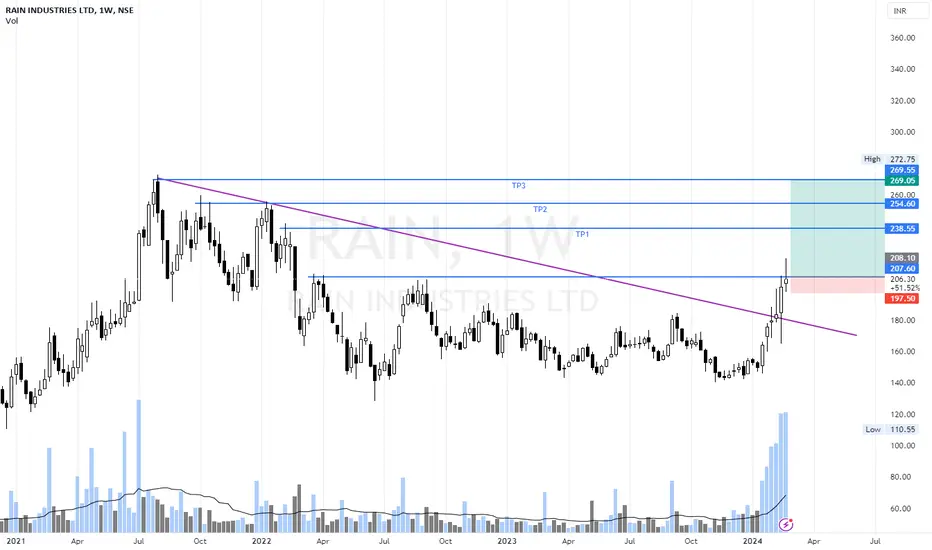
RAIN Industries Swing IdeaRain Industries has given Multiyear breaks out with spike in volume we can expect a good upside movement in the stock.
Nifty Closes Below 25,000 — What Lies Ahead?The Indian market's recent uptrend appears to be losing momentum, as the benchmark Nifty index extended its decline for the third consecutive week, ending just below the important 25,000 mark.
This pullback has been largely driven by weakness in the Financial and IT sectors, with major players like NSE:TCS , NSE:HCLTECH , and NSE:AXISBANK posting disappointing earnings.
From a technical perspective, the index is now approaching a key support zone near 24,900. A decisive break below this level could open the door for a further slide towards 24,500.
Open Interest (OI) data reinforces this view, with the 25,000–24,900 zone seeing the highest put writing, marking it as an immediate support area. On the upside, strong call writing at 25,100 and 25,200 on Friday suggests these levels will act as immediate resistance.
Given the current structure, the outlook for the coming week remains neutral to bearish.
Traders are advised to stay cautious, manage risk effectively, and keep a close watch on these crucial levels.
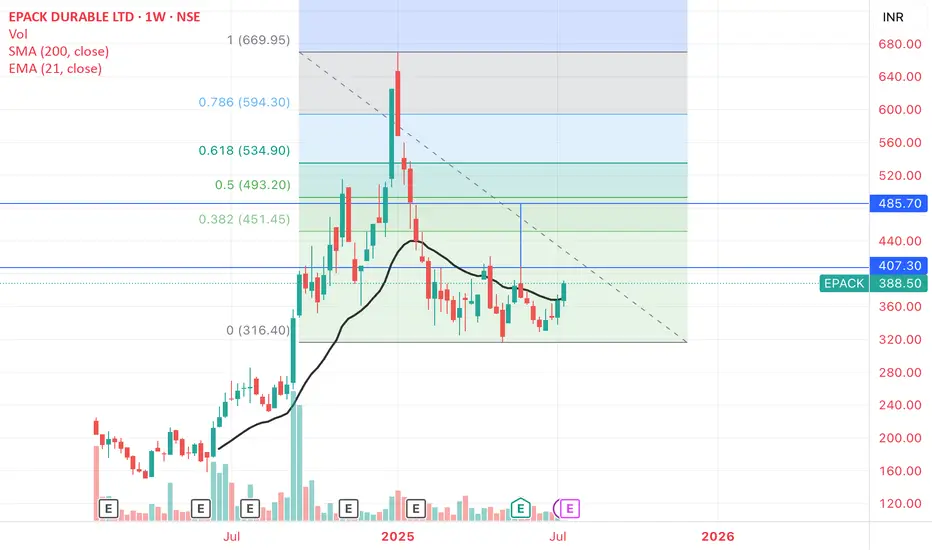
E-PACK_ Potential Double Bottom and TargetsE-PACK DURABLE: Potential Double Bottom with Resistance 407-410 zone.
Weekly close above it - Target 480-490 , that is also the 50% retrace Fib Level of the entire fall from the peak
Weekly close and support held at 407-410 matters