PRAVEG- Potential BULL FLAG on the weeklyA clear breakout on the weekly close will target the ATH for Praveg. Its forming the pattern since it corrected from its high, till the breakout, trade in the range
Indianstocks

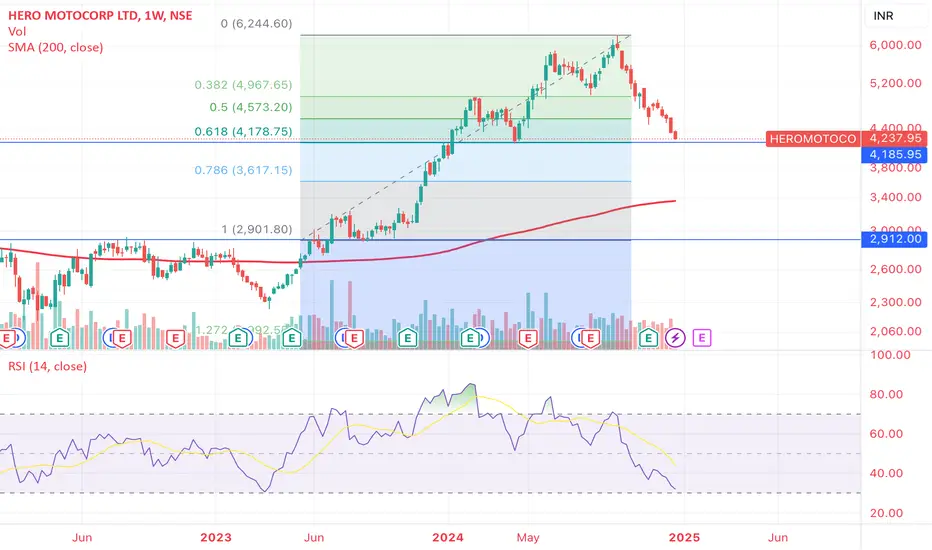
HERO MOTOR- SUPPORT TESTHero Motor broke out of a crucial level at 2900 where multi month resistance was seen. Post that its rise was halted at 6K+ and now its testing a crucial level of support- 0.618 FIB level , break of which can be bad for the stock -mid term. Correction is heavy on this stock, should watch this level carefully over the next 2-3 weeks.
HBL- Trading levelsHBL- range bound, like many stocks. Should be testing the lower end at 560-570 again in a weak market, ideal entry point for a good 15% or more.

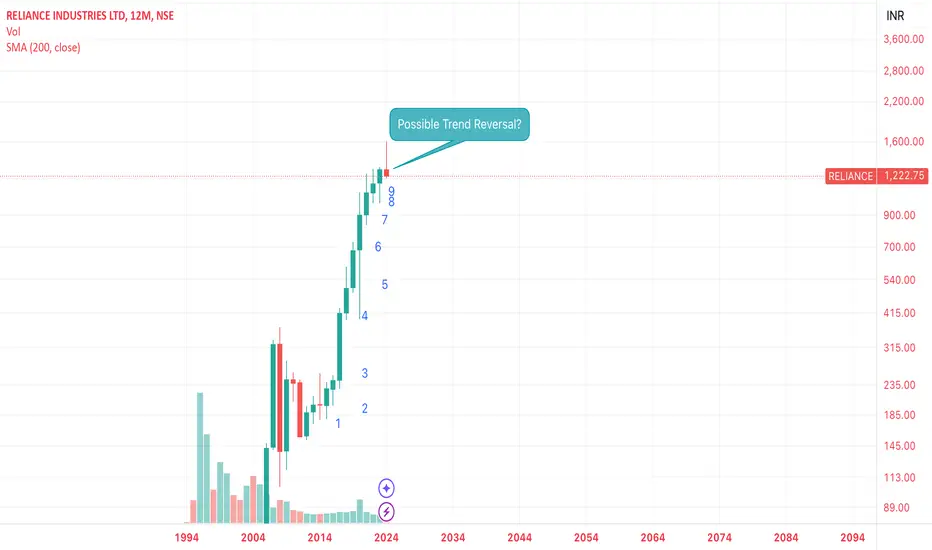
Reliance Industries- YEARLY CHART- A concerning candleAfter 9 years RIL- Reliance is ending the year with -ve gains for the year! A slight concern, or a possible opportunity?
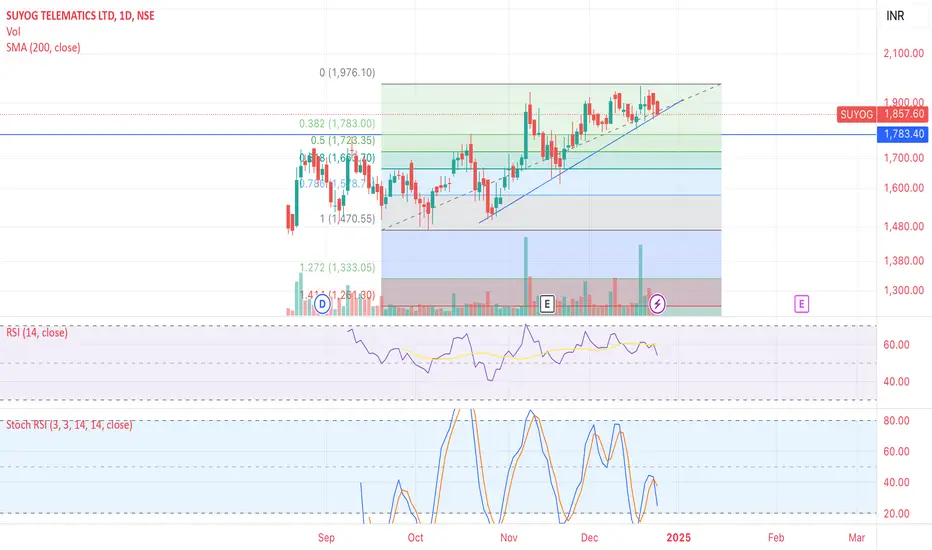
SUYOG TELE- at crucial supportSuyog Telematics- at crucial support. Break below and target 0.382 FIB which is also in line with the last wick down level hit.
NIFTY 50 : Mapping the future through harmony.Timeframe : Monthly
Tool : Fibonacci
My view in simple terms if Fractals were really to follow, NIFTY is yet to see more 10% gutter movement before it rallies.
Just an opinion, Your inputs, Suggestions and views are always welcomed.
Thank you for dropping by.

Asian Paints - don't waste time follow simple approach??NSE:ASIANPAINT
Too much talk about Asian Paints? Retail investors aren't all fundamental analysts and only sometimes have the time.
If you're screening and believe Asian Paints will withstand the competition, focus on that. Trust in the Indian growth story.
Note: I'm not buying or planning to – my focus is on growth. But for super long-term investors, this might be of interest.
Here's what I'm tracking – the 3-month candlestick chart from TradingView.
For heaven's sake, it's business – 3 months give us a fair timeline for price action to show some certainty.
Disc: No investment , no recommendation
#AsianPaints #Investing #TradingView #LongTermInvestment #pwinvest #trading

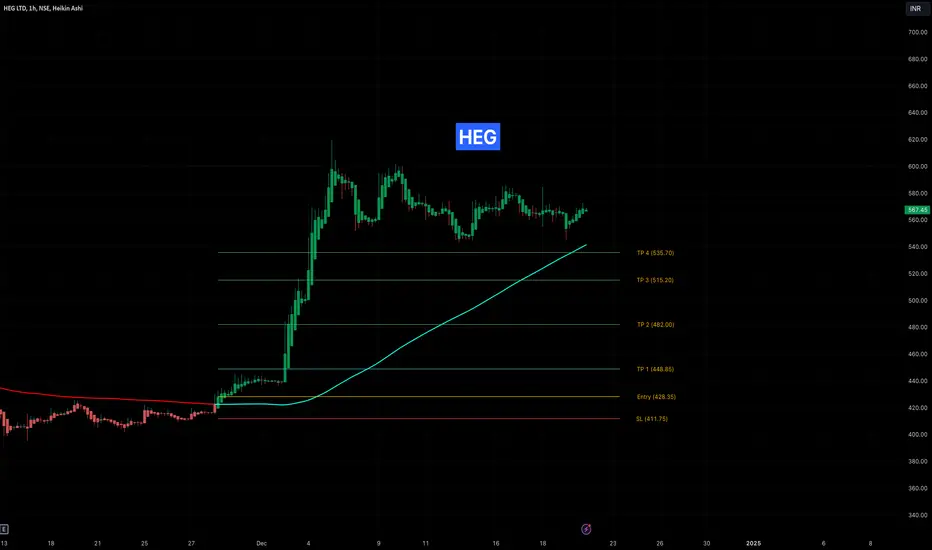
HEG Skyrockets! All Targets Nailed with RisologicalHEG on the 1-Hour timeframe successfully executed a long trade with all targets from TP1 to TP4 hit with remarkable precision.
Trade Highlights:
Entry: ₹428.35
Targets Hit:
TP1: ₹448.85
TP2: ₹482.00
TP3: ₹515.20
TP4: ₹535.70
Stop Loss: ₹411.75
Technical Insights:
This trade showcased the accuracy and reliability of the Risological Trading Indicator in identifying optimal entry points and scaling through multiple target levels. The upward trend was well-sustained, demonstrating confidence in the tool's ability to manage trades effectively.
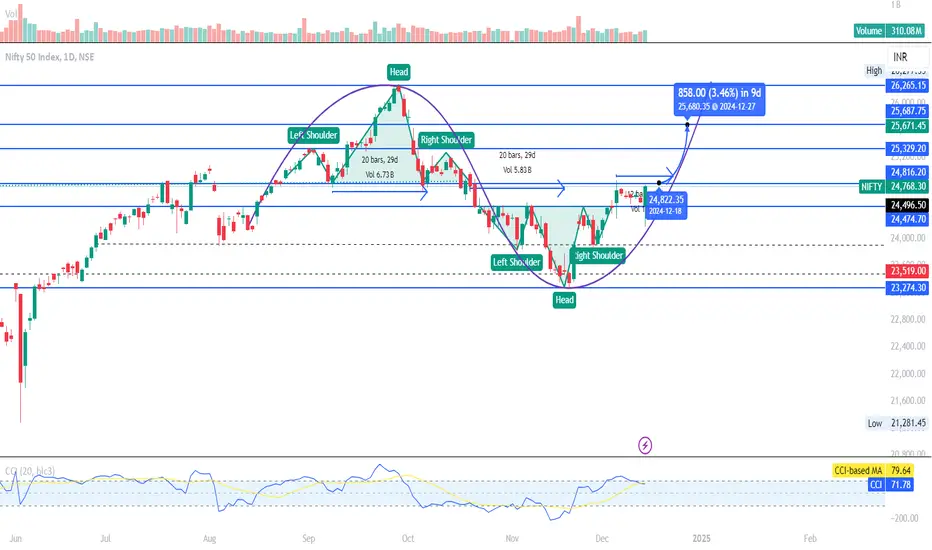
Nifty Breakout Confirmation- Ready to hit 25,647 !!Nifty 50: Outlook for next week and feb-25
After analyzing the index’s movement from August to December 2024, Nifty 50 has exhibited two key patterns:
1. Head & Shoulders:
• Rally from 24,887 to ATH 26,277 (Sep 9–26).
• Breakdown after completing the right shoulder on Oct 21, leading to a 1,500-point fall to 23,291 on Nov 22.
2. Inverse Head & Shoulders:
• Formation began on Oct 23, with the head completed on Nov 21 and a neckline formed by Nov 26.
• On Dec 4, the right shoulder completed, followed by a breakout above 24,463. The index consolidated for a week between Dec 4–13, strengthening the breakout signal.
Outlook
With strong confirmation of a bullish reversal above last week close, supported by FIIs inflows and favorable macroeconomic data (CPI/IIP), It is highly likely that Nifty 50 is likely to hit 25,647 by December 23, 2024. If the breakout doesn’t happen then we can see a consolidation and retest on last week levels failing which will lead to a breakdown which can push Nifty to 23,000 levels by Februrary 2025
Disclaimer: I am not SEBI-registered. This analysis is for educational and study purposes only. Any trade taken based on this view is solely at your own risk and is not a recommendation.
RELIANCEHi guys,
In this chart i Found a Demand Zone in RELIANCE CHART for Positional entry,
Observed these Levels based on price action and Demand & Supply.
*Don't Take any trades based on this Picture.
... because this chart is for educational purpose only not for Buy or Sell Recommendation..
Thank you

Buy The Anup Engineering Short Term Trading Advice by Goodluck Capital
Buy The Anup Engineering
Buy Range- 3530 - 3630
Target- 3850 - 3900
StopLoss- below 3330
Potential Return- 8-9%
Approx trade duration 12 - 14 days

BEML Ltd: Bullish Breakout AnalysisUpdate:
BEML secured a ₹136 crore order from the Ministry of Defence, strengthening its fundamentals and boosting investor sentiment.
Technical Highlights:
Breakout Zone: Stock broke above ₹4,500 resistance with strong volumes, confirming bullish momentum.
Key Levels:
Support: ₹4,300 | ₹4,040
Resistance: ₹4,762 | ₹4,995 | ₹5,205 | ₹5,472 (Fibonacci target).
Trend: Higher highs and higher lows indicate a sustained uptrend.
Momentum: RSI in overbought territory suggests strong buying pressure, with potential minor pullbacks.
Outlook:
The technical breakout, combined with a solid fundamental catalyst, positions BEML for a potential rally toward ₹5,200–₹5,470. A stop-loss below ₹4,300 is advised for risk management.
Disclaimer:
This is for educational purposes only. Please consult a financial advisor before investing.

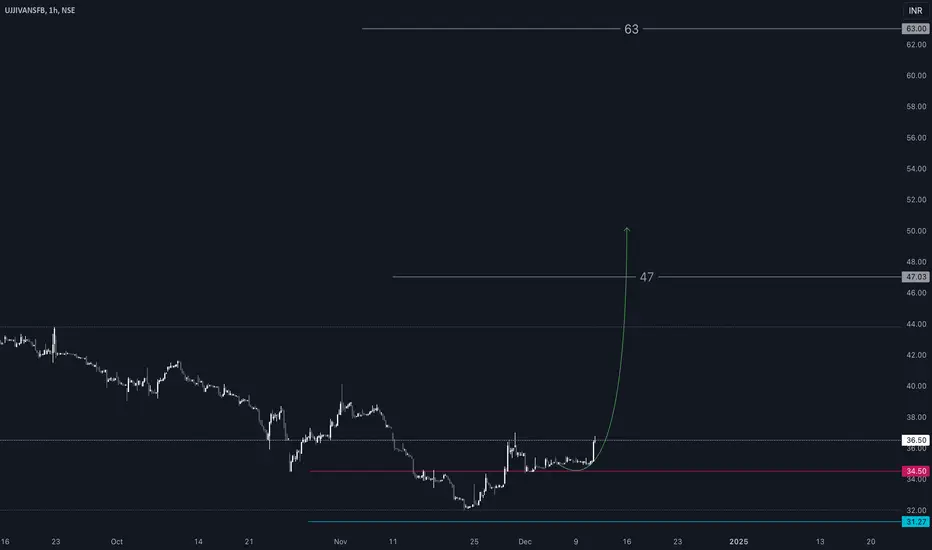
UJJIVANSFBHi guys,
In this chart i Found a Demand Zone in UJJIVANSFB CHART for Positional entry,
Observed these Levels based on price action and Demand & Supply.
*Don't Take any trades based on this Picture.
... because this chart is for educational purpose only not for Buy or Sell Recommendation..
Thank you
🚗 🚜 M&M - Post covid recovery or farm play> Keep a watch on M&M , I am waiting for end of month to check change in trend.
> disc: Invested and adding more .Disc: sharing only for educational purposes
Mahindra & Mahindra is engaged in the sale of automobiles, spares, mobility solutions, Construction Equipment and related services.

Rolex Rings Ready for Takeoff: Long Trade Targets ₹2741!Rolex Rings on the 4-hour timeframe is presenting a fresh long trade opportunity, with the price currently hovering around the entry level. This setup, identified using the Risological Swing Trading Indicator, is primed for a strong upward move targeting 2741.60 at TP4.
Rolex Rings Key Levels:
TP1: 2267.90
TP2: 2448.85
TP3: 2629.80
TP4: 2741.60
Technical Analysis:
The entry price is set at 2156.05, with a stop-loss at 2065.55, ensuring effective risk management.
The price recently broke through a significant resistance zone, signaling bullish momentum. With the Risological trend line confirming the upward bias, this trade setup offers a high-reward opportunity for traders looking to capitalize on the next potential rally.
Namaste!

Polycab India Ltd. - Short Position SetupAnalysis for Short Position Condition:
1.Key Breakdown Level:
₹7,282 is a critical horizontal support level. A decisive breakdown below this level could trigger a bearish move.
2.Volume Profile Analysis:
Below ₹7,282, the volume profile shows limited buying interest until ₹6,997, suggesting a potential drop to this level.
Further weakness could see the stock test ₹6,746, where significant buying activity has previously occurred.
3.Trendline Breakdown:
The stock is trading within an ascending channel. A breakdown below ₹7,282 will confirm the failure of this channel, indicating a trend reversal.
4.Moving Averages:
The 20-day EMA is currently acting as dynamic support near ₹7,282. A breakdown will likely push the stock toward the 50-day EMA around ₹6,997.
The 200-day EMA near ₹6,746 is a long-term support level to monitor.
5.RSI (Relative Strength Index):
RSI is neutral but could head toward oversold levels if the breakdown occurs, strengthening the bearish view.
6.Volume Confirmation:
Watch for an increase in sell-side volume during the breakdown for confirmation.
Trade Plan for Short Positions:
Entry Trigger: Below ₹7,282.
Targets:
Target 1: ₹6,997
Target 2: ₹6,746
Stop Loss: Above ₹7,438 (previous high near resistance).
Risk-Reward Ratio: Ensure an ideal ratio of at least 1:2 for the trade.
Alternate Scenario:
If ₹7,282 holds and the stock bounces, the immediate upside resistance is ₹7,654, above which the stock may resume its bullish trend.

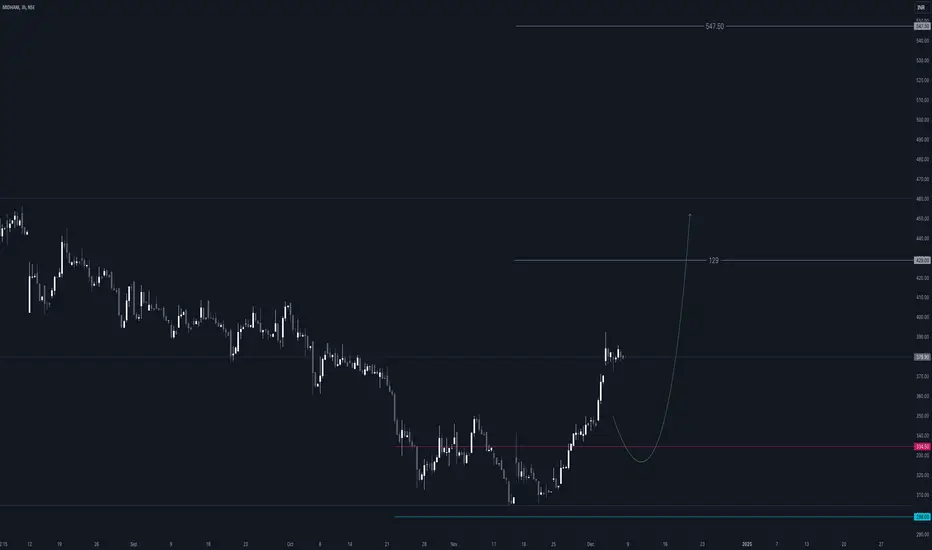
MIDHANIHi guys,
In this chart i Found a Demand Zone in MIDHANI CHART for Positional entry,
Observed these Levels based on price action and Demand & Supply.
*Don't Take any trades based on this Picture.
... because this chart is for educational purpose only not for Buy or Sell Recommendation..
Thank you
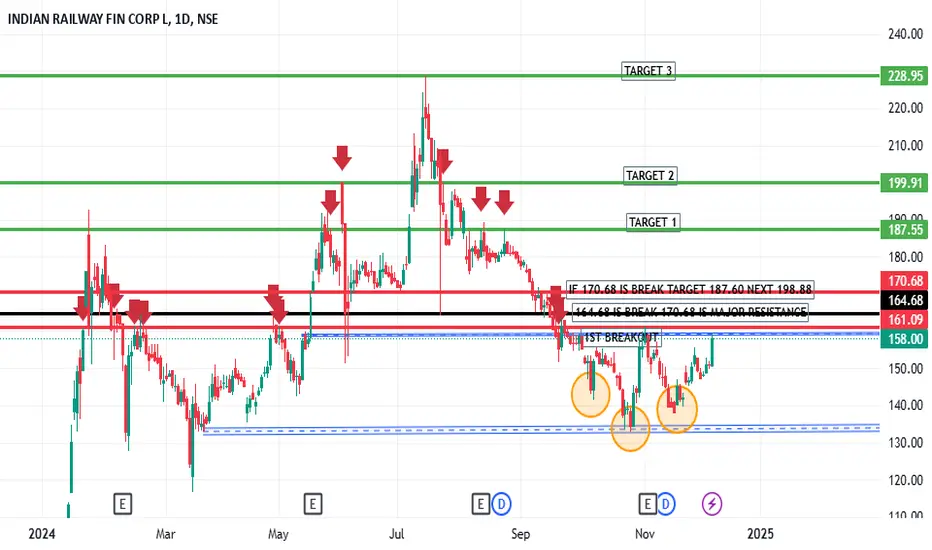
IRFC BREAKOUT LEVELS🚀 IRFC Breakout Levels to Watch! 📈
🔹 Resistance Level: ₹ 164.64
A breakout above ₹170.68 could send IRFC soaring towards ₹30–₹32! 💥
🔹 Trend Watch: Volume is key for confirming breakouts! 🔑
📊 Keep an eye on these levels for potential trading opportunities. Always set your stop losses and trade with caution! 📉
#IRFC #StockMarket #BreakoutLevels #TechnicalAnalysis #Investing #StockTrading #MarketUpdate #InvestSmart
DELHIVERY INTRADAY TARGETS DONE!Delhivery on the 15-minute timeframe delivered a stellar intraday performance, achieving all predefined targets with precision. This long trade was executed using the Risological Swing Trading Indicator , ensuring a well-timed entry and a disciplined approach.
Delhivery Key Levels:
TP1: 340.80 ✅
TP2: 346.20 ✅
TP3: 351.60 ✅
TP4: 354.90 ✅
Delhivery Technical Analysis:
The trade was initiated at an entry price of 337.45, with a stop-loss positioned at 334.75 to limit downside risk.
Delhivery exhibited strong bullish momentum, crossing the Risological trend line early in the session.
The stock maintained upward movement, achieving all take-profit levels in this intraday trade. This setup highlights the power of the Risological indicator in capturing quick and profitable opportunities in volatile markets.
All the best and do follow me for more success stories, insights, tips and profitable stock calls.
Namaste!

ITI Hits TP1! Target ₹450—Daily Chart Breakout!Indian Telephone Industries (ITI) on the daily timeframe has achieved TP1 and shows strong bullish momentum, making it highly probable to achieve TP2, TP3, and TP4. This trade was identified using the Risological Swing Trading Indicator , providing clear entry, stop-loss, and target levels.
Key Levels:
TP1: 301.40 ✅
TP2: 357.90 (Pending)
TP3: 414.40 (Pending)
TP4: 449.30 (Pending)
Technical Analysis:
The trade entry at 266.50 was confirmed with a breakout above key resistance levels, supported by bullish price action. The stop-loss is tightly placed at 238.25, ensuring risk is well managed. The current upward trajectory aligns with the Risological trend, signaling strong continuation toward the upper targets.
Traders should monitor the price action near TP2 and TP3 for any signs of consolidation or resistance, with the expectation of further upside potential.

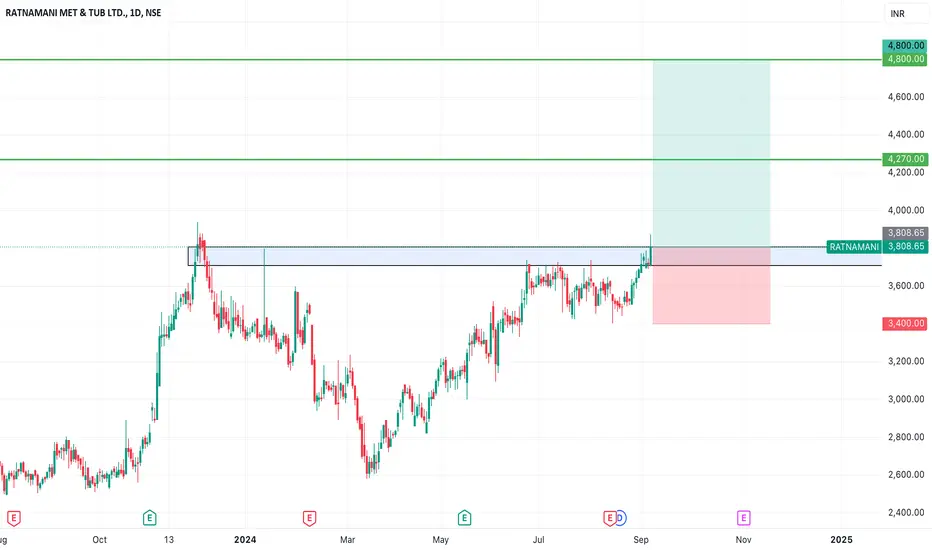
SWING IDEA - RATNAMANI MET AND TUBRatnamani Metals & Tubes, a leading manufacturer of stainless steel and carbon steel welded pipes and tubes, is showing a potential swing trade setup with several bullish technical signals.
Reasons are listed below :
3800 Zone Break Out : The 3800 level has acted as a strong resistance zone. The price is now breaking through this level, signaling the possibility of a continued upward move.
Bullish Engulfing Candle on Daily Timeframe : A bullish engulfing candle indicates strong buying interest, suggesting momentum may continue.
Trading Above 50 and 200 EMA : The stock is trading above both the 50 and 200 exponential moving averages, indicating overall bullish strength and long-term trend support.
Intact Trend : The broader trend remains intact, indicating that the current momentum is in line with the stock’s longer-term trajectory.
Gradual Increase in Volumes : A steady rise in volumes adds confirmation to the breakout, showing strong market participation in this move.
Target - 4270 // 4800
Stoploss - daily close below 3400
DISCLAIMER -
Decisions to buy, sell, hold or trade in securities, commodities and other investments involve risk and are best made based on the advice of qualified financial professionals. Any trading in securities or other investments involves a risk of substantial losses. The practice of "Day Trading" involves particularly high risks and can cause you to lose substantial sums of money. Before undertaking any trading program, you should consult a qualified financial professional. Please consider carefully whether such trading is suitable for you in light of your financial condition and ability to bear financial risks. Under no circumstances shall we be liable for any loss or damage you or anyone else incurs as a result of any trading or investment activity that you or anyone else engages in based on any information or material you receive through TradingView or our services.
@visionary.growth.insights
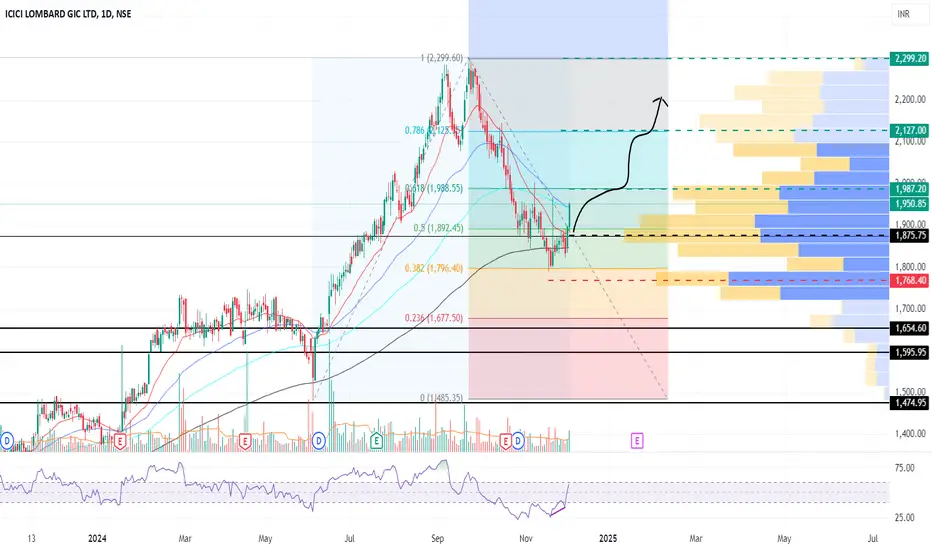
ICICI Lombard GIC Ltd. - Technical AnalysisPrice Action:
The stock recently took support near the 0.5 Fibonacci retracement level around ₹1,892, bouncing back with strong momentum. This aligns with a visible bullish RSI divergence as the price formed lower lows while the RSI made higher lows, signaling a potential reversal.
Key Levels (from Fibonacci):
Resistance 1: ₹1,987 (61.8% Fibonacci level)
Resistance 2: ₹2,127 (78.6% Fibonacci level)
Final Target: ₹2,299 (Fibonacci extension, previous high)
Support 1: ₹1,892 (0.5 Fibonacci level, current support)
Support 2: ₹1,796 (38.2% Fibonacci level)
Support 3: ₹1,677 (23.6% Fibonacci level)
Entry, Stop Loss, and Targets:
Entry: Around ₹1,940-₹1,950 (post breakout confirmation above ₹1,950).
Stop Loss: ₹1,875 (below the 0.5 Fibonacci level and near recent support).
Targets:
Target 1: ₹1,987 (61.8% Fibonacci level)
Target 2: ₹2,127 (78.6% Fibonacci level)
Target 3: ₹2,299 (previous swing high)
Volume and RSI Observations:
The volume profile shows increased participation near ₹1,900 levels, confirming accumulation.
RSI is recovering from oversold levels and shows divergence, supporting a potential bullish continuation.
Conclusion:
If the stock holds above ₹1,892, the bullish trend might continue toward ₹1,987 and higher targets. Maintain discipline with the stop-loss to manage risk effectively.
CreditAccess Grameen: Making a Difference in Microfinance◉ Abstarct
The Indian microfinance sector has grown significantly, reaching a total loan amount of about ₹4.33 lakh crore (around $52 billion) by March 2024, which is a 24.5% increase from the previous year. CreditAccess Grameen Limited plays a vital role by providing loans mainly to low-income women, helping them improve their lives.
The company saw an 11.8% growth in its total assets and a 20.8% rise in net interest income for the second quarter of FY25. Despite facing challenges like high-interest rates and regulatory pressures, it expects continued growth due to favorable rural conditions and technology improvements. Lower interest rates in the future could also boost profits and share prices for microfinance institutions like CreditAccess Grameen.
Read full analysis here..........
◉ Introduction
The Indian microfinance sector has evolved significantly over the past five decades, becoming a crucial component of the country's financial landscape. Here’s an overview of its current status, growth trajectory, challenges, and impact.
◉ Current Status
● Market Size: As of March 31, 2024, the microfinance industry boasts a gross loan portfolio of approximately ₹4.33 lakh crore (around $52 billion), marking a year-on-year growth of 24.5%. This growth underscores the sector's resilience and capacity to adapt to changing economic conditions.
● Customer Base: The sector serves around 78 million customers, with a notable increase in clientele from rural and semi-urban areas. This demographic shift reflects the sector's commitment to enhancing financial inclusion.
● Institutional Landscape: The microfinance sector comprises 168 Micro Finance Institutions (MFIs) operating across various states and union territories, with non-banking financial companies (NBFCs) leading the market with a share of 39.1%, compared to traditional banks at 33.5% as of FY23.
◉ Growth Drivers
● Regulatory Framework: The introduction of favourable regulations by the Reserve Bank of India (RBI) has facilitated growth by allowing MFIs greater flexibility in setting interest rates and expanding their lending capabilities. The establishment of MUDRA Bank has also played a pivotal role in financing small businesses.
● Technological Advancements: The integration of technology in operations has improved efficiency and customer outreach, enabling MFIs to serve a larger client base effectively.
● Government Initiatives: Programs aimed at promoting women's entrepreneurship and financial literacy have bolstered the sector's growth. Initiatives such as the Pradhan Mantri Mahila Shakti Kendra aim to empower women through easier access to credit.
◉ Impact of Monetary Policy Decisions on Microfinance
● Interest Rates: Changes in the repo rate influence borrowing costs for microfinance institutions (MFIs). Lower rates reduce loan costs for borrowers, promoting demand for microfinance products.
● Access to Credit: Relaxed monetary policy improves liquidity, encouraging banks to lend to MFIs, which enhances their ability to provide loans to underserved populations.
● Economic Activity: Lower interest rates stimulate economic growth, improving borrowers' repayment capacity and reducing default rates.
◉ Key Players in the Microfinance Sector
Several prominent companies operate within the Indian microfinance landscape:
1. Ujjivan Financial Services Limited: A major player that transitioned into banking with Ujjivan Small Finance Bank, focusing on serving unbanked populations.
2. Bandhan Bank: Initially a microfinance institution, it became a bank in 2015 and provides a variety of financial products aimed at rural and semi-urban areas.
3. Bharat Financial Inclusion Limited (BFIL): Formerly known as SKS Microfinance, BFIL offers microcredit services across India and emphasizes empowering women entrepreneurs.
4. CreditAccess Grameen Limited: This institution focuses on providing loans to low-income households and has established a strong presence in rural regions.
5. Spandana Sphoorty Financial Ltd.: An NBFC-MFI that provides various financial services to economically disadvantaged individuals.
6. Arohan Financial Services Limited: Offers microfinance solutions and is part of the Aavishkaar-Intellecap Group.
Other notable players include Utkarsh Small Finance Bank , Share Microfin Limited , Muthoot Microfin Limited , and Satin Creditcare Network Limited , all contributing to the sector's growth through innovative financial products tailored for low-income clients
◉ Challenges Facing the Sector
Despite its growth trajectory, the Indian microfinance sector faces several challenges:
● Over-Indebtedness: Many borrowers struggle with high-interest rates and multiple loans from different MFIs, leading to financial stress.
● Regulatory Compliance: The sector is subject to strict regulations imposed by the Reserve Bank of India (RBI), which can affect operational flexibility.
● Financial Literacy: Low levels of financial literacy among borrowers can hinder effective utilization of microfinance services
In this in-depth analysis, we'll explore CreditAccess Grameen's market positioning and competitive dynamics, shedding light on its remarkable impact in India's microfinance landscape
◉ Company Overview
CreditAccess Grameen Limited NSE:CREDITACC , a leading non-banking financial company, provides microfinance services to women from low-income households in India. The company offers microcredit loans for income generation, home improvement, and emergency needs, as well as insurance services, retail finance loans, and digital lending products. Incorporated in 1991 and headquartered in Bengaluru, India, CreditAccess Grameen Limited operates as a subsidiary of CreditAccess India BV. Formerly known as Grameen Koota Financial Services Private Limited, the company was renamed in January 2018.
◉ Market Capitalization - ₹ 15,608 Cr.
◉ Investment Advice
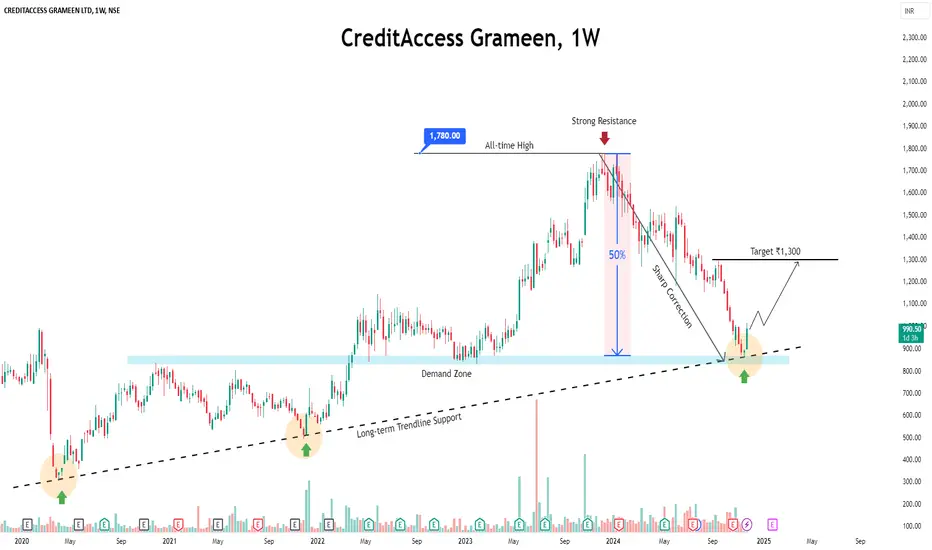
💡 Buy CreditAccess Grameen NSE:CREDITACC
● Buy Range - 950 - 970
● Sell Target - 1280 - 1300
● Potential Return - 30% - 35%
● Approx Holding Period - 12-14 months
◉ Q2 FY25 Earnings Performance Summary
● Total AUM Growth: Increased by 11.8% year-over-year, reaching INR 25,133 Crore.
● Gross Loan Portfolio (GL): Rose by 9.3% year-over-year to INR 24,188 Crore.
● Retail Finance (RF) Portfolio: Demonstrated strong growth with an AUM of INR 945 Crore.
● Customer Base: Grew by 7.2% year-over-year to 49.33 Lakh, with the addition of 1.46 Lakh new customers in Q2 FY25.
● Branch Network: Expanded to 2,031 branches across 398 districts, adding 55 new branches during the quarter.
◉ Financial Highlights
● Net Interest Income (NII): Increased by 20.8% year-over-year to INR 933 Crore.
● Cost of Borrowings: Average cost remained stable at 9.8%, with a marginal cost of 9.4%.
● Portfolio Yield: Held steady at 21.1%, with an interest spread of 11.4%, among the lowest in the microfinance sector.
● Net Interest Margin (NIM): Improved to 13.5%, up from 13.0% in Q1 FY25.
● Cost-to-Income Ratio: Reported at 30.7%; Pre-Provisioning Operating Profit (PPOP) grew by 19.5% year-over-year to INR 672 Crore.
● Profit After Tax (PAT): Recorded at INR 186 Crore for Q2 FY25, with a Return on Assets (ROA) of 2.7% and a Return on Equity (ROE) of 10.7%.
◉ Asset Quality Update
A temporary rise in delinquency attributed to:
● Interventions by third parties impacting repayment capabilities.
● Liquidity and cash flow challenges experienced by customers.
● Income fluctuations for agricultural laborers due to adverse weather conditions.
◉ NPA Status Overview
● As of September 2024, preliminary data indicates a slight uptick in NPAs with a gross NPA ratio of 2.44% and a net NPA ratio of 0.76%. This change may reflect broader economic conditions or specific challenges faced by borrowers in the microfinance segment.
◉ FY25 Performance Guidance
● Loan portfolio growth expected at 8-12%.
● NIM forecasted at 12.8-13.0%.
● Credit cost guidance at 4.5-5.0%.
● ROA projected at 3.0-3.5%, ROE at 12.0-14.0%.
◉ Management Confidence
Management is confident that the ongoing delinquency cycle will be short-term, stabilizing by Q3 FY25. Looking ahead, the company expects to gain momentum in Q4 FY25, fueled by favourable rural economic conditions.
◉ Technical Aspects
● After hitting an all-time peak of 1,780, the stock plummeted 50%.
● Currently, it's staging a recovery from the long-term trendline support, with substantial upside potential.
◉ Conclusion
CreditAccess Grameen is well-positioned for substantial growth, driven by increasing demand for financial services among low-income groups, ongoing government support, and advancements in digital technology. The company's strong financial foundation will enable it to capitalize on these trends.
Furthermore, the current high interest rates are expected to decrease soon, leading to lower borrowing costs for microfinance institutions (MFIs) like CreditAccess Grameen. This reduction in borrowing costs will likely enhance profitability, which in turn may positively impact the company's share price, driving it to higher levels.