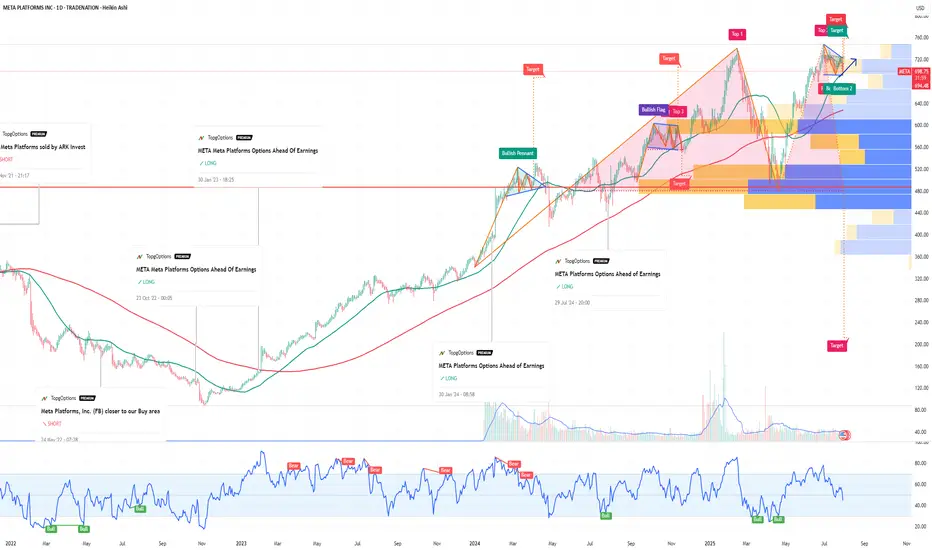
META Meta Platforms Options Ahead Of EarningsIf you haven`t bought META before the rally:
Now analyzing the options chain and the chart patterns of META Platforms prior to the earnings report this week,
I would consider purchasing the 710usd strike price in the money Calls with
an expiration date of 2026-6-18,
for a premium of approximately $89.30.
If these options prove to be profitable prior to the earnings release, I would sell at least half of them.
Disclosure: I am part of Trade Nation's Influencer program and receive a monthly fee for using their TradingView charts in my analysis.
Indicators
Xmoon Indicator Tutorial – Part 2 – Pivots🔻🔻🔻+ Persian translation below 🔻🔻🔻
🔹 What Is a Pivot?
In the Xmoon strategy, every high or low that forms on the chart is considered a pivot.
The number of candles between two highs or two lows defines the size of the pivot.
The more candles there are between them, the larger and more reliable the pivot becomes.
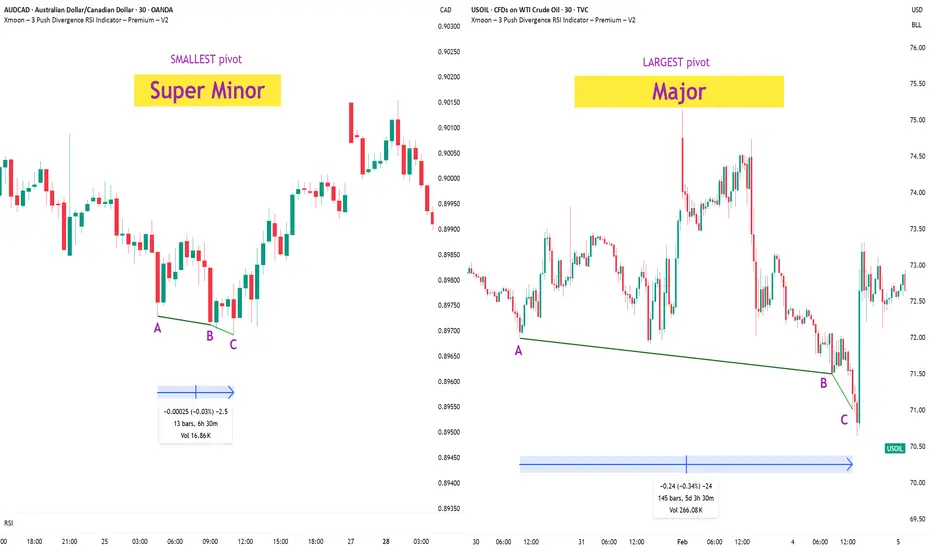
🔸 Types of Pivots in the Xmoon Indicator Settings
In the settings panel, you can choose which types of pivots the patterns should be based on.
There are 4 pivot types :
• Super Minor → the smallest pivot
• Minor
• Mid Major
• Major → the largest pivot
⏫ As you move from Super Minor to Major, the strength of the pivot increases — but the number of signals decreases.
⚖️ Choosing the Right Pivot = Your Trading Style
• Want more signals? → Use smaller pivots like Minor or Super Minor
• Prefer higher accuracy and lower risk? → Use larger pivots like Major or Mid Major
💡 Pro Tip: On higher timeframes, pivots perform better and help reduce risk.
✍️ Summary
If you're looking for frequent signals, trade on lower timeframes, and can handle higher volatility and pressure, then smaller pivots like Super Minor and Minor are a better choice.
But if you prefer quality over quantity, work on higher timeframes, and value clarity, peace of mind, and higher success rates, then larger pivots like Mid Major and Major are the way to go.
📣 If you have any questions or need guidance, feel free to ask us. We’d be happy to help.
🔻🔻🔻 Persian Section – بخش فارسی 🔻🔻🔻
🔹 پیوت چیست؟
در استراتژی ایکسمون، هر قله یا درهای که روی چارت شکل میگیرد، یک پیوت محسوب می شود
فاصله زمانی بین دو قله یا دو دره (یعنی تعداد کندلهایی که بینشان قرار دارد) اندازهی پیوت را مشخص میکند
هرچه تعداد کندل بین دو سقف یا کف بیشتر باشد، آن پیوت بزرگتر و معتبرتر است
🔸 انواع پیوت در تنظیمات اندیکاتور ایکسمون
در بخش تنظیمات، میتوانید مشخص کنید که الگوها بر اساس چه نوع پیوتهایی شناسایی شوند
ما ۴ نوع پیوت داریم
• سوپر مینور ← کوچکترین پیوت
• مینور
• میدماژور
• ماژور ← بزرگترین پیوت
⏫ هرچه از سوپرمینور به سمت ماژور برویم، قدرت پیوت بیشتر میشود، ولی تعداد سیگنالها کمتر می شود
⚖️ انتخاب پیوت مناسب = سبک معاملاتی شما
• به دنبال سیگنال زیاد هستید ← پیوت کوچک تر = مینور و سوپرمینور
• به دنبال دقت بیشتر و ریسک کمتر هستید← پیوت بزرگتر = ماژور و میدماژور
💡 نکته حرفهای: در تایمفریمهای بالا، پیوتها عملکرد بهتری دارند و به کنترل ریسک کمک میکنند
✍️ جمعبندی
اگر دنبال سیگنالهای زیاد هستید، در تایمفریمهای کوچکتر کار میکنید و میتونید نوسانات و فشار روانی بالاتر رو تحمل کنید، پیوتهای کوچکتر مثل سوپرمینور و مینور انتخاب مناسبتری هستند
اما اگر در تایم فریم های بزرگتر کار می کنید و کیفیت سیگنال، آرامش ذهنی و احتمال موفقیت برایتان مهمتر است، پیوتهای بزرگتر مثل میدماژور و ماژور انتخاب بهتری هستند
📣 اگر سوالی دارید یا نیاز به راهنمایی دارید، خوشحال میشویم از ما بپرسید
با کمال میل در خدمتتان هستیم
Xmoon Indicator Tutorial – Part 1 – Strategy🔻🔻🔻+ Persian version below🔻🔻🔻
📘 Xmoon Indicator Tutorial – Part 1
🎯 3Push Divergence RSI Strategy
🔥 The core of the Xmoon indicator
is built upon one of the most powerful strategies in technical analysis:
The advanced 3Push Divergence RSI pattern
🔁 A pattern that typically appears at key market turning points.
📉 When the price moves in the same direction three consecutive times on pivot points (e.g., making lower lows or higher highs), but the RSI shows the opposite behavior, it indicates a clear divergence !
💡 This divergence can act as a strong signal for a potential trend reversal.
🎯 The Xmoon Indicator is designed to detect this critical moment.
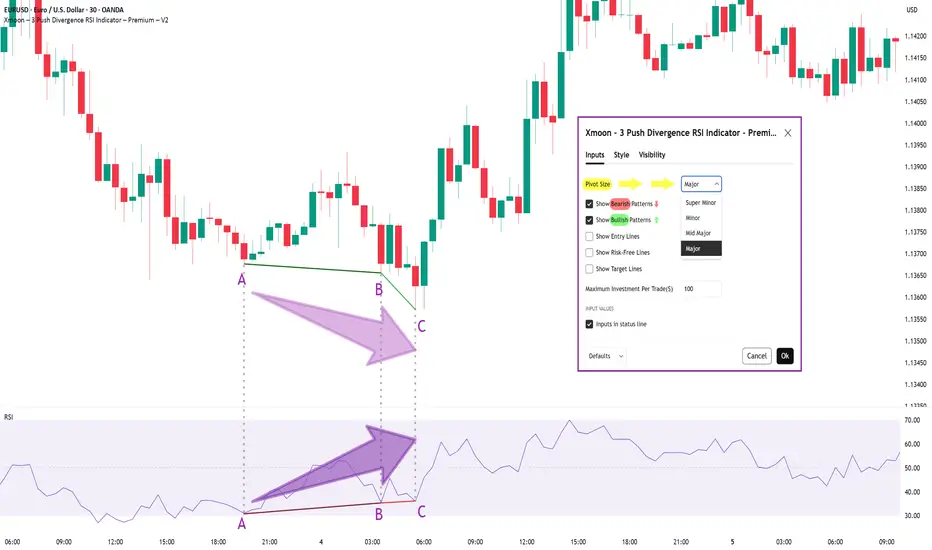
⚙️ Xmoon Indicator Settings Panel
The Xmoon settings panel offers the following options:
🔸 Pattern Type Selection: In the first and second lines, you can specify which type of pattern should be displayed: only bullish patterns or only bearish ones. You can also check both options.
🔸 Pivot Type Selection: From the dropdown menu, you can choose one of four pivot types:
“Super Minor”, “Minor”, “Mid-Major”, and “Major”, ordered from smallest to largest.
📌 Educational Note: The greater the distance (in candle count) between two lows or two highs, the larger the pivot is considered.
A Major Pivot is the largest among them.
✅ Larger Pivot = Higher Accuracy
❗ But naturally = Fewer Signals
📣 If you have any questions or need guidance, feel free to ask us. We’d be happy to help.
🔻🔻🔻بخش فارسی – Persian Section 🔻🔻🔻
📘 آموزش اندیکاتور ایکسمون - قسمت اول
🎯 استراتژی سهپوش واگرایی (3Push Divergence RSI)
🔥 هسته اصلی ایکسمون
بر پایه یکی از قویترین استراتژیهای تحلیل تکنیکال طراحی شده است
الگوی پیشرفته سهپوش واگرایی
🔁 الگویی که معمولاً در نقاط چرخش مهم بازار ظاهر میشود
📉 وقتی قیمت سه بار پشت سر هم روی نقاط پیوت ، در یک جهت حرکت میکند (مثلاً کفهای پایینتر یا سقفهای بالاتر میسازد) ، اما آر-اِس-آی خلاف آن را نشان میدهد، یعنی یک واگرایی آشکار رخ داده است
💡این واگرایی میتواند سیگنالی قوی برای برگشت روند باشد
🎯 اندیکاتور ایکسمون این لحظه را شناسایی میکند
⚙️ پنجره تنظیمات اندیکاتور ایکسمون
در بخش تنظیمات اندیکاتور ایکسمون، امکاناتی در اختیار شما قرار دارند
🔸 انتخاب نوع الگو: در خط اول و دوم میتوانید مشخص کنید چه نوع الگویی نمایش داده شود
فقط الگوهای صعودی یا فقط نزولی. همچنین می توانید تیک هر دو گزینه را بزنید
🔸 انتخاب نوع پیوتها: از پنجره کشویی بالا، می توانید یکی از ۴ نوع پیوت را انتخاب کنید
پیوت ها به ترتیب از کوچک به بزرگ عبارتند از: سوپر مینور ، مینور ، میدماژور و ماژور
📌 نکته آموزشی: هرچه فاصله بین دو کف یا دو سقف بیشتر باشد (یعنی تعداد کندلهای بین آنها زیادتر باشد)، آن پیوت، بزرگتر محسوب میشود
پیوت ماژور از بقیه بزرگ تر است
✅ پیوت بزرگتر = دقت بالاتر
❗ اما طبیعتاً = تعداد سیگنال کمتر
📣 اگر سوالی دارید یا نیاز به راهنمایی دارید، خوشحال میشویم از ما بپرسید
با کمال میل در خدمتتان هستیم
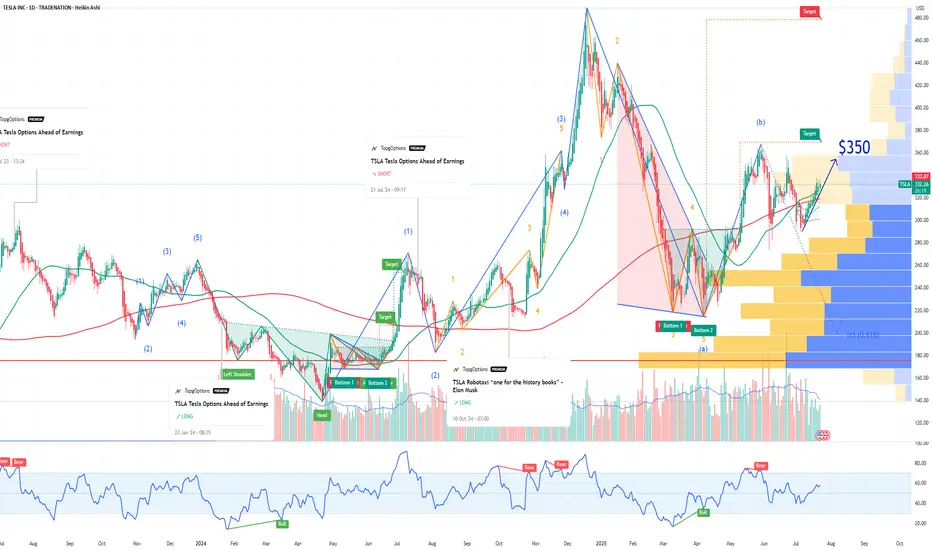
TSLA Tesla Options Ahead of EarningsIf you haven`t bought TSLA before the recent rally:
Now analyzing the options chain and the chart patterns of TSLA Tesla prior to the earnings report this week,
I would consider purchasing the 350usd strike price Calls with
an expiration date of 2025-8-15,
for a premium of approximately $14.90.
If these options prove to be profitable prior to the earnings release, I would sell at least half of them.
Disclosure: I am part of Trade Nation's Influencer program and receive a monthly fee for using their TradingView charts in my analysis.
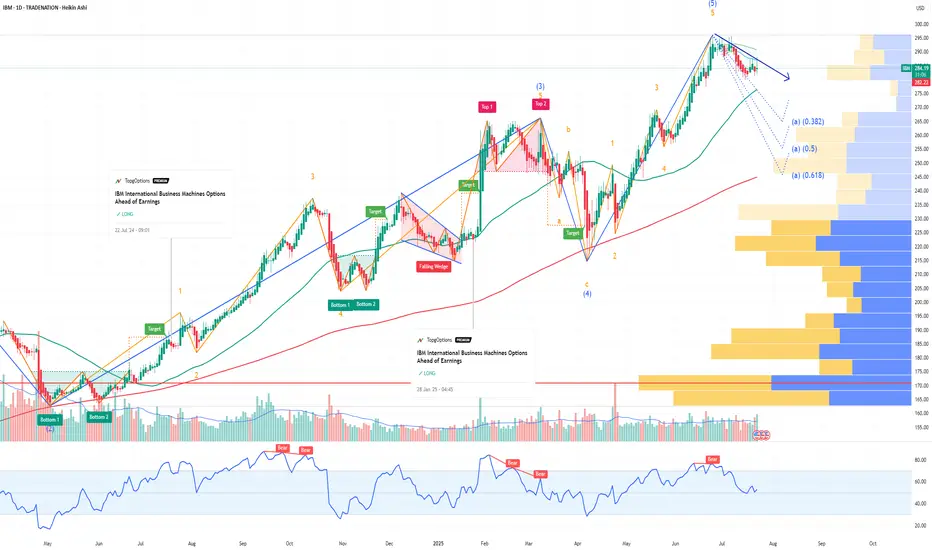
IBM International Business Machines Options Ahead of EarningsIf you haven`t bought IBM before the rally:
Now analyzing the options chain and the chart patterns of IBM International Business Machines prior to the earnings report this week,
I would consider purchasing the 290usd strike price Puts with
an expiration date of 2025-9-19,
for a premium of approximately $17.30.
If these options prove to be profitable prior to the earnings release, I would sell at least half of them.
Disclosure: I am part of Trade Nation's Influencer program and receive a monthly fee for using their TradingView charts in my analysis.
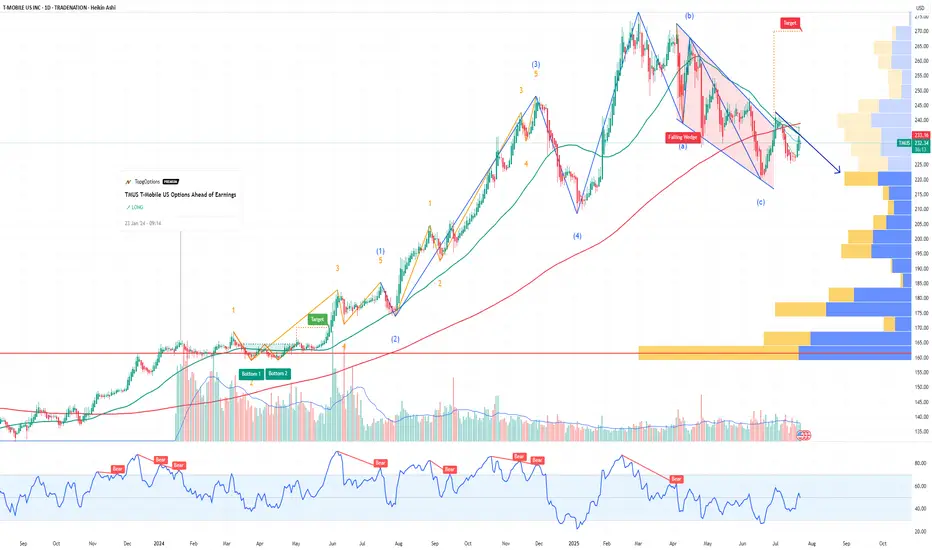
TMUS T-Mobile US Options Ahead of EarningsIf you haven`t bought TMUS before the rally:
Now analyzing the options chain and the chart patterns of TMUS T-Mobile US prior to the earnings report this week,
I would consider purchasing the 227.5usd strike price Puts with
an expiration date of 2025-7-25,
for a premium of approximately $3.50.
If these options prove to be profitable prior to the earnings release, I would sell at least half of them.
Disclosure: I am part of Trade Nation's Influencer program and receive a monthly fee for using their TradingView charts in my analysis.
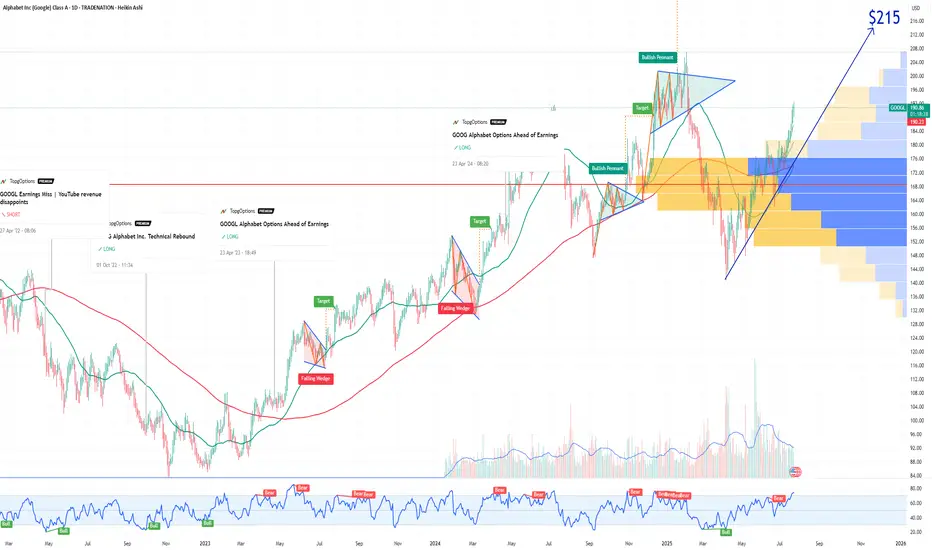
GOOGL Alphabet Options Ahead of EarningsIf you haven`t bought GOOGL before the rally:
Now analyzing the options chain and the chart patterns of GOOGL Alphabet prior to the earnings report this week,
I would consider purchasing the 215usd strike price Calls with
an expiration date of 2026-1-16,
for a premium of approximately $8.20.
If these options prove to be profitable prior to the earnings release, I would sell at least half of them.
Disclosure: I am part of Trade Nation's Influencer program and receive a monthly fee for using their TradingView charts in my analysis.
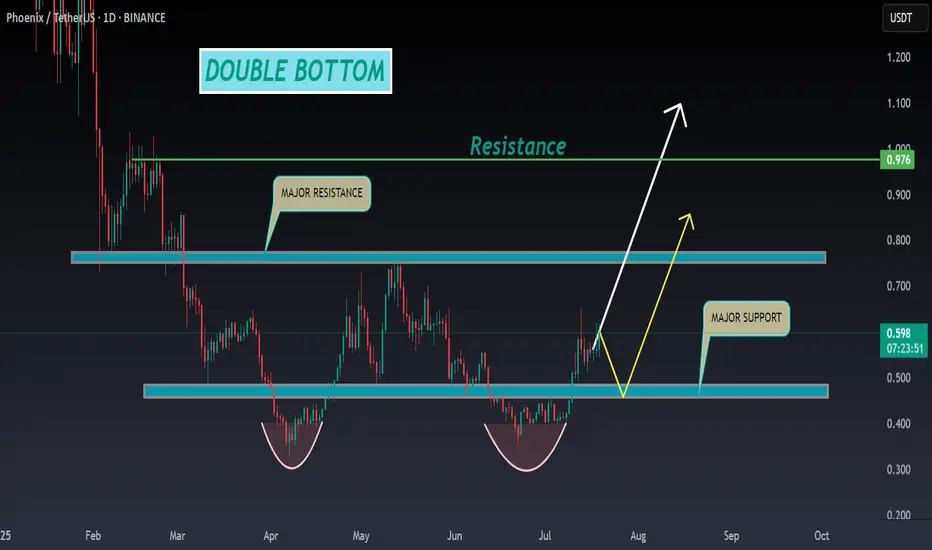
PHB ANALYSIS🔮#PHB Analysis :
📈📈 #PHB is making perfect Double Bottom Pattern. We can see a good pump if #PHB breakout the major resistance zone with good volume and sustains the higher price after breakout 🚀🚀
📊 Current Price: $0.595
⏳ Target Price: $0.780
⁉️ What to do?
- We can trade according to the chart and make some profits in #PHB. Keep your eyes on the chart, observe trading volume and stay accustom to market moves.💲💲
#PHB #Cryptocurrency #Pump #DYOR #Breakout
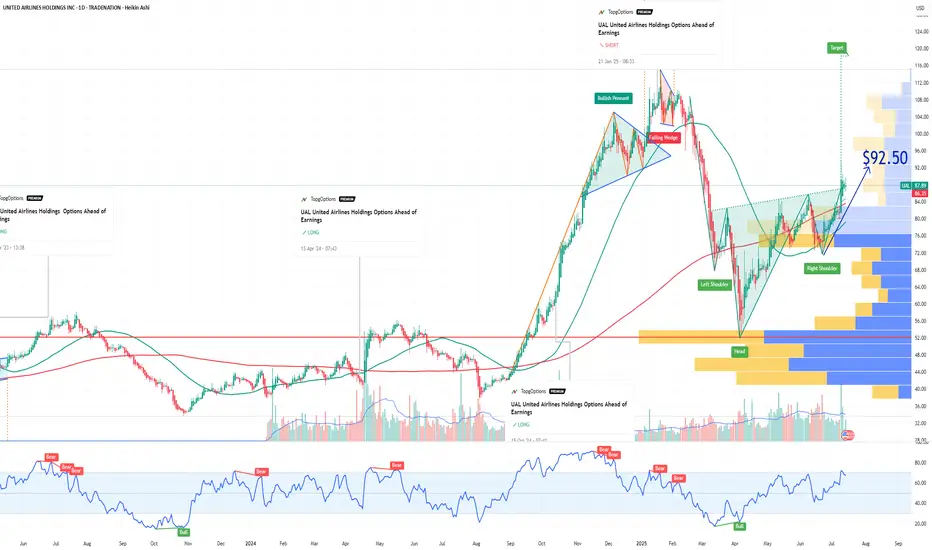
UAL United Airlines Holdings Options Ahead of EarningsIf you haven`t exited UAL before the recent selloff:
Now analyzing the options chain and the chart patterns of UAL United Airlines Holdings prior to the earnings report this week,
I would consider purchasing the 92.5usd strike price Calls with
an expiration date of 2025-9-19,
for a premium of approximately $5.12.
If these options prove to be profitable prior to the earnings release, I would sell at least half of them.
BRIEFING Week #29-30 : BTC stalling, ETH & then Alts ?Here's your weekly update ! Brought to you each weekend with years of track-record history..
Don't forget to hit the like/follow button if you feel like this post deserves it ;)
That's the best way to support me and help pushing this content to other users.
Kindly,
Phil

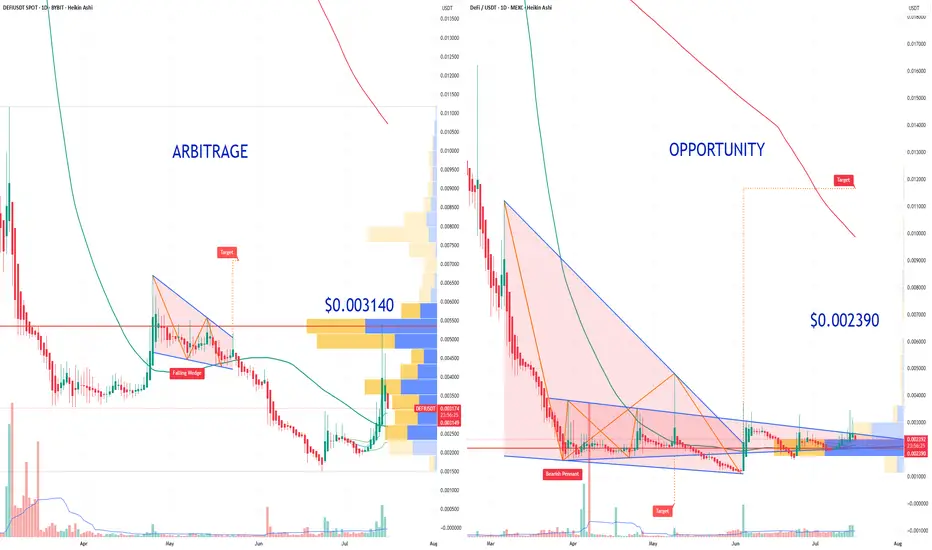
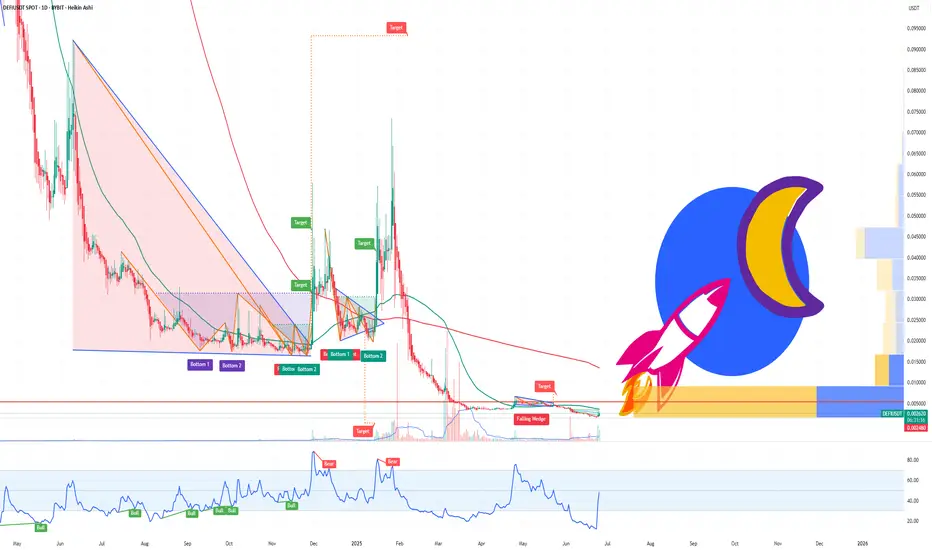
Arbitrage Opportunity!I believe I’ve identified an arbitrage opportunity involving the DEFI cryptocurrency: it trades at $0.003200 on Bybit, compared to only $0.002390 on MEXC.
I recall encountering a similar situation with Shiba Inu, when the price gap between Binance and Coinbase was as high as 8X. Feel free to play the chart below to see the outcome:
I also remember the 2016–2017 period, when such arbitrage opportunities existed even with Bitcoin, due to price discrepancies between Asian exchanges and those available to European traders.
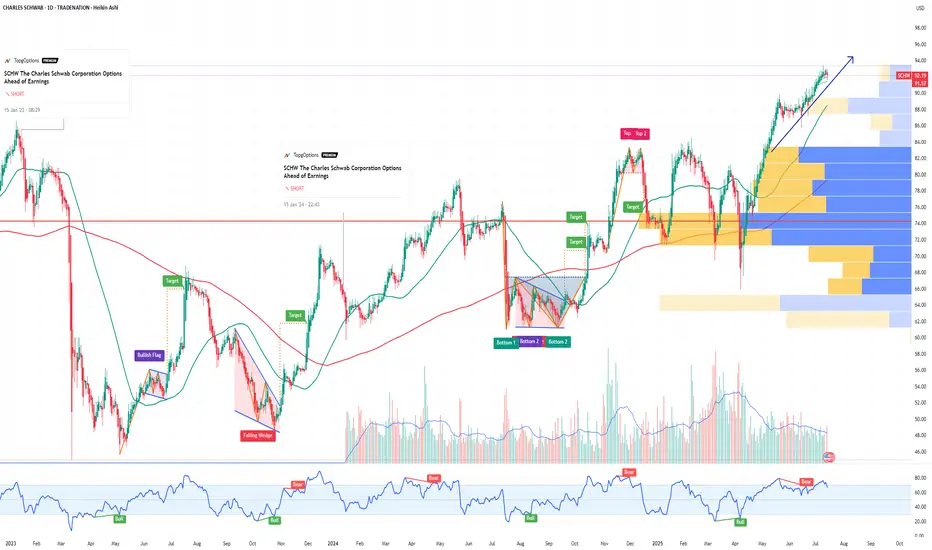
SCHW The Charles Schwab Corporation Options Ahead of EarningsIf you haven`t sold SCHW before the sell-off:
Now analyzing the options chain and the chart patterns of SCHW The Charles Schwab Corporation prior to the earnings report this week,
I would consider purchasing the 92.5usd strike price Calls with
an expiration date of 2026-1-16,
for a premium of approximately $7.15.
If these options prove to be profitable prior to the earnings release, I would sell at least half of them.
Disclosure: I am part of Trade Nation's Influencer program and receive a monthly fee for using their TradingView charts in my analysis.
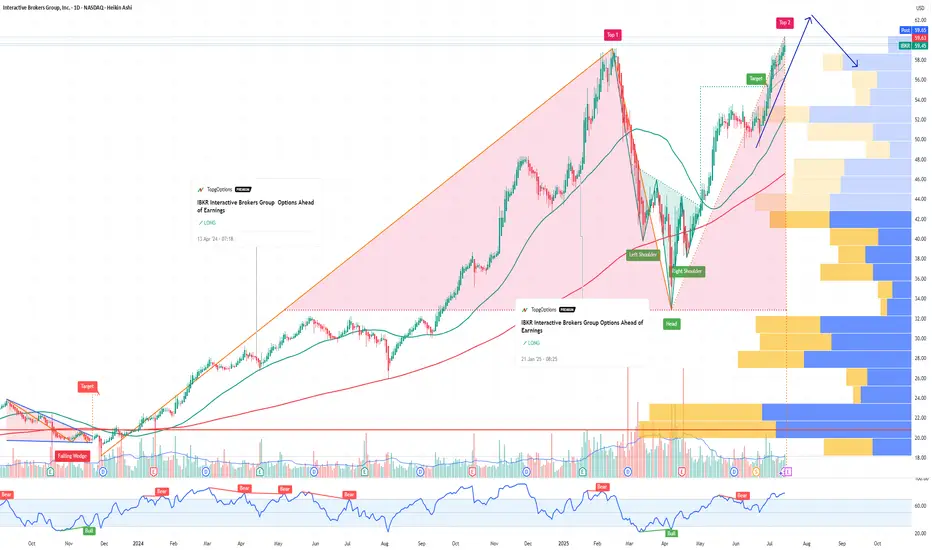
IBKR Interactive Brokers Group Options Ahead of EarningsIf you haven`t bought IBKR before the rally:
Now analyzing the options chain and the chart patterns of IBKR Interactive Brokers prior to the earnings report this week,
I would consider purchasing the 60usd strike price Calls with
an expiration date of 2025-9-19,
for a premium of approximately $3.90.
If these options prove to be profitable prior to the earnings release, I would sell at least half of them.
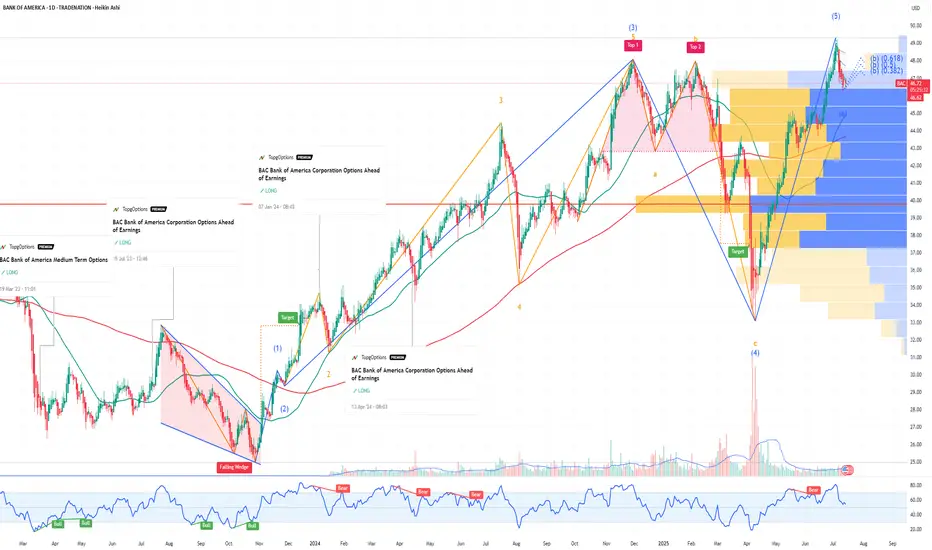
BAC Bank of America Corporation Options Ahead of EarningsIf you haven`t bought BAC before the rally:
Now analyzing the options chain and the chart patterns of BAC Bank of America Corporation prior to the earnings report this week,
I would consider purchasing the 48usd strike price Calls with
an expiration date of 2025-7-18,
for a premium of approximately $0.34.
If these options prove to be profitable prior to the earnings release, I would sell at least half of them.
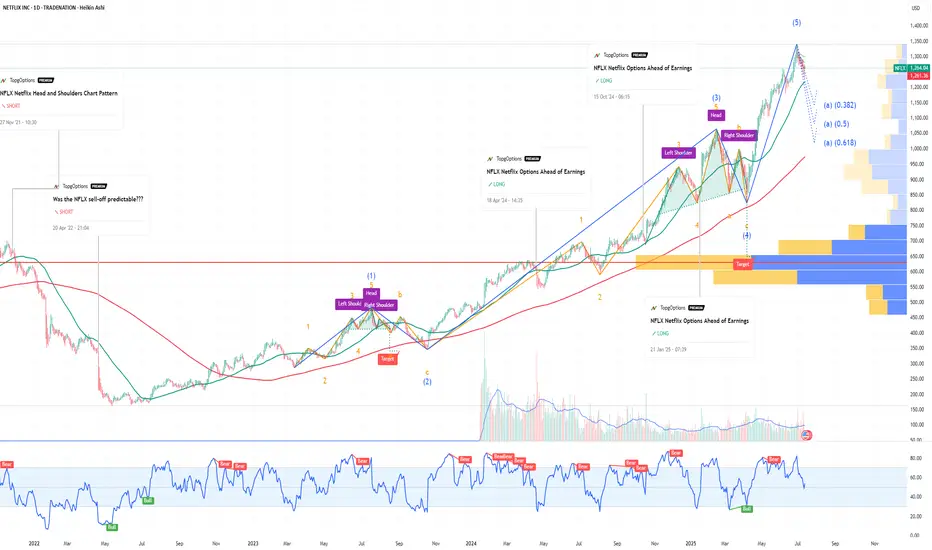
NFLX Netflix Options Ahead of EarningsIf you haven`t bought NFLX before the previous earnings:
Now analyzing the options chain and the chart patterns of NFLX Netflix prior to the earnings report this week,
I would consider purchasing the 1260usd strike price Puts with
an expiration date of 2025-9-19,
for a premium of approximately $71.10.
If these options prove to be profitable prior to the earnings release, I would sell at least half of them.
Disclosure: I am part of Trade Nation's Influencer program and receive a monthly fee for using their TradingView charts in my analysis.
DEFI the Next Crypto Sleeper? Trump Jr. & O’Leary Back on Stage!Fundamental Bullish Case:
1. Huge Names Are Paying Attention
Earlier this year, De.Fi held a high-profile event attended by Donald Trump Jr. and Kevin O’Leary. Regardless of political views, this kind of exposure brings:
Mainstream visibility to a previously overlooked microcap.
Credibility among non-crypto retail investors.
The possibility of future partnerships or integrations with major capital players.
When figures like O’Leary (a former FTX critic turned crypto backer) show up, it means the project is on the radar.
2. De.Fi = A Web3 Security & Aggregator Suite
The DEFI token powers the De.Fi “super app”, which combines:
Smart contract security auditing (via their Scanner tool).
Cross-chain asset dashboard — track DeFi investments in one place.
Swap and bridge functionality — a unified DeFi experience.
In a post-FTX world, security + simplicity is the future of Web3 adoption — and De.Fi is positioning itself at that intersection.
3. Microcap with Moonshot Potential
Market cap under $3 million, fully diluted cap still under $30 million.
Token has already proven it can reach $1.00 — and even a partial recovery gives 100x potential from current prices.
Strong upside asymmetry compared to overbought majors.
4. 2025 = Altcoin Season Potential
As Bitcoin cools and liquidity rotates, microcaps historically outperform in the late-stage bull cycle. DEFI could ride this wave as attention flows from BTC to altcoins with good narratives and active dev teams.
Technical Analysis: Reversal in Progress?
All-Time Low was just 2 days ago ($0.0016).
Since then, price has jumped over 57%, showing early-stage accumulation and short-squeeze activity.
A move above $0.0030 could confirm a breakout from this capitulation bottom.
If momentum sustains, initial resistance targets are $0.006, $0.01, and $0.025 — still just a fraction of ATH.
Price Target Scenarios:
Target % Upside from $0.0026 Reasoning
$0.006 +130% Technical breakout level
$0.01 +280% Psychological + chart level
$0.10 +3,700% Mid-tier recovery, low float
$1.00 (ATH) +38,000% Full retrace (moonshot)
Final Thoughts:
DEFI is not a sure thing - it’s volatile, it’s tiny, and it was forgotten for months. But with renewed attention from major names, an actual working product in the DeFi space, and a chart that just bounced 50% off its lows, it may be gearing up for a new chapter.
If you're looking for an early-stage altcoin with real upside potential in this cycle, DEFI is one to watch.
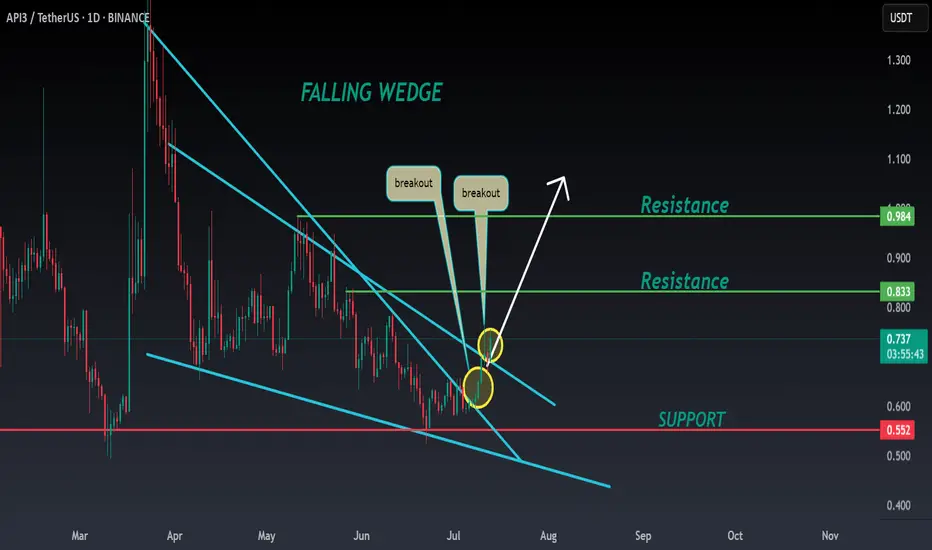
API3 ANALYSIS🚀#API3 Analysis :
🔮As we can see in the chart of #API3 that there is a formation of "Falling Wedge Pattern". In a daily timeframe #API3 broke out the pattern. Expecting a bullish move in few days if #API3 retest the levels
⚡️What to do ?
👀Keep an eye on #API3 price action. We can trade according to the chart and make some profits⚡️⚡️
#API3 #Cryptocurrency #TechnicalAnalysis #DYOR
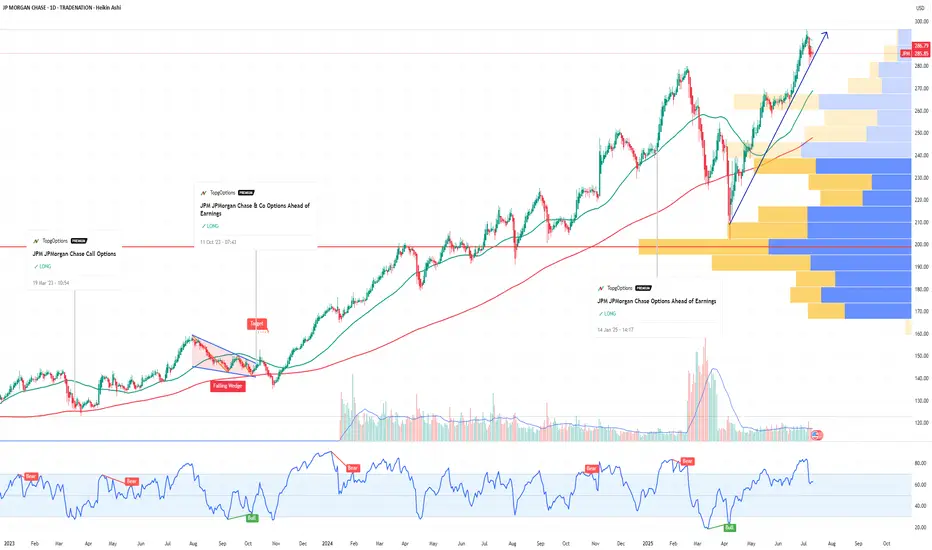
JPM JPMorgan Chase & Co Options Ahead of EarningsIf you haven`t bought JPM befor the rally:
Now analyzing the options chain and the chart patterns of JPM JPMorgan Chase & Co prior to the earnings report this week,
I would consider purchasing the 290usd strike price Calls with
an expiration date of 2026-1-16,
for a premium of approximately $20.20.
If these options prove to be profitable prior to the earnings release, I would sell at least half of them.
Disclosure: I am part of Trade Nation's Influencer program and receive a monthly fee for using their TradingView charts in my analysis.
What Are Bollinger Bands? How to use it.✅ What Are Bollinger Bands?
Bollinger Bands are a volatility-based technical analysis tool developed by John Bollinger. They consist of three lines:
1. Middle Band: 20-period Simple Moving Average (SMA)
2. Upper Band: Middle Band + 2 standard deviations
3. Lower Band: Middle Band - 2 standard deviations
The bands expand and contract based on price volatility.
📊 What Bollinger Bands Tell You
Contraction (Squeeze): Low volatility, possible breakout coming
Expansion: High volatility, breakout in progress or exhausted
Price Touches Band: Doesn’t mean reversal—it's a sign of strength or weakness
🎯 Mastering Strategies with Bollinger Bands
1. Bollinger Band Squeeze (Breakout Strategy)
Setup: Bands are very close together (low volatility)
Signal: Wait for breakout and volume spike
Action: Enter in direction of breakout
Tip: Combine with MACD or RSI for confirmation
> 🔍 Example: If the price breaks above the upper band with strong volume after a squeeze → potential long entry.
2. Mean Reversion (Reversal Strategy)
Setup: Price touches or exceeds upper/lower band
Signal: Look for RSI divergence, candlestick reversal patterns
Action: Fade the move back to the 20 SMA (mean reversion)
Tip: Works best in ranging markets
> ⚠️ Warning: Don’t short just because price touches the upper band. Look for confluence.
3. Trend Riding with Bands
Setup: Price rides upper/lower band
Signal: Pullbacks to the 20 SMA in a strong trend
Action: Enter on bounce near SMA if the trend is strong
Tip: Use higher timeframes to confirm the trend
> 🟢 In an uptrend, buy near the 20 SMA when price pulls back but doesn’t break lower band.
📌 Key Tips for Mastery
1. Adjust settings for asset/timeframe (e.g., crypto might need a 10 or 14 SMA)
2. Never use Bollinger Bands alone – combine with:
RSI (for overbought/oversold confirmation)
MACD (trend confirmation)
Volume (for breakout confirmation)
3. Use multiple timeframes – e.g., 4H for trend, 15m for entry
4. Avoid chasing band breakouts without confirmation
5. Backtest strategies with your preferred asset
🧠 Advanced Concepts
Double Bottoms Outside Band: When price forms a W-bottom with the second low outside the lower band bullish reversal setup.
Walking the Band: In strong trends, price can "walk" along the band don’t fade too early.
Band Width: Track the width of bands to detect upcoming breakouts.
⚠️ Disclaimer
This guide is for educational purposes only and does not constitute financial advice. Trading involves risk, and past performance does not guarantee future results. Always do your own research (DYOR) and consult with a financial advisor before making any investment decisions.

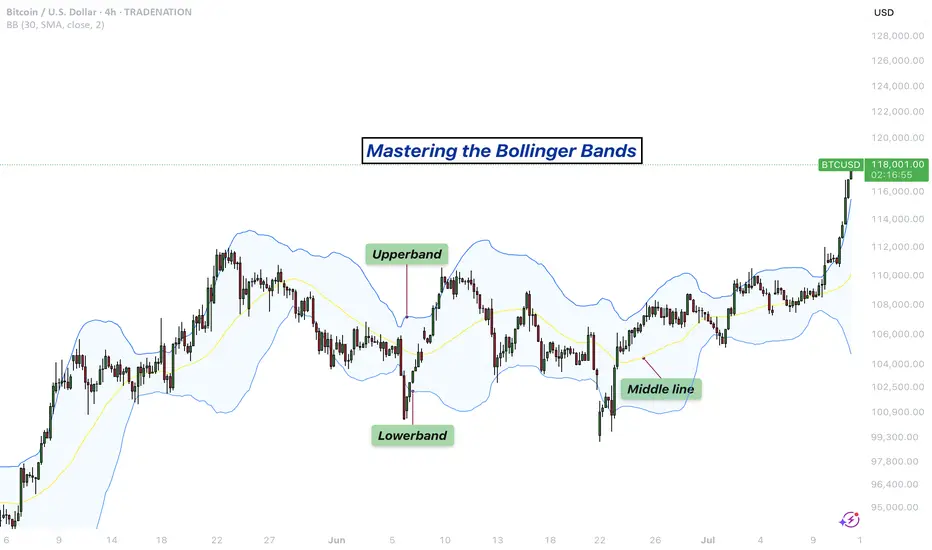
Mastering the Bollinger Bands- How to use it in trading?What is the Bollinger Bands
Bollinger Bands is a popular technical analysis tool developed by John Bollinger in the 1980s. It is designed to measure market volatility and provide signals for potential price reversals or trend continuations. The Bollinger Bands consist of three lines: a simple moving average in the middle, usually calculated over 20 periods, and two outer bands that are placed a set number of standard deviations above and below the moving average. These outer bands automatically adjust to market conditions, expanding and contracting based on price volatility. The indicator is widely used by traders to understand the relative highs and lows of a financial instrument in relation to recent price action.
What will be discussed?
- How does it work with the lower band and upper band?
- What does the narrowing mean?
- What does the widening mean?
- How to trade with the Bollingers Bands?
-------------------------
How does it work with the lower band and upper band?
The upper band and the lower band serve as dynamic levels of resistance and support. When the price of an asset touches or exceeds the upper band, it may be considered overbought, suggesting that a reversal or pullback could be near. Conversely, when the price approaches or breaks below the lower band, the asset may be viewed as oversold, indicating a potential rebound. These bands do not generate definitive buy or sell signals on their own but instead help traders assess market conditions. The interaction of price with the upper and lower bands often provides visual cues about the momentum and direction of the market, allowing for more informed decision-making.
-------------------------
What does the narrowing mean?
The narrowing of the Bollinger Bands occurs when the price becomes less volatile over time. This contraction indicates a period of consolidation or low market activity, where the price is trading in a tighter range. Narrowing bands are often interpreted as a signal that a significant price movement may be coming soon, as low volatility tends to precede high volatility. This phase is sometimes referred to as the "squeeze," and traders closely monitor it to anticipate breakout opportunities. The direction of the breakout, whether upward or downward, is not predicted by the narrowing itself but usually follows shortly after the bands have contracted.
-------------------------
What does the widening mean?
The widening of the Bollinger Bands reflects increasing market volatility. When the price starts to move rapidly either up or down, the bands spread further apart to accommodate this movement. This expansion typically confirms that a new trend is underway or that a breakout has occurred. The wider the bands become, the greater the degree of price fluctuation. During these times, traders may observe stronger momentum in the market, and the continuation of the move may be supported by the growing distance between the bands. However, extremely wide bands may also suggest that a reversal could be nearing, as the market can become overstretched in either direction.
-------------------------
How to trade with the Bollinger Bands?
Trading with Bollinger Bands involves using the bands to identify entry and exit points based on the behavior of price in relation to the upper and lower bands. One common approach is to buy when the price touches or breaks below the lower band and shows signs of bouncing back, and to sell when the price reaches or moves above the upper band and begins to retreat. Another strategy involves waiting for the bands to narrow significantly and then entering a trade in the direction of the breakout that follows. Traders often use Bollinger Bands in combination with other indicators such as RSI, MACD, or volume to confirm signals and reduce the risk of false breakouts. It is important to remember that Bollinger Bands are not predictive on their own but are most effective when used as part of a broader technical analysis framework.
-------------------------
Disclosure: I am part of Trade Nation's Influencer program and receive a monthly fee for using their TradingView charts in my analysis.
Thanks for your support.
- Make sure to follow me so you don't miss out on the next analysis!
- Drop a like and leave a comment!
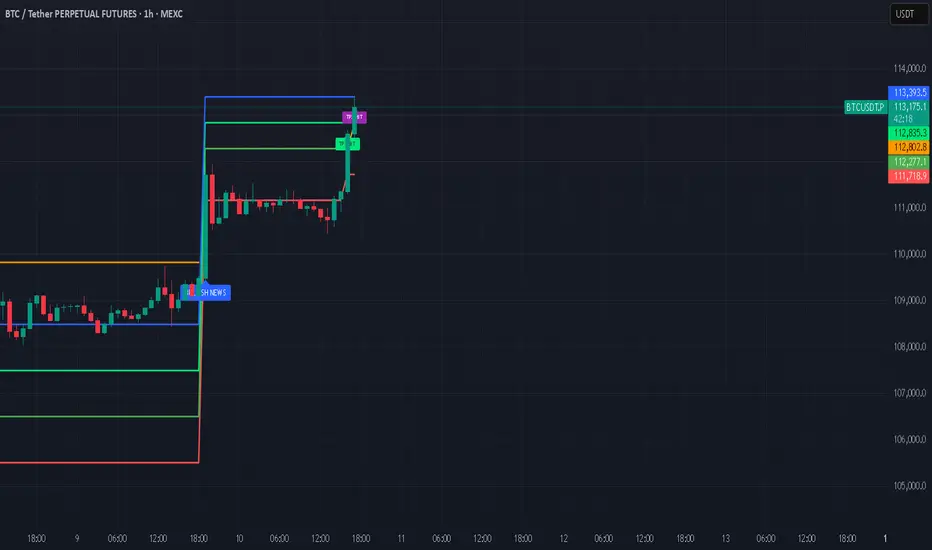
Bitcoin Breaks All-Time High: What’s Next?Bitcoin (BTC) has once again captured the world’s attention by smashing through its previous all-time high (ATH). This milestone has sparked excitement and speculation across the crypto community and beyond. But the key question remains: Will BTC continue its upward trajectory, or is a correction on the horizon?
Long-Term Outlook: The Bullish Case
In the long run, the fundamentals for Bitcoin remain strong. Several factors support a positive outlook:
Institutional Adoption: More institutional investors are entering the market, providing greater liquidity and legitimacy.
Scarcity and Halving Cycles: Bitcoin’s fixed supply and periodic halving events historically drive long-term price appreciation.
Macro Trends: Ongoing concerns about inflation and fiat currency devaluation continue to make BTC an attractive hedge.
Given these dynamics, we believe Bitcoin’s long-term trajectory remains upward.
Short-Term Caution: A Correction May Be Coming
While the long-term view is optimistic, the short-term picture may be less rosy:
Overheated Market Indicators: Rapid price surges often lead to overbought conditions, increasing the likelihood of a pullback.
Profit-Taking: After breaking ATH, some investors may lock in gains, adding selling pressure.
Technical Resistance: Historical patterns suggest that corrections often follow major breakouts.
We anticipate a potential correction, possibly pulling BTC back to the $90,000 range. This adjustment could unfold in the coming week or weeks as the market digests recent gains.
What Should Investors Do?
Stay Calm: Volatility is part of the crypto landscape. Corrections are healthy for sustainable growth.
Focus on Fundamentals: Remember why you invested in BTC in the first place.
Consider Dollar-Cost Averaging: Spreading out purchases can help mitigate the impact of short-term swings.
Conclusion
Bitcoin’s break above its all-time high is a testament to its enduring appeal and the growing confidence of investors. While a short-term correction may be likely, the long-term case for BTC remains compelling. As always, prudent risk management and a focus on fundamentals are key to navigating the exciting—and sometimes turbulent—world of crypto.
Do not consider it as investment advice.
#crypto #bitcoin #analysis
BRIEFING Week #27-28 : Distancing from US MarketsHere's your weekly update ! Brought to you each weekend with years of track-record history..
Don't forget to hit the like/follow button if you feel like this post deserves it ;)
That's the best way to support me and help pushing this content to other users.
Kindly,
Phil

How to Trade Smart Money Concepts (SMC)\ How to Trade Smart Money Concepts (SMC)\
\ This article explores the foundation, key tools, and practical insights of Smart Money Concepts — and why it’s worth your attention.\
In today's fast-changing financial landscape, Smart Money Concepts (SMC) has become a popular strategy among modern traders. But what is SMC exactly, and how can it improve your trading decisions? This article breaks it down in a simple, professional way for traders at all levels.
---
\ What Are Smart Money Concepts?\
SMC is a trading approach based on the belief that large institutions ("smart money") like banks and hedge funds control most of the market's movements. These institutions often move the market in ways that confuse or trap retail traders. The goal of SMC is to understand and follow the footsteps of these big players.
Instead of relying on simple patterns or indicators, SMC focuses on:
\ - Market structure\
\ - Supply and demand zones\
\ - Liquidity pools\
By aligning your trades with the behavior of smart money, you can position yourself more strategically in the market.
---
\ Key SMC Concepts Explained\
\ Order Blocks\
Order blocks are zones on the chart where large institutions have placed significant buy or sell orders. These zones often lead to strong price reactions and act as hidden support or resistance levels. Order blocks are considered more precise than traditional supply and demand areas.
Example: ()
\ Fair Value Gap (FVG)\
A Fair Value Gap occurs when price moves sharply in one direction, leaving a gap or imbalance in the price action. These areas often get filled later and can act as magnets for price.
In a bearish move, the FVG is the gap between the low of the previous candle and the high of the next one. In a bullish move, it's the reverse.
Example: ()
\ Timeframe Consideration\
If you can’t monitor charts during the day, avoid relying on 5–30 minute setups. Consider 4H or daily timeframes for clearer signals and more manageable trading decisions.
\ Liquidity\
Liquidity refers to price zones where lots of pending orders exist. These are usually at obvious highs, lows, or trendlines. Smart money often targets these areas to trigger stop-losses and generate movement.
One common tool to identify liquidity is a "pivot point," which is a candle with a lower low or higher high than its neighbors.
Example: ()
\ Break of Structure (BOS)\
BOS occurs when price breaks above or below a previous high or low, signaling a possible trend continuation.
Example: ()
\ Change of Character (ChoCH)\
ChoCH happens when the market changes direction. For example, if price breaks a higher low in an uptrend, it may signal a reversal.
Example: ()
Combined with BOS: ()
---
\ How SMC Compares to Wyckoff\
The idea of "smart money" isn't new. Richard D. Wyckoff, a pioneer in technical analysis, laid the foundation for understanding market cycles driven by institutions. His price cycle theory includes four phases:
\ 1. Accumulation\
Smart money buys while the public is unaware.
\ 2. Markup\
Price rises as smart money pushes the market.
\ 3. Distribution\
Smart money sells into public buying.
\ 4. Markdown\
Price falls as the cycle completes.
SMC borrows from this logic but focuses more on structure and liquidity zones. Still, the core idea is the same: understand what big players are doing, and follow them.
\ For deeper insights into Wyckoff, explore additional resources focused on accumulation/distribution cycles.\
---
\ Summary\
Smart Money Concepts give traders a deeper look into market mechanics. By focusing on order blocks, fair value gaps, liquidity, and structure breaks, SMC helps identify high-probability trade setups based on institutional behavior.
It may seem complex at first, but once you understand the basics, SMC can become a powerful tool in your trading strategy. Whether you’re new or experienced, aligning with smart money can improve your edge in the market.