LCID: Could a Saudi Buyout Send This EV Stock Back to $10?If you haven`t sold LCID before the previous earnings:
Now you need to know that Lucid Motors (LCID) is one of the most polarizing EV stocks in the market — but it’s also one of the most interesting speculative turnarounds. Yes, the company faces production challenges, cash burn, and fierce competition from Tesla, BYD, and legacy automakers. But it has some unique wildcards that most other EV startups don’t:
1) The “Musk Factor”
Musk’s public comments about Lucid being “basically controlled by the Saudis” and that they make better-looking cars than Tesla might sound like trolling, but they highlight a real truth: Lucid isn’t just another budget EV player — it’s positioned as a luxury rival with design appeal that matters to high-end buyers.
2) Saudi PIF Is Deep In — Valuation Floor
The Saudi sovereign wealth fund has put billions into LCID already — and now owns around 60%+ of the shares. They’ve made no secret of their plans to expand the kingdom’s domestic EV production and see Lucid as a flagship partner.
Rumors have swirled for years about a possible full buyout to bring Lucid fully under the PIF umbrella — or merge it with other Middle East EV initiatives like the Ceer brand. Any credible news here could double or triple the stock overnight from these depressed levels.
3) Gravity SUV & Product Pipeline
The Lucid Air remains one of the few luxury EVs that truly competes with Tesla’s Model S in both design and range. The upcoming Gravity SUV could be the next big catalyst, especially as the luxury SUV segment has fatter margins and huge global demand.
Meanwhile, the new AMP-2 factory in Saudi Arabia will help Lucid localize production, get tax incentives, and serve the Middle East and Europe more cost-effectively.
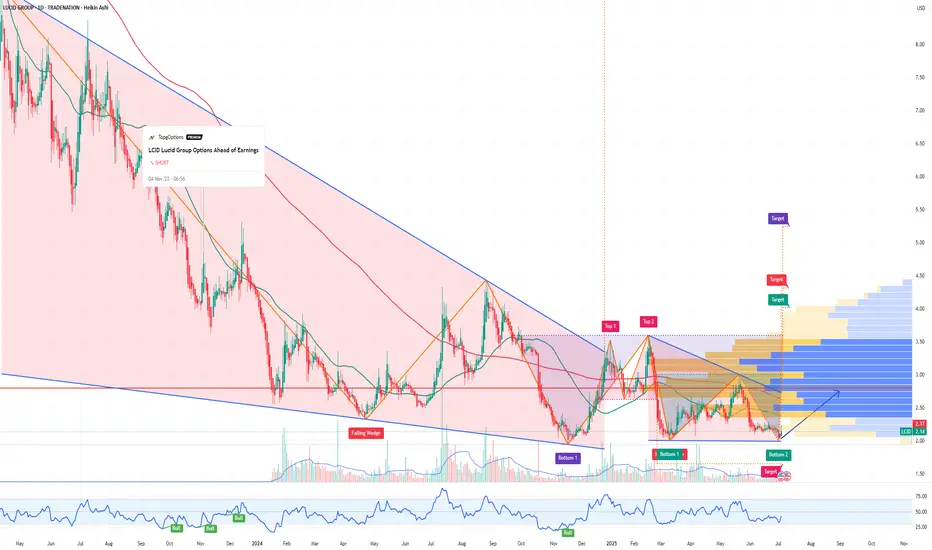
4) Technical Setup: Double Bottom Pattern
Here’s what really makes this setup tradable: LCID is showing a clear double bottom on the daily chart around the $2–$2.20 zone. The stock tested that level twice and bounced, forming a W-shaped base that can signal a reversal.
Disclosure: I am part of Trade Nation's Influencer program and receive a monthly fee for using their TradingView charts in my analysis.
Indicators
CRSP Could Crack the Holy Grails of Medicine: Cancer & AlzheimerWhen Tesla (TSLA) started, few believed a scrappy EV startup could transform the entire auto industry and ignite a green energy revolution. But it did.
Today, CRISPR Therapeutics (NASDAQ: CRSP) is quietly doing something similar for medicine — and if you squint, its upside might be even bigger than Tesla’s.
Gene Editing: The Next Industrial Revolution — For Your Cells
CRISPR/Cas9 gene editing is like biological software. It gives scientists the power to cut, delete, or rewrite genes — the source code of life — with surgical precision.
CRISPR Therapeutics was co-founded by Dr. Emmanuelle Charpentier, a Nobel Prize winner who helped pioneer this breakthrough. The company’s lead therapy, exa-cel — just FDA approved in the U.S. — is the first-ever CRISPR-based gene-editing treatment to hit the market.
First up: curing devastating blood disorders like sickle cell disease and beta-thalassemia — a $10 billion+ opportunity. But that’s only the start.
Aging: The Ultimate Disease
What if we treated aging itself as a disease?
Many scientists now argue that growing old is the result of accumulated genetic errors, cellular damage, and mutations — processes that can be slowed or even reversed.
Gene editing holds the promise to repair DNA damage, reprogram cells, and treat the root causes of age-related decline. If successful, it could extend healthy human lifespan by decades.
Think about that: Tesla made cars last longer and burn cleaner. CRSP could make you last longer and live healthier.
The Two Holy Grails: Cancer and Alzheimer’s
Beyond blood disorders, CRISPR Therapeutics is working on a pipeline targeting solid tumors, diabetes, and more. But the real game-changers are cancer and Alzheimer’s disease — the twin mountains every biotech company dreams of conquering.
With gene editing, we could one day rewrite the genetic mutations that fuel cancer growth or remove the faulty proteins that clog the brain in Alzheimer’s. These are trillion-dollar problems — and the company that cracks them will reshape human history.
Built for Scale — Like Tesla
CRSP isn’t going at it alone. Partnerships with Vertex, Bayer, and ViaCyte help spread risk and amplify impact. With over $2 billion in cash, it has the runway to execute — just as Tesla used capital to build factories and charging networks at scale.
The market still underestimates that this is a platform company — not a single-drug biotech. If Tesla went from cars to batteries, solar, and AI, CRSP could go from blood disorders to rewriting the code for life itself.
Bottom Line
Aging. Cancer. Alzheimer’s. These are the holy grails of medicine.
If you missed Tesla at $20 a share, CRISPR Therapeutics could be your second chance — the TSLA of Gene Editing.
Because the greatest disruption of all is not electric cars. It’s the chance that, one day, growing old will be optional.
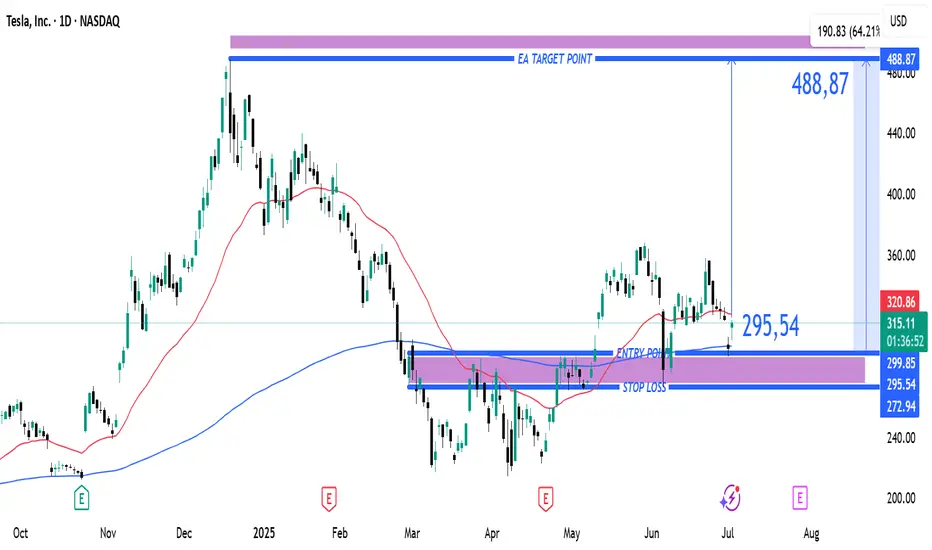
Tesla Bullish Breakout Setup: Entry at $295.54 Targeting $488.87Entry Point (Buy Zone): Around $295.54
Stop Loss: Between $272.94 – $295.54 (lower purple support zone)
Target (TP): $488.87
Current Price: $315.33 (as of the latest candle)
📈 Strategy Summary:
Setup Type: Long (Buy)
Risk-Reward Setup:
Reward: ~$193.33 per share (from $295.54 to $488.87)
Risk: ~$22.60 per share (from $295.54 to $272.94)
Reward:Risk Ratio ≈ 8.6:1 — a high potential payoff if the trade works out.
📊 Technical Context:
Support Zone: Price recently bounced off the support region (marked in purple).
Moving Averages:
Red Line (Short-Term MA): Price just crossed back above.
Blue Line (Long-Term MA): Price reclaimed this level — bullish signal.
Price Action: After a corrective phase, a possible reversal is forming at support, confirming bullish interest.
✅ Bullish Signals:
Bounce from support zone with a strong bullish candle.
Price closing above the 200-day MA (bullish trend resumption).
High reward-to-risk trade setup with clear stop loss.
⚠️ Considerations:
Confirmation with volume or a second bullish candle would add confidence.
Watch for earnings or macro events that could disrupt the trend.
Tight stop is essential to avoid drawdowns if the setup fails.
🔚 Conclusion
This is a well-structured long setup with a high potential reward. If price maintains above the entry zone and breaks recent highs, a push toward the $488.87 target is plausible.
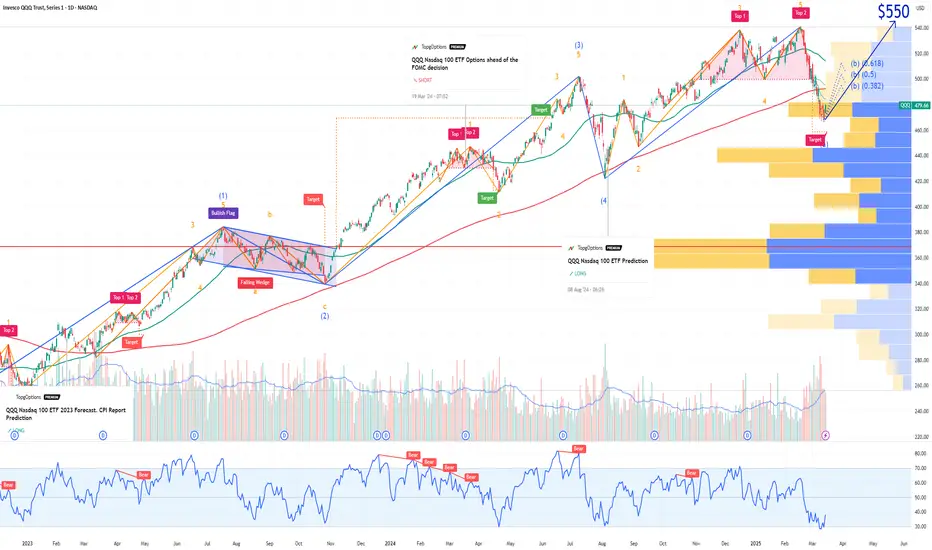
QQQ Nasdaq 100 Year-End Price Target and Technical Rebound SetupIf you haven`t bought the previous oversold area on QQQ:
Now the Nasdaq-100 ETF (QQQ), which tracks the performance of the largest non-financial companies in the Nasdaq, has recently entered oversold territory, suggesting that a technical rebound may be imminent. Similar to the Russell 2000, QQQ has experienced significant selling pressure, driving key technical indicators into oversold zones and creating favorable conditions for a bounce.
The Relative Strength Index (RSI) has dropped below 30, a level that typically signals oversold conditions and the potential for a reversal. Additionally, QQQ is trading near key support levels, with a large portion of its components underperforming their 50-day and 200-day moving averages — a classic setup for a mean reversion rally.
From a historical perspective, QQQ has shown a tendency to rebound strongly after similar oversold conditions, particularly when macroeconomic factors stabilize and buying pressure returns. Given the current technical setup, my price target for QQQ is $550 by the end of the year. This represents a recovery of approximately 8-10% from current levels, aligning with previous post-oversold rallies in the index.
While downside risks remain — including potential volatility around Federal Reserve policy and broader economic data — the technical backdrop suggests that QQQ is well-positioned for a recovery in the coming months.
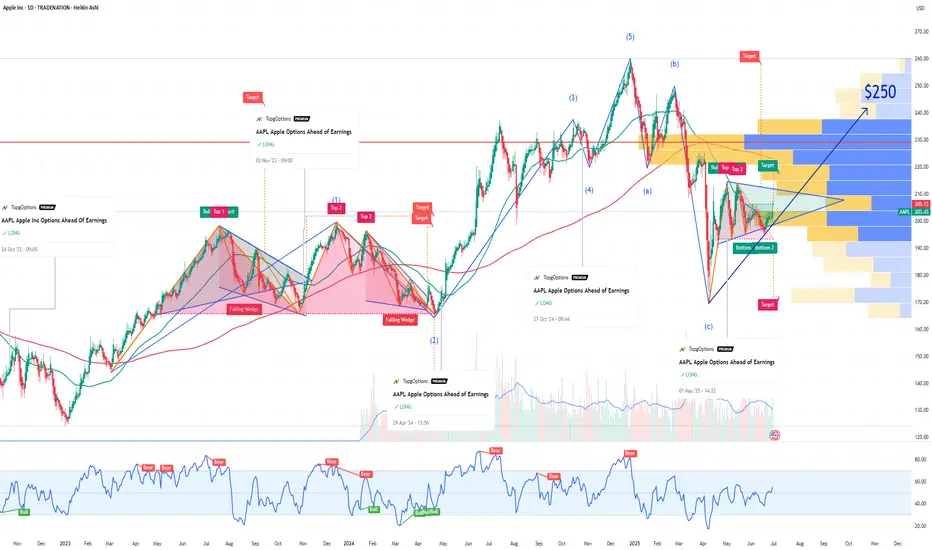
AAPL Poised for Continued GrowthIf you haven`t bought AAPL before the rally:
What to consider now:
1. AI-Driven iPhone Upgrade CycleApple’s integration of Apple Intelligence, its proprietary AI platform, is set to catalyze a significant iPhone replacement cycle. Posts on X highlight positive sentiment around AI-driven demand, with estimates suggesting a 40% year-over-year surge in iPhone shipments in China during May 2024, signaling strong consumer interest. New AI features, such as on-device processing for enhanced privacy and functionality, are expected to drive accelerated hardware upgrades. Analysts, including Bernstein, project these features could boost upgrade rates, with even a 1% increase in upgrades driving meaningful revenue growth. With the iPhone 15 and future iterations leveraging AI, Apple is likely to capture pent-up demand, as noted by industry observers who see long-term revenue growth from its 7% year-over-year increase in active installed base.
2. Strong Ecosystem and Services GrowthApple’s ecosystem—spanning iPhones, iPads, Macs, and wearables—continues to drive customer loyalty and recurring revenue. The company reported record services growth in Q2 2025, with revenue reaching $95.4 billion, up 5% year-over-year. Services like Apple Music, iCloud, and Apple TV+ benefit from the growing active device base, which ensures sticky, high-margin revenue streams. This ecosystem strength mitigates concerns about short-term iPhone sales fluctuations, as Apple captures upgrade revenue over time. The seamless integration of hardware and services creates a moat that competitors struggle to replicate, reinforcing AAPL’s long-term growth potential.
3. Technical Bullish MomentumFrom a technical perspective, AAPL exhibits strong bullish patterns across multiple timeframes. TradingView analyses point to a rising bullish channel, with higher highs and higher lows signaling sustained upward momentum. Key bullish patterns, such as an ascending wedge and triangle, are forming around current price levels, suggesting potential breakouts. For instance, if AAPL clears $203.21 with volume, it could target $204.98 or higher, with some analyses eyeing $240 as a near-term resistance. Technical indicators like a rising RSI and MACD convergence further support short-term bullish momentum. Despite recent consolidation, reduced volatility and a strong setup pattern indicate AAPL is primed for a breakout.
4. Analyst Optimism and Market SentimentAnalyst sentiment remains overwhelmingly positive, with a consensus “Buy” rating and a 12-month price target of $228.85, implying a 14.05% upside from the current price of $200.66 as of June 2025. Hedge funds like Third Point see “significant” upside, driven by AI features that could meaningfully boost earnings. Bernstein’s raised price target to $240 reflects confidence in Apple’s ability to monetize AI through hardware and services. Posts on X also highlight investor optimism, with AAPL’s $350 billion market cap increase in a single day underscoring strong market confidence in its AI-driven growth chapter.
5. Global Expansion and Emerging MarketsApple’s growth in emerging markets, particularly India and China, bolsters its bullish case. Improved guidance for December 2023, driven by iPhone 15 adoption and India’s market potential, signals untapped opportunities. Apple’s ability to penetrate these high-growth regions, combined with its premium brand appeal, positions it to capture a larger share of global smartphone and tech markets.
Disclosure: I am part of Trade Nation's Influencer program and receive a monthly fee for using their TradingView charts in my analysis.
BRIEFING Week #26 : Are we going for a Bubble ?Here's your weekly update ! Brought to you each weekend with years of track-record history..
Don't forget to hit the like/follow button if you feel like this post deserves it ;)
That's the best way to support me and help pushing this content to other users.
Kindly,
Phil

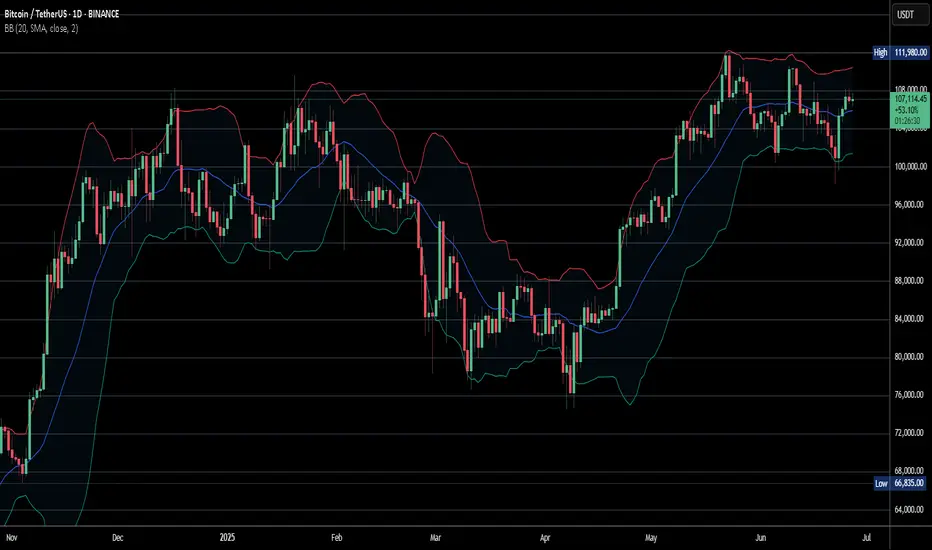
Sharing the advanced Bollinger Bands strategyHere are the Bollinger Band trading tips: *
📌 If you break above the upper band and then drop back down through it, confirm a short signal!
📌 If you drop below the lower band and then move back up through it, confirm a long signal!
📌 If you continue to drop below the middle band, add to your short position; if you break above the middle band, add to your long position!
Pretty straightforward, right? This means you won’t be waiting for the middle band to signal before acting; you’ll be ahead of the game, capturing market turning points!
Let’s break it down with some examples:
1. When Bitcoin breaks above the upper Bollinger Band, it looks strong, but quickly drops back below:
➡️ That’s a “bull trap”—time to go short!
2. If Bitcoin crashes below the lower band and then pops back up:
➡️ Bears are running out of steam—time to go long and grab that rebound!
3. If the price keeps moving above the middle band:
➡️ Add to your long or short positions to ride the trend without being greedy or hesitant.
Why is this method powerful?
It combines “edge recognition + trend confirmation” for double protection:
1. Edge Recognition—spot the turning point and act early.
2. Trend Confirmation—wait for the middle band breakout and then confidently add positions!
You won’t be reacting after the fact; you’ll be ahead of the curve, increasing your positions in the trend’s middle and locking in profits at the end. This is the rhythm of professional traders and the core logic of systematic profits!
Who is this method for?
- You want precise entry and exit points.
- You’re tired of “chasing highs and cutting losses.”
- You want a clear, executable trading system.
- You want to go from “I see the chart but don’t act” to “I see the signal and take action.”
Follow for more. Make sure to like this if you found it useful.
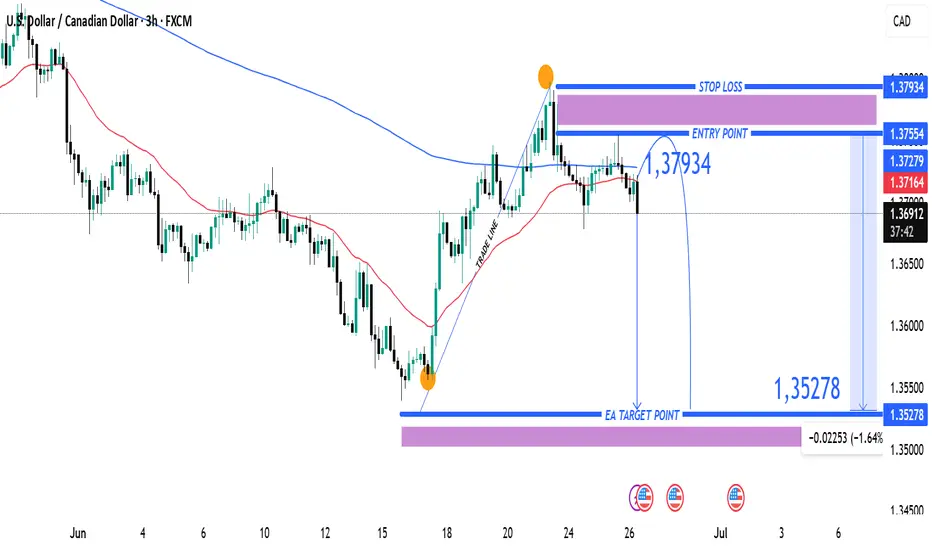
USDCAD Bearish Reversal Trade Setup – 3H Chart Analysis (June 26 Entry Zone: 1.37279 – 1.37554
🔹 Stop Loss: 1.37934
🔹 Target: 1.35278
🔹 Risk-to-Reward (RR): ~1:2.5
🧠 Technical Breakdown
Trend Overview:
Overall trend shows a downtrend from earlier June, followed by a corrective bullish move.
Price failed to sustain above the 200 EMA (blue line), indicating continued bearish pressure.
Trade Line Break:
A steep bullish trendline was broken, signaling a potential trend reversal or deeper pullback.
Bearish Rejection Zone:
The purple zone (1.37279 – 1.37554) acted as resistance.
Price formed a lower high and rejected this zone, confirming selling interest.
Entry Strategy:
Short entry is ideally within or just below the rejection zone.
Aggressive entry already in play at current market price (1.36909) after confirmation.
Target Zone:
Projected towards 1.35278, aligning with previous support and fib retracement zone.
Large purple support zone near the target suggests a potential reversal area.
⚠️ Risk Notes
Be cautious of USD volatility due to upcoming economic events (noted with icons on the chart).
Stop loss above previous swing high minimizes risk of fakeouts.
✅ Summary:
This is a bearish swing setup aiming for a significant drop toward 1.35278. The clean rejection from resistance and trendline break supports a high-probability short opportunity with favorable risk-reward.
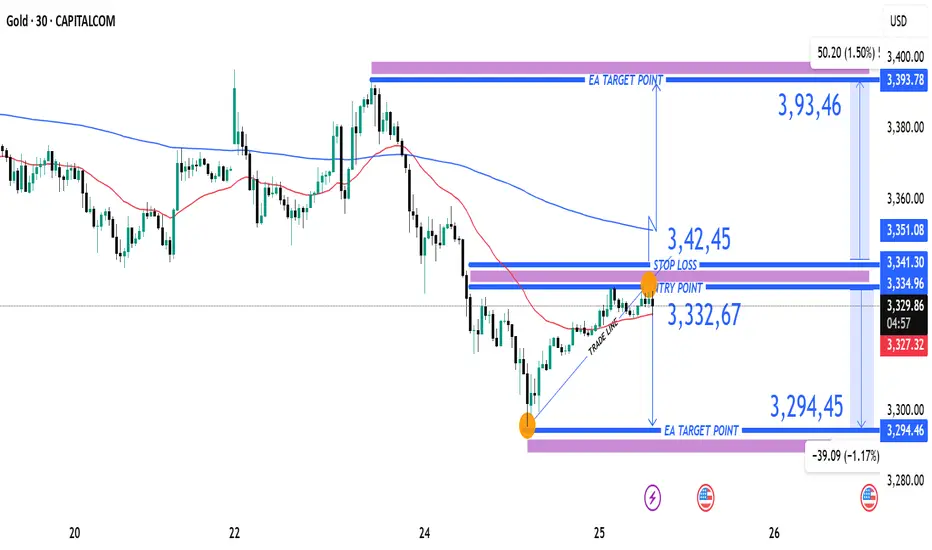
XAUUAD Reversal Setup Short Trade Opportunity Below Resistance Current Price: 3,327.56 USD
Entry Point: 3,332.67 USD
Stop Loss: 3,342.45 USD
Take Profit Levels:
Target 1 (Downside): 3,294.45 USD (-1.17%)
Target 2 (Upside): 3,393.78 USD (+1.50%)
🔧 Technical Indicators & Tools
Trade Line: Upward sloping trendline connecting higher lows, supporting recent bullish structure.
Moving Averages:
Red: Short-term (likely 50-period EMA)
Blue: Long-term (likely 200-period EMA)
Price is still trading below the long-term MA, suggesting broader bearish pressure.
Resistance Zone: 3,334.96–3,341.30 — a key supply area marked in purple.
Support Zone: 3,294.45 — identified as a previous demand level.
⚖️ Risk-Reward Analysis
Short Setup:
Entry: 3,332.67
Stop Loss: 3,342.45 (Risk ~10 USD)
Target: 3,294.45 (Reward ~38 USD)
R:R Ratio ≈ 1:3.8, which is favorable for a short trade.
📌 Summary
Bias: Bearish intraday
Setup Type: Short-sell at resistance zone
Confirmation: Price rejection or bearish candle near 3,334–3,342 zone
Invalidation: Break and close above 3,351.06 (upper resistance)
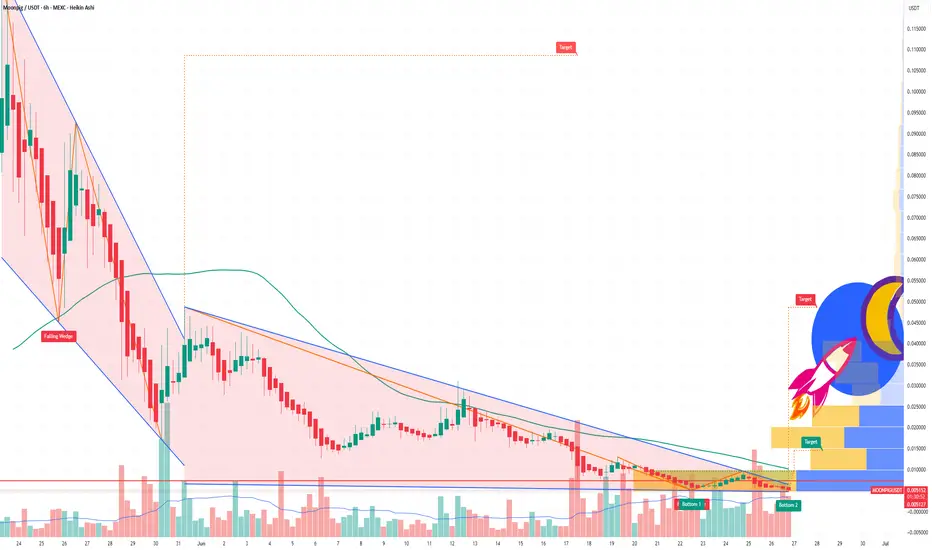
MOONPIG - Solana Meme Coin Ready to Rocket in the Next Bull RunTechnical Analysis: Bullish Signals Flashing Bright:
The MOONPIG/USDT chart is painting a bullish picture. After a sharp retracement from its all-time high near a $125M market cap, the token has found solid support around $0.0045 and is now trading at $0.0052, showing signs of a reversal. Here’s what the charts tell us:
Breakout Momentum: On the 6-hour chart, $MOONPIG recently broke above a key downtrend line, signaling a shift from bearish to bullish momentum. A potential double bottom pattern suggests a continuation toward $0.008 or higher.
Support and Resistance: The $0.0045 level has held as strong support, with resistance looming near $0.0075 (a recent high). A clean break above $0.0075 could open the door to $0.01 or beyond, aligning with the 1.618 Fibonacci extension from the recent swing low.
With Bitcoin rallying and altcoins showing signs of life, $MOONPIG’s technical setup screams opportunity for traders eyeing a breakout.
Fundamentals:
Community Power: With over 18,000 holders as of early June 2025, $MOONPIG boasts a fiercely loyal community. Unlike many meme coins reliant on paid shills, its growth is organic, driven by retail investors who love its “normie-friendly” branding. Posts on X highlight strong morale, with users like JamesWynnReal calling it a “raging bull flag” poised for a $50M–$100M market cap.
Exchange Listings: Recent listings on HTX Global, MEXC, and LBank have boosted liquidity and visibility, with more exchanges reportedly in talks. These listings are a catalyst for retail FOMO, as seen in the $7M+ on-chain trading volume.
Solana’s Hot Streak: Solana’s fast, low-cost blockchain is the perfect home for meme coins like $MOONPIG. With Solana’s ecosystem thriving and retail interest in tokens like $POPCAT and SEED_WANDERIN_JIMZIP900:WIF soaring, $MOONPIG is well-positioned to ride the wave of altseason capital inflows.
Market Timing: As Bitcoin nears new highs and market sentiment turns bullish, low-cap meme coins historically see explosive gains.
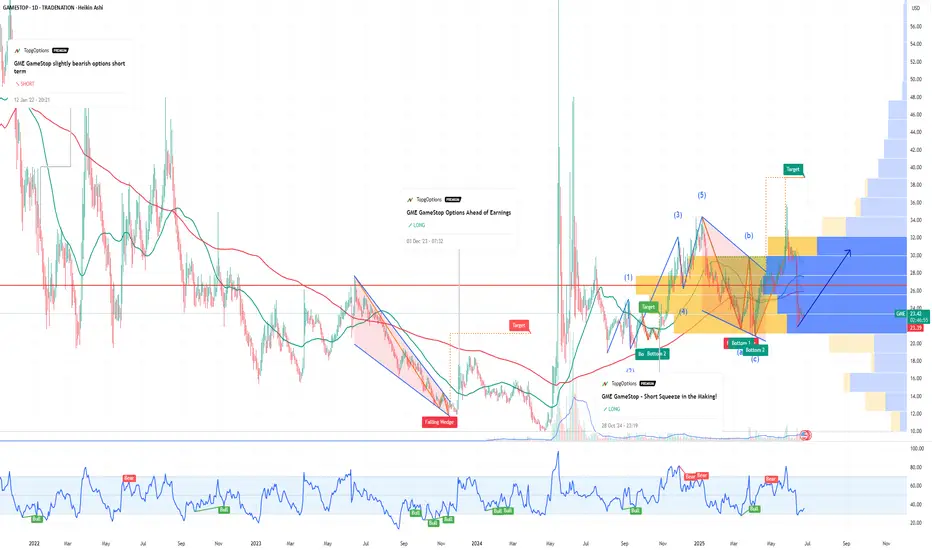
GME GameStop - A Crypto Proxy with Surprise UpsideIf you haven`t bought GME before the previous rally:
Why GME Could Rally by Year-End 2025:
1. Hidden Bitcoin Exposure
GameStop recently revealed it holds a significant amount of Bitcoin on its balance sheet — quietly positioning itself as a crypto proxy in the equity markets.
While not a traditional miner or crypto company, GME gives exposure to BTC upside without being a pure-play crypto stock.
With Bitcoin aiming for new highs in 2025, any company with BTC on its books becomes more valuable — just as we saw with Tesla and MicroStrategy in prior cycles.
2. Retail Speculation and Meme Momentum
GME has always been a retail-fueled stock, and retail interest is surging again in crypto and meme trades.
As crypto enters a new speculative phase, GME could benefit from a reflexive feedback loop: BTC goes up → GME gains attention → more retail FOMO → GME rises.
Recent reappearance of figures like Roaring Kitty has reignited interest — and if crypto sentiment stays hot, GME could ride that wave.
3. Lean Balance Sheet and Optionality
After multiple share offerings, GameStop is flush with cash and minimal debt — giving it financial flexibility.
Holding BTC enhances its treasury strategy during inflationary or weak-dollar cycles.
This also gives it optionality to enter Web3, NFTs (again), or even blockchain gaming — areas where its brand could carry weight.
Technical Setup
GME is consolidating above key support in the $20–23 zone, forming a potential bull flag or base for another breakout.
Any breakout in Bitcoin or renewed meme-stock energy could push GME to test $35–40, or even $50+ if momentum returns.
Final Thoughts
GME may not be a traditional crypto stock, but it’s now quietly tied to Bitcoin performance. With crypto heating up and retail risk appetite returning, GameStop becomes a speculative bet on BTC, memes, and volatility — all in one ticker.
Disclosure: I am part of Trade Nation's Influencer program and receive a monthly fee for using their TradingView charts in my analysis.
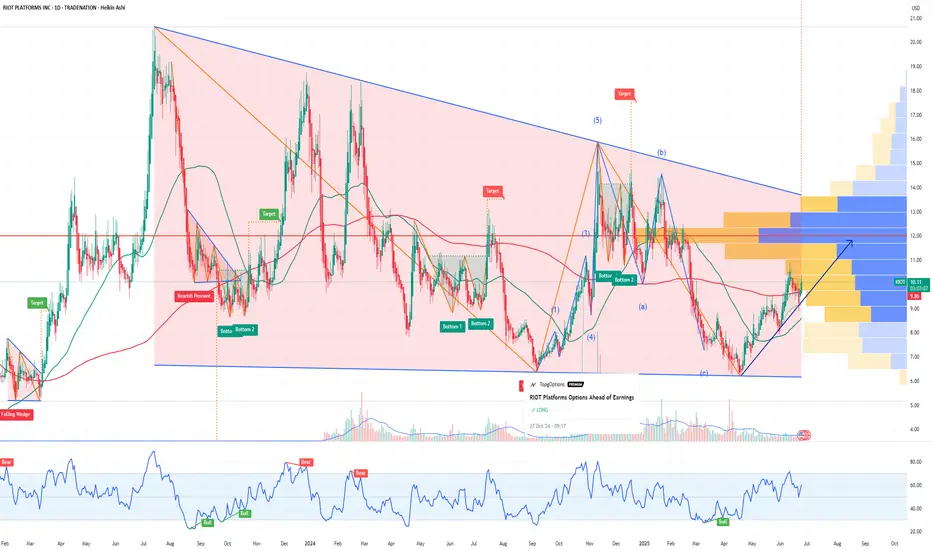
RIOT Stock: Leveraged Bet on Bitcoin’s Next Leg UpMy Bullish Thesis:
1. Leverage to Bitcoin Without Holding BTC
RIOT is one of the largest publicly traded Bitcoin miners in the U.S., offering investors exposure to the upside of Bitcoin — without directly owning the coin.
If Bitcoin goes to $100K or higher, miner stocks like RIOT historically outperform BTC in percentage terms.
This makes RIOT a high-beta play on the ongoing crypto bull market.
2. Post-Halving Upside
The April 2024 Bitcoin halving cut block rewards by 50%, which squeezes less-efficient miners — but RIOT benefits from:
Low-cost mining operations due to cheap electricity agreements in Texas.
Recent upgrades in hardware efficiency (with high-performance ASICs).
Greater share of the network hash rate as weaker players drop out.
Historically, Bitcoin and miners perform best in the 6–18 months after a halving, positioning RIOT for strong gains through year-end 2025.
3. Massive Infrastructure and Expansion
RIOT owns a 400+ megawatt mining facility in Texas, one of the largest in North America.
They’re expanding capacity and have locked in long-term energy deals that give them a key advantage during spikes in energy costs.
The company also earns revenue through demand response credits, essentially being paid to shut down power usage during Texas grid stress — a unique hedge for a miner.
4. Regulatory Edge Over Offshore Miners
As U.S.-based and NASDAQ-listed, RIOT is better positioned than foreign or unregulated competitors if/when the U.S. passes legislation around digital assets and mining.
This could lead to greater institutional adoption of RIOT versus other miners.
It’s also eligible for ETF inclusion or institutional funds focused on digital infrastructure or U.S. innovation.
RIOT is a classic “picks and shovels” play on the Bitcoin bull run — offering levered upside without having to buy BTC directly. With post-halving tailwinds, institutional favorability, and a strong technical breakout in progress, RIOT may be one of the top speculative growth plays in the crypto equity space heading into the second half of 2025.
Disclosure: I am part of Trade Nation's Influencer program and receive a monthly fee for using their TradingView charts in my analysis.
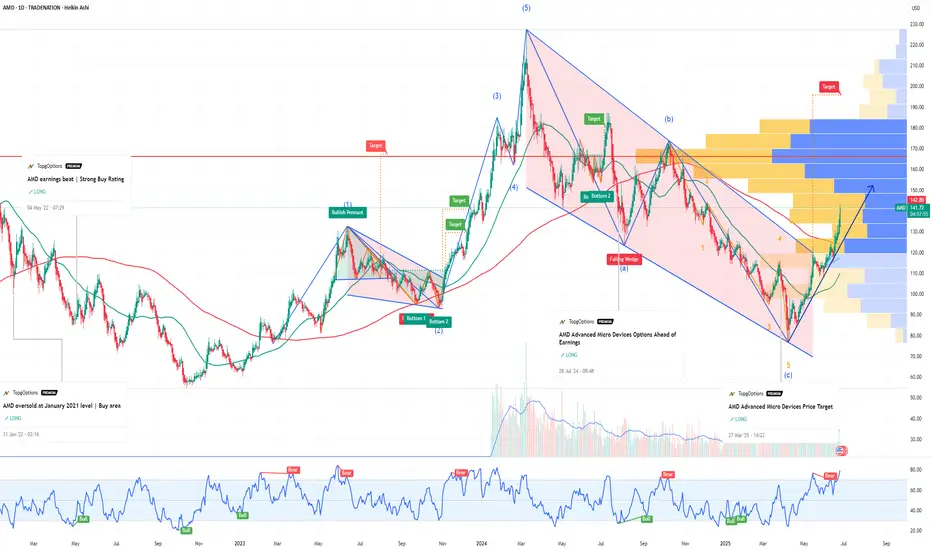
Bullish Thesis: Why AMD Stock Could Soar by Year-End 2025If you haven`t bought AMD before the previous rally:
What to consider now:
1. AI Tailwinds Are Accelerating
AMD is finally gaining serious traction in the AI GPU race. Its MI300X accelerator chips are being adopted by big names like Microsoft, Meta, and Oracle for data center AI workloads. While NVIDIA is still dominant, AMD is expected to grab 10–20% of the AI GPU market share by 2025, according to industry estimates. That’s a multibillion-dollar opportunity.
The MI300X already passed $1B in revenue within its first quarters.
AI server TAM (total addressable market) is expected to grow to $400B by 2027 — AMD is positioning itself aggressively to carve out its slice.
2. Valuation Looks Reasonable vs Peers
AMD trades at a forward P/E around 40, significantly below Nvidia (which trades over 60x) despite similar growth projections for the next 2 years.
Revenue expected to grow over 15–20% YoY in 2025.
Gross margins expanding as high-performance chips dominate the mix.
3. Diversified Growth: Beyond AI
Gaming segment (PlayStation 5 and Xbox Series X chips) remains strong.
Embedded segment from Xilinx acquisition continues to generate solid cash flow.
Client CPU business is rebounding as the PC market stabilizes.
4. Strong Management and Execution
CEO Lisa Su is widely respected for turning AMD around and guiding the company through major innovations and acquisitions (Xilinx, Pensando). Execution has remained consistent, especially in delivering cutting-edge performance-per-watt chips.
Disclosure: I am part of Trade Nation's Influencer program and receive a monthly fee for using their TradingView charts in my analysis.
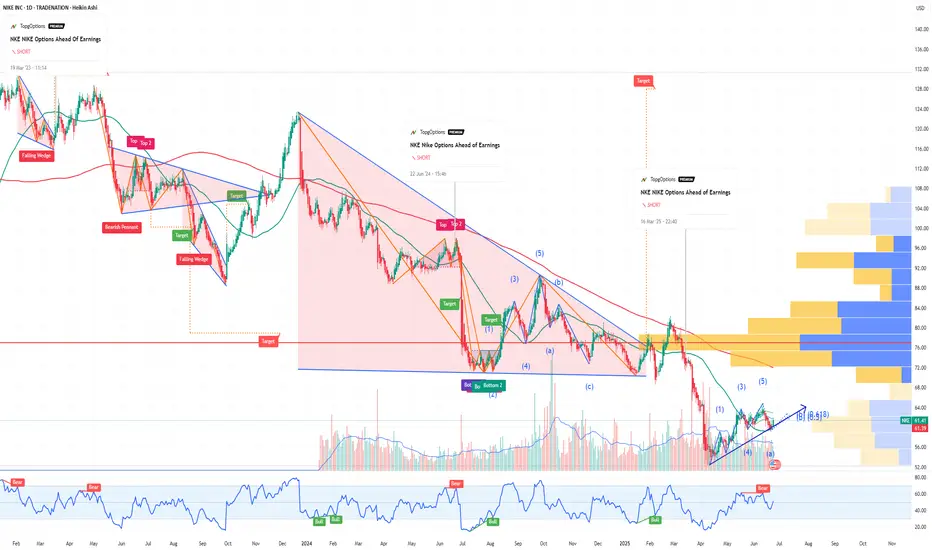
NKE NIKE Options Ahead of EarningsIf you haven`t sold NKE before the previous earnings:
Now analyzing the options chain and the chart patterns of NKE NIKE prior to the earnings report this week,
I would consider purchasing the 62usd strike price Calls with
an expiration date of 2025-7-3,
for a premium of approximately $2.29.
If these options prove to be profitable prior to the earnings release, I would sell at least half of them.
Disclosure: I am part of Trade Nation's Influencer program and receive a monthly fee for using their TradingView charts in my analysis.
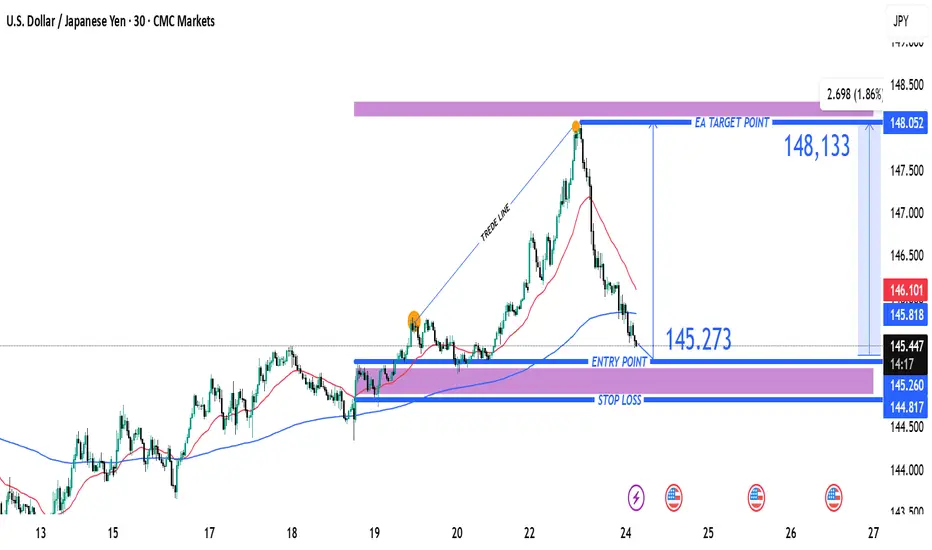
USD/JPY Bullish Reversal Trade Setup – Key Support Test at 145.2Entry Point: 145.273 (highlighted in blue)
Stop Loss: ~144.817–145.260 (purple zone)
Target Point (TP): 148.133 (upper resistance zone)
📉 Recent Price Action:
Price peaked near 148.05 before reversing sharply and breaking the trendline.
The market is currently testing the support zone (near the 145.273 entry level).
Moving averages (red = short-term, blue = long-term) show a crossover to the downside, suggesting short-term bearish momentum.
📈 Trade Setup:
Strategy Type: Long (Buy) Setup
Risk/Reward: Favorable, approximately 1:2+
Entry Zone: The current price is close to the entry level at 145.273, making this a timely area to watch for a bounce or confirmation.
⚠️ Risk Factors:
If price breaks below 144.817, the setup becomes invalid.
Short-term momentum is still bearish; confirmation (like a bullish engulfing candle or support hold) is important before entering.
✅ Confirmation Triggers for Entry:
Strong bullish candlestick pattern near entry zone.
RSI or MACD bullish divergence (not shown but useful to check).
Volume spike on bounce from support.
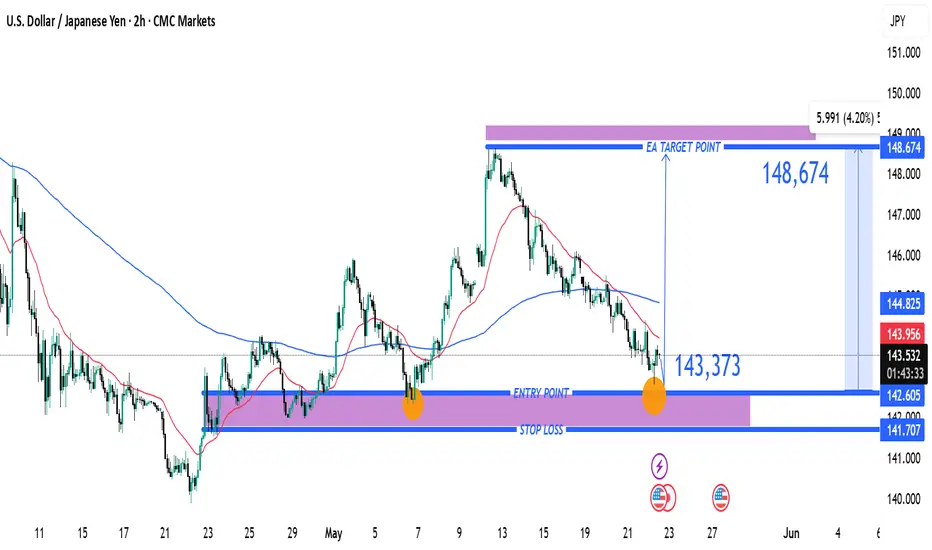
USD/JPY Long Trade Setup – Key Support Rebound Targeting 148.674Entry Point:
Price: 143.373
The chart suggests initiating a long (buy) position at this level, which is just slightly below the current market price.
Stop Loss:
Price: 141.707
Positioned below a strong support zone. This level protects the trade from excessive downside risk if the price breaks down.
Target Point:
Price: 148.674
The target is clearly defined, indicating a potential gain of approximately 5.991 points, or 4.20% from the entry.
🟪 Support/Resistance Zones
The purple boxes indicate demand (support) and supply (resistance) zones.
The lower zone (entry/stop area) shows a historically significant support range that has been tested multiple times (indicated with orange circles).
The upper purple zone marks the take-profit area, which coincides with previous resistance.
📊 Moving Averages
Blue Line: 200 EMA (Exponential Moving Average) – acting as dynamic resistance.
Red Line: 50 EMA – price is currently trading below it, indicating bearish short-term pressure but potential for reversal.
🧠 Trade Idea Summary
Bias: Bullish (long position)
Risk-Reward Ratio: Favorable
Risk: ~1.67 points (from 143.373 to 141.707)
Reward: ~5.3 points (from 143.373 to 148.674)
Approx. R:R = 1:3.17
Validation: The setup relies on the price holding the key support zone and bouncing higher, targeting the next major resistance.
⚠️ Considerations
Monitor for bullish candlestick patterns near the entry zone.
Keep an eye on macroeconomic news (like BoJ or Fed updates) that could cause volatility in USD/JPY.
Confirm momentum shift with RSI or MACD if using indicators.
BRIEFING Week #25 : Heading into Summer ModeHere's your weekly update ! Brought to you each weekend with years of track-record history..
Don't forget to hit the like/follow button if you feel like this post deserves it ;)
That's the best way to support me and help pushing this content to other users.
Kindly,
Phil

Bitcoin Strategic Interval, CME Dislocation and Macro Friction.⊢
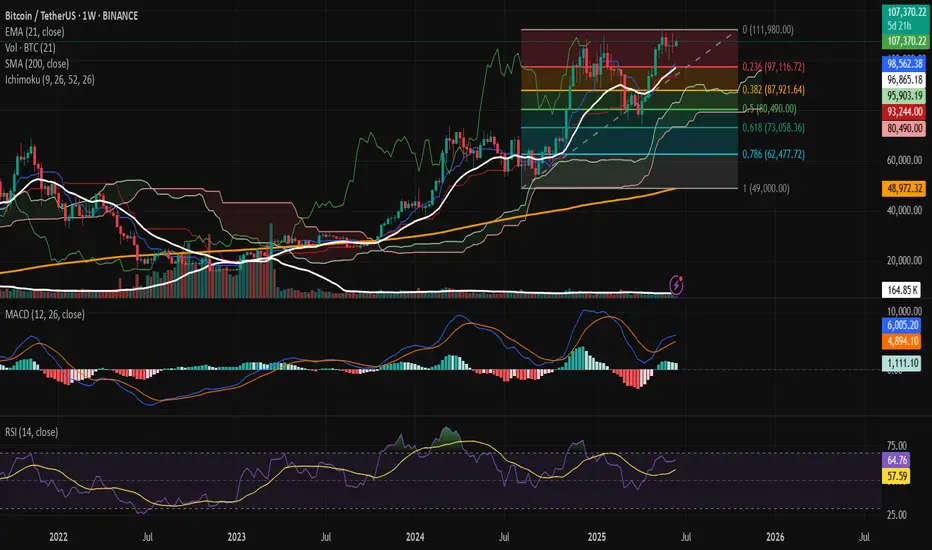
𝟙⟠ - BTC/USDT - Binance - (CHART: 1W) - (June 17, 2025).
⟐ Analysis Price: $106,851.31.
⊢
I. ⨀ Temporal Axis – Strategic Interval - (1W):
▦ EMA21 – ($96,818.00):
∴ The current candle closes +10.3% above the EMA21, maintaining bullish dominance over the mid-term dynamic average;
∴ This is the 17th consecutive weekly candle closing above the EMA21 since its reclaim in February 2025, forming a structurally intact uptrend;
∴ No violation or wick-close below the EMA21 has occurred since April, and the distance from price to EMA21 remains within a standard deviation of mid-trend movement.
✴ Conclusion: The trend is active and preserved. EMA21 acts as dynamic support and bullish pressure zone. A reversion would only be expected if weekly closes return below $98K with volume confirmation.
⊢
▦ SMA200 – ($48,969.73):
∴ The 200-week simple moving average remains untouched since early 2023, never tested during the current cycle;
∴ The slope of the SMA200 is positive and gradually increasing, indicating a long-term structural trend recovery;
∴ Price stands +118% above the SMA200, a level historically associated with mid-cycle rallies or overheated continuation phases.
✴ Conclusion: The SMA200 confirms long-term bullish structure. Its current distance from price makes it irrelevant for immediate action but critical as the absolute invalidation level of the macro trend.
⊢
▦ Ichimoku – Kumo | Tenkan | Kijun:
∴ Price is above the Kumo cloud, with Span A ($107,172.16) and Span B ($98,562.38) creating a bullish tunnel of support;
∴ The Kijun-sen rests at $95,903.19, slightly below EMA21, and aligns with the last strong horizontal range;
∴ Chikou Span is free from historical candles, confirming trend continuity under Ichimoku principles.
✴ Conclusion: All Ichimoku components are aligned bullish. Pullbacks to the Kijun around $96K would be healthy within a macro-uptrend, and only sub-cloud closes would question this formation.
⊢
▦ Fibonacci - (Swing Low $49,000 – High $111,980):
∴ Bitcoin remains between the (0.236 Fibo - $97,116.72) and local top at $111,980, showing respect for fib-based resistance;
∴ The (0.5 Fibo - $80,490.00) has not been retested since March, confirming the range compression toward upper quadrants;
∴ Weekly price is consolidating under fib extension with decreasing body size, suggesting strength with pause.
✴ Conclusion: The Fibonacci structure confirms bullish extension phase. If $97K breaks, retracement to (0.382 Fibo - $87,921.64) is expected. Otherwise, the breakout above $112K enters full projection territory.
⊢
▦ MACD – (Values: 1,077.98 | 5,963.81 | 4,885.82):
∴ MACD line remains above signal line for the third consecutive week, recovering from a prior bearish cross in April;
∴ The histogram has printed higher bars for four weeks, but the slope of growth is decelerating;
∴ Positive cross occurred just below the zero-line, which often results in delayed reactions or failures unless reinforced by volume.
✴ Conclusion: MACD signals a weak but persistent momentum recovery. Reaffirmation depends on histogram expansion above 1,500+ and signal spread widening.
⊢
▦ RSI – (Close: 64.37 | MA: 57.56):
∴ The RSI is in the bullish upper quadrant, but without overbought extension, suggesting active buying without euphoria;
∴ The RSI has been above its moving average since mid-May, maintaining a healthy angle;
∴ Momentum is not diverging from price yet, but is approaching the 70 zone, historically a point of hesitation.
✴ Conclusion: RSI confirms controlled strength. Further advance without consolidation may trigger premature profit-taking. Above 70, caution increases without being bearish.
⊢
▦ Volume - (16.97K BTC):
∴ Weekly volume is slightly above the 20-week average, marking a minor recovery in participation;
∴ There is no volume spike to validate a breakout, which is common in compressive ranges near resistance;
∴ Volume has been declining since mid-May, forming a local divergence with price highs.
✴ Conclusion: Volume profile supports current levels but does not confirm breakout potential. A rejection with strong volume will mark local exhaustion.
⊢
II. ∆ CME Technical Dislocation – BTC1! Futures:
▦ CME GAP – BTC1! – ($107,445.00):
∴ The CME Futures opened this week at $105,060.00 and closed the previous session at $107,445.00;
∴ A clear unfilled gap persists between $105,060.00 and $107,900.00, with price action hovering just above the top edge;
∴ Bitcoin has a consistent historical behavior of returning to close such gaps within a short- to mid-term range.
✴ Conclusion: The unfilled CME gap acts as a gravitational technical force. As long as price remains below $109K without volume expansion, the probability of revisiting the $105K area remains elevated.
⊢
III. ∫ On-Chain Intelligence – (Source: CryptoQuant):
▦ Exchange Inflow Total - (All Exchanges):
∴ Current inflow volume remains below the 1,000 Bitcoin daily threshold, indicating no panic selling or institutional exits;
∴ This inflow level corresponds to accumulation or holding phases, rather than distribution;
∴ The pattern matches a neutral-to-positive mid-cycle environment.
✴ Conclusion: There is no structural on-chain pressure. As long as inflows remain low, risk of capitulation or distribution is minimal.
⊢
▦ Spot Taker CVD - (Cumulative Volume Delta, 90-day) – (All Exchanges):
∴ The 90-day CVD shows continued dominance of taker buys over sells, reflecting ongoing demand strength in spot markets;
∴ However, the curve is flattening, suggesting buyers are meeting resistance or fading interest;
∴ No sharp reversal in the CVD curve is detected — only saturation.
✴ Conclusion: Demand remains dominant, but the pace is decelerating. Without renewed volume, this curve may revert or plateau.
⊢
▦ Exchange Inflow Mean - (MA7) – (All Exchanges):
∴ The 7-day moving average of exchange inflow continues to decline steadily;
∴ This metric often precedes calm phases or pre-breakout plateaus;
∴ Historical patterns show similar inflow behavior before prior volatility expansions.
✴ Conclusion: A period of silence is unfolding. Reduced mean inflow suggests price is awaiting external catalysts for movement.
⊢
▦ Funding Rates – (Binance):
∴ Current funding rates are neutral, with slight positive bias, suggesting balanced long-short sentiment;
∴ No extreme spikes indicate absence of excessive leverage;
∴ This equilibrium typically precedes significant directional moves.
✴ Conclusion: Market is leveled. Funding neutrality reflects hesitation and prepares ground for upcoming directional choice.
⊢
IV. ⚖️ Macro–Geopolitical Axis – (Powell, Middle East & BTC/XAU):
▦ MACRO CONTEXT:
∴ Jerome Powell is scheduled to speak on Wednesday (June 19), with markets anticipating remarks on rate stability or future hikes;
∴ Ongoing tensions in the Middle East (Israel–Iran) elevate risk-off behavior in traditional markets;
∴ Bitcoin has triggered a rare Golden Cross vs. Gold, as noted by U.Today, signaling digital strength over legacy value.
✴ Conclusion: Macro remains the primary external catalyst. Powell’s statement will determine short-term volatility. Until then, Bitcoin floats between its technical support and CME magnetism, with gold dynamics providing long-term bullish backdrop.
⊢
⚜️ 𝟙⟠ Magister Arcanvm – Vox Primordialis!
⚖️ Wisdom begins in silence. Precision unfolds in strategy.
⊢
PTON Peloton Potential Buyout Interest from Amazon or NikeIf you haven`t bought the dip on PTON, before the rally:
Now Peloton Interactive PTON remains a compelling bullish candidate in 2025, supported not only by strategic buyout interest from major players like Amazon and Nike but also by significant unusual options activity signaling strong investor conviction in a near-term upside move. These factors combined create a powerful catalyst for a potential stock rally.
1. Confirmed Buyout Interest from Amazon and Nike
Since 2022, credible reports have indicated that Amazon and Nike are exploring acquisition opportunities for Peloton, recognizing its value as a leading connected fitness platform with over 2 million subscribers.
Amazon’s interest fits its broader health and smart home ambitions, while Nike sees Peloton as a strategic extension of its digital fitness ecosystem.
Such buyout interest implies a potential premium valuation, which could trigger a sharp upward re-rating of Peloton’s shares if a deal materializes or even if speculation intensifies.
2. Massive Unusual Call Option Activity for July 18, 2025 Expiry
A mystery trader recently purchased over 80,000 call options on Peloton with a $7 strike price expiring July 18, 2025, representing a $3.1 million bet on a price rise within the next few months.
On May 20, 2025, over 90,000 contracts of the $7 strike call expiring July 18, 2025 traded, equating to roughly 9 million underlying shares—well above Peloton’s average daily volume.
This unusually high call volume signals strong bullish sentiment and possible insider or institutional anticipation of a positive event, such as a buyout announcement or operational turnaround.
3. Strategic Fit and Synergies for Acquirers
Peloton’s subscription-based connected fitness platform offers Amazon and Nike a valuable recurring revenue stream and engaged user base.
Amazon could integrate Peloton’s offerings into its ecosystem of devices, health services, and e-commerce, while Nike could leverage Peloton’s content and hardware to deepen its digital fitness presence.
The potential for cross-selling, brand synergy, and data monetization enhances Peloton’s attractiveness as an acquisition target.
4. Attractive Valuation and Growth Potential
Peloton’s market cap has contracted significantly, making it an affordable target for large corporations with strategic interests in health and fitness.
Recent product launches, cost-cutting measures, and renewed marketing efforts aim to stabilize and grow Peloton’s subscriber base and revenue.
The connected fitness market continues to expand, driven by consumer demand for at-home and hybrid workout solutions.
5. Technical and Sentiment Indicators
The stock has shown signs of stabilizing after recent volatility, with support forming near $6–$6.50.
The surge in call options activity, especially at strikes above current prices, suggests growing investor confidence in a near-term breakout.
Historical patterns show Peloton’s stock reacts strongly to buyout rumors and unusual options volume, often resulting in rapid price appreciation.
Disclosure: I am part of Trade Nation's Influencer program and receive a monthly fee for using their TradingView charts in my analysis.

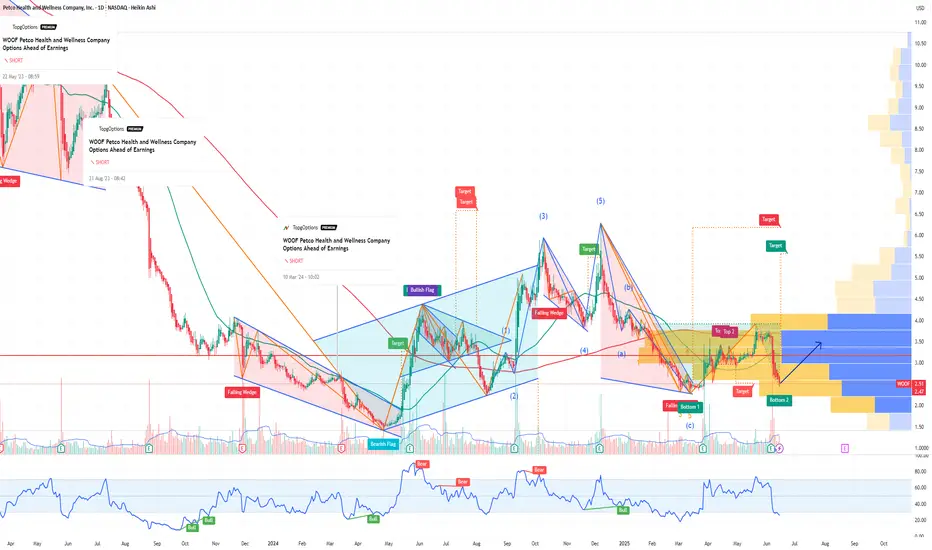
WOOF Petco Health & Wellness Company Potential Bullish ReversalIf you haven`t sold WOOF before this major retracement:
WOOF Petco Health and Wellness Company has experienced a notable selloff recently, with its stock price declining to around $2.47 as of mid-June 2025. However, several fundamental and technical factors suggest that WOOF could be poised for a meaningful reversal and upside recovery in the near to medium term.
1. Attractive Valuation and Upside Potential
Despite the recent pullback, Petco’s stock is trading at a compelling valuation relative to its long-term growth potential.
Price forecasts for 2025 indicate an average target of approximately $3.55, representing a 43.7% upside from current levels.
More optimistic scenarios project highs up to $7.05 within this year, suggesting significant room for a rebound if market sentiment improves.
Long-term forecasts are even more bullish, with price targets of $14 by 2030 and as high as $77 by 2040, reflecting confidence in Petco’s strong market position and growth prospects.
2. Resilient Business Model in a Growing Pet Care Market
Petco operates in the resilient pet care and wellness industry, which benefits from secular trends such as increased pet ownership, premiumization of pet products, and growing consumer spending on pet health.
The company’s omni-channel approach—combining e-commerce with physical stores and veterinary services—positions it well to capture multiple revenue streams.
Petco’s focus on health and wellness services, including veterinary care and pet insurance, provides higher-margin growth opportunities that can drive profitability improvements.
3. Technical Signs of Stabilization and Potential Reversal
After the recent selloff, WOOF’s stock price has found some support near the $2.40–$2.50 level, with increased trading volumes indicating growing investor interest.
The stock’s recent modest gains and stabilization suggest that selling pressure may be easing, setting the stage for a potential technical rebound.
Options market activity and analyst upgrades reflect improving sentiment.
4. Improving Operational Execution and Financial Health
Petco has been investing in expanding its veterinary services and digital capabilities, which are expected to contribute to revenue growth and margin expansion.
The company’s recent earnings calls and financial reports highlight progress in cost management and customer engagement initiatives.
Strong cash flow generation and manageable debt levels provide flexibility to invest in growth and weather macroeconomic uncertainties.
5. Market Sentiment and Analyst Support
While some analysts remain cautious, the overall sentiment is shifting toward a more constructive outlook, with several price target upgrades and “hold” to “buy” rating adjustments.
The combination of attractive valuation, improving fundamentals, and sector tailwinds is likely to attract renewed institutional interest.
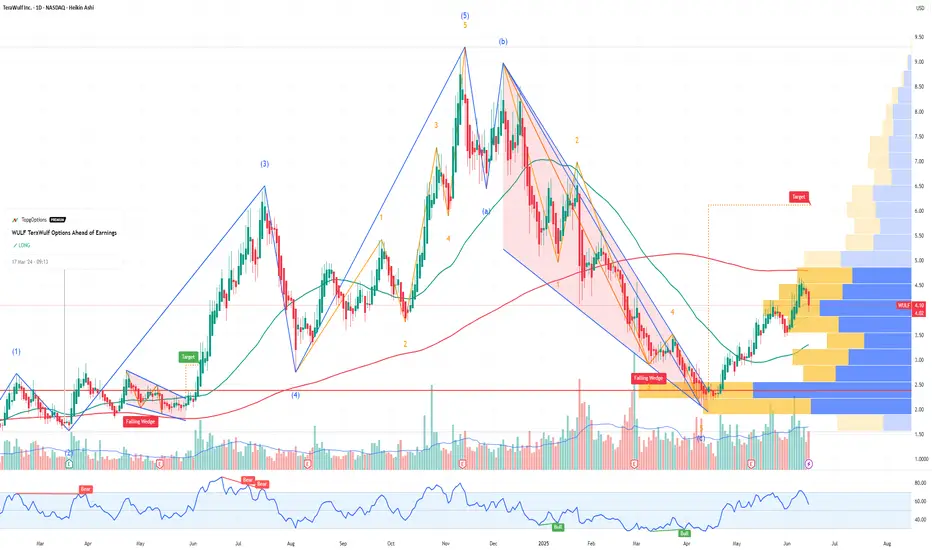
WULF TeraWulf Leader in Clean Crypto Mining & HPC InfrastructureIf you haven`t bought WULF before the rally:
Now TeraWulf WULF is emerging as a compelling growth story in the digital infrastructure and cryptocurrency mining sectors, distinguished by its commitment to zero-carbon energy and expanding high-performance computing (HPC) hosting capabilities. Despite near-term financial challenges, the company’s rapid capacity growth, strong cash position, and strategic initiatives position it well for substantial upside in 2025 and beyond.
1. Rapid Expansion of Mining Capacity and Hashrate Growth
TeraWulf energized Miner Building 5, increasing its total mining capacity to 245 MW and boosting its Bitcoin mining hashrate to 12.2 exahashes per second (EH/s), a 52.5% increase year-over-year.
This significant growth in self-mining capacity enhances revenue potential and operational scale, positioning TeraWulf among the more efficient and sizable clean-energy miners.
The company’s vertically integrated model, powered primarily by zero-carbon energy, aligns with increasing regulatory and investor demand for sustainable crypto mining.
2. Strategic Buildout of High-Performance Computing (HPC) Infrastructure
TeraWulf commenced the buildout of dedicated HPC data halls and remains on track to deliver 72.5 MW of gross HPC hosting infrastructure to Core42 in 2025.
The company is actively pursuing additional HPC customers, targeting 200–250 MW of operational HPC capacity by the end of 2026, which diversifies revenue streams beyond crypto mining.
HPC infrastructure is a high-growth segment driven by demand for AI, big data, and cloud computing, offering TeraWulf exposure to secular technology trends.
3. Strong Financial Position and Capital Allocation
As of March 31, 2025, TeraWulf held approximately $219.6 million in cash and bitcoin holdings, providing liquidity to fund expansion and weather market volatility.
The company has repurchased $33 million of common stock in 2025, signaling management’s confidence in the business and commitment to shareholder value.
While total outstanding debt is around $500 million, TeraWulf maintains a strong current ratio (~5.4), indicating solid short-term liquidity.
4. Industry-Leading Sustainability Profile
TeraWulf’s focus on zero-carbon energy for its mining operations differentiates it in an industry increasingly scrutinized for environmental impact.
This green positioning not only appeals to ESG-conscious investors but may also provide access to incentives, partnerships, and preferential contracts as governments and enterprises emphasize sustainability.
5. Revenue Growth Outlook and Market Opportunity
Despite a temporary revenue dip to $34.4 million in Q1 2025, the company is projected to deliver a 53% increase in revenue for the full year 2025, significantly outpacing industry averages.
The combination of expanding mining capacity and HPC hosting services positions TeraWulf to capitalize on the growing demand for digital infrastructure powered by clean energy.
6. Navigating Financial Challenges with Growth Focus
TeraWulf reported a GAAP net loss of $0.16 per share in Q1 2025, reflecting ongoing investments in capacity and infrastructure.
Operational cash flow remains positive and improving, with management focused on scaling efficiently and improving margins over time.
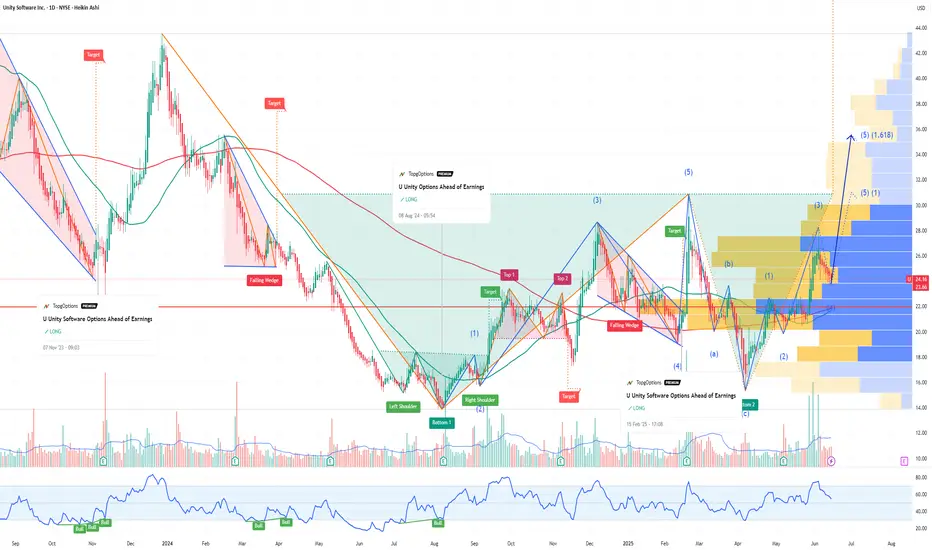
U Unity Is the Leader Powering the Mobile Gaming Boom in 2025If you haven`t bought the dip on U:
Now you need to know that U Unity Software stands as the dominant platform for mobile game development, fueling one of the fastest-growing segments in the global gaming industry. As mobile gaming continues its explosive expansion, Unity’s leadership in providing an accessible, powerful, and cross-platform game engine positions it for substantial growth and sustained market dominance in 2025 and beyond.
1. Unity Powers Over 70% of Mobile Games Worldwide
Unity is the engine behind more than 70% of all mobile games, a staggering market share that underscores its ubiquity and developer preference in the mobile gaming space.
This dominant position is supported by Unity’s user-friendly interface that appeals to a broad spectrum of developers—from indie studios to AAA game creators—enabling rapid prototyping and high-quality game production.
The company’s “build once, deploy anywhere” approach allows developers to launch games seamlessly across iOS, Android, consoles, and emerging platforms like AR/VR, saving time and development costs.
2. Mobile Gaming Market Growth Fuels Unity’s Expansion
The global mobile gaming market is projected to grow by $82.4 billion from 2025 to 2029, at a CAGR of 11.3%, driven by rising smartphone penetration, 5G connectivity, and increasing demand for multiplayer and free-to-play games.
Unity’s platform is uniquely positioned to capture this growth, as 90% of developers surveyed in 2025 reported launching their games on mobile devices.
The Asia-Pacific (APAC) region, accounting for over half of the mobile gaming market, represents a key growth area where Unity’s tools are widely adopted.
3. Cutting-Edge Technology and Innovation in Gaming Development
Unity’s continuous innovation, including the release of Unity 6 and Unity Vector, supports developers with advanced rendering, AI-driven content creation, and enhanced networking tools for smoother multiplayer experiences.
The platform’s integration of AI enables real-time, player-driven experiences such as dynamic content and adaptive storylines, which are becoming industry standards in 2025.
Unity’s cloud-based services and analytics empower developers to optimize monetization strategies, balancing user experience with in-app purchases and rewarded ads, which are booming in hybrid-casual games.
4. Thriving Developer Ecosystem and Support Network
Unity boasts a massive and active developer community, with over 8,000 companies worldwide adopting its platform for game development.
The Unity Asset Store and extensive tutorials reduce development time and costs, enabling faster time-to-market and innovation cycles.
This ecosystem fosters collaboration and accelerates problem-solving, making Unity the preferred choice for both startups and established studios.
5. Strong Financial Performance and Market Position
In Q1 2025, Unity reported revenue of $435 million with an adjusted EBITDA margin of 19%, reflecting operational discipline and strong demand for its platform.
Despite a GAAP net loss, Unity’s positive adjusted earnings per share ($0.24) and growing free cash flow demonstrate improving profitability metrics.
Unity’s leadership in mobile game development and expanding footprint in AR, VR, and metaverse projects provide multiple avenues for future revenue growth.
6. Cross-Platform and Metaverse Growth Opportunities
Unity’s “build once, deploy anywhere” philosophy extends beyond gaming into virtual concerts, interactive worlds, and digital marketplaces, positioning the company at the forefront of the metaverse evolution.
Enhanced networking and cloud gaming capabilities enable high-quality experiences across devices, including mobile phones and AR glasses, broadening Unity’s addressable market.
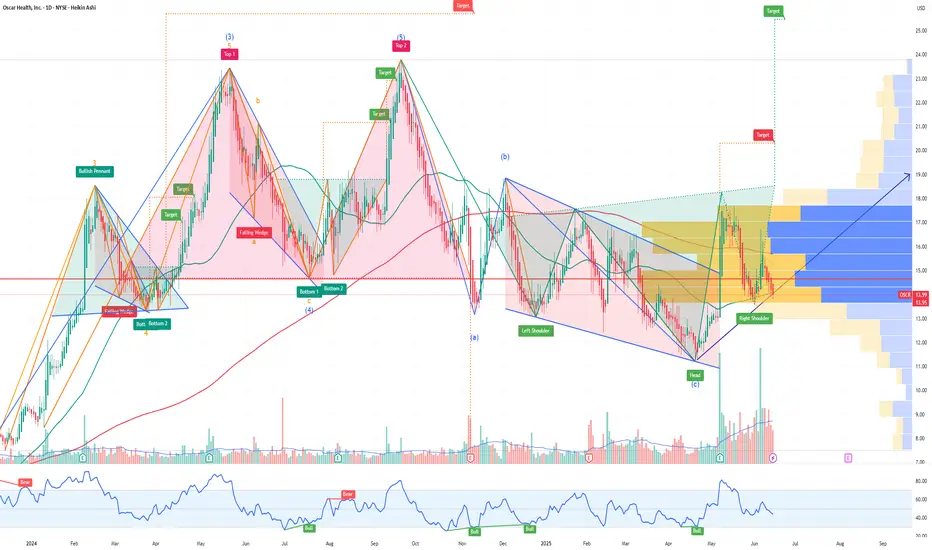
Bullish Thesis: Why Oscar Health OSCR Could Rally Strong in 2025Oscar Health, OSCR, a technology-driven health insurance company, is positioned for a significant stock price appreciation in 2025. Despite some mixed short-term sentiment, the long-term outlook and recent analyst forecasts suggest a potential rally that could more than double the current share price. Here’s why OSCR could be a compelling bullish opportunity this year:
1. Strong Analyst Price Targets Indicate Upside of Over 125%
According to recent forecasts, OSCR is expected to reach an average price of $31.40 in 2025, with some analysts projecting highs as much as $41.31—a potential upside exceeding 125% from the current price near $13.95.
Monthly forecasts show a steady upward trajectory, with July 2025 targets around $37.24 and December 2025 targets near $34.67, highlighting sustained bullish momentum throughout the year.
The average 12-month price target is around $34.40, representing a 146% upside, signaling strong confidence in OSCR’s growth prospects.
2. Innovative Business Model and Growth Potential
Oscar Health leverages technology and data analytics to offer user-friendly, transparent health insurance plans, differentiating itself in a traditionally complex industry.
Its focus on member engagement, telemedicine, and cost-effective care management positions it well to capture market share as healthcare consumers increasingly demand digital-first solutions.
The company’s expanding footprint in both individual and Medicare Advantage markets provides multiple growth avenues.
3. Long-Term Vision and Market Opportunity
Beyond 2025, forecasts remain highly bullish, with OSCR projected to reach $53.77 by 2027 and nearly $100 by 2030, reflecting strong secular growth potential in the health insurance and digital health sectors.
Analysts see Oscar as a disruptive force with the potential to reshape healthcare delivery, driving substantial long-term shareholder value.
4. Improving Financial Metrics and Operational Execution
Oscar has been improving its loss ratios and operating efficiencies, which are critical for sustainable profitability.
The company’s investments in technology infrastructure and data-driven care management are expected to translate into better margins and revenue growth over time.
5. Market Sentiment and Analyst Ratings
While some platforms show mixed short-term sentiment, the dominant analyst consensus is a "Buy" or "Moderate Buy," supported by strong price targets and growth forecasts.
The stock’s current undervaluation relative to its growth potential creates a favorable risk-reward profile for investors.