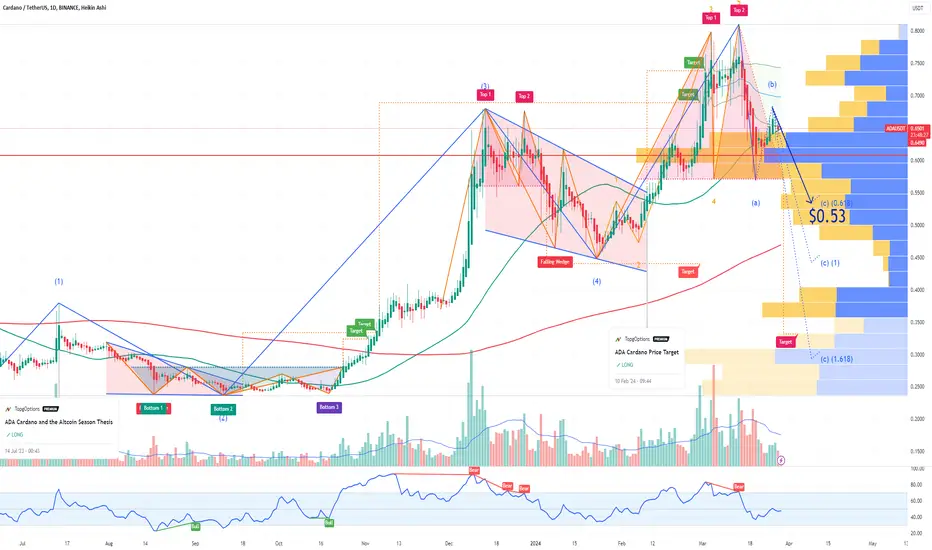
ADA Cardano Double TopIf you haven`t bought ADA before the altcoin season rally:
Now, I believe we are going to see a retracement from this Double Top formation, one of the most bearish chart patterns, to $0.53!
Indicators
MSTR MicroStrategy Incorporated Fair Value | Potential Sell-OffAchieving a scenario where MSTR trades at parity with its Bitcoin reserves would necessitate a remarkable surge in BTC price to $157,000, marking a staggering 130% increase from current levels!
At today's BTC price, MSTR's ideal settlement range would hover around $775-$800, representing its fair value!
Adding a slight premium, my adjusted price target for MSTR would be $960!
The growing popularity of Bitcoin ETFs presents a challenge to MSTR's relevance, making it useless to hold MSTR at such a high premium to its BTC holdings!
It's worth noting that CEO Michael Saylor sold 1,508 shares of the company on March 14, 2024.

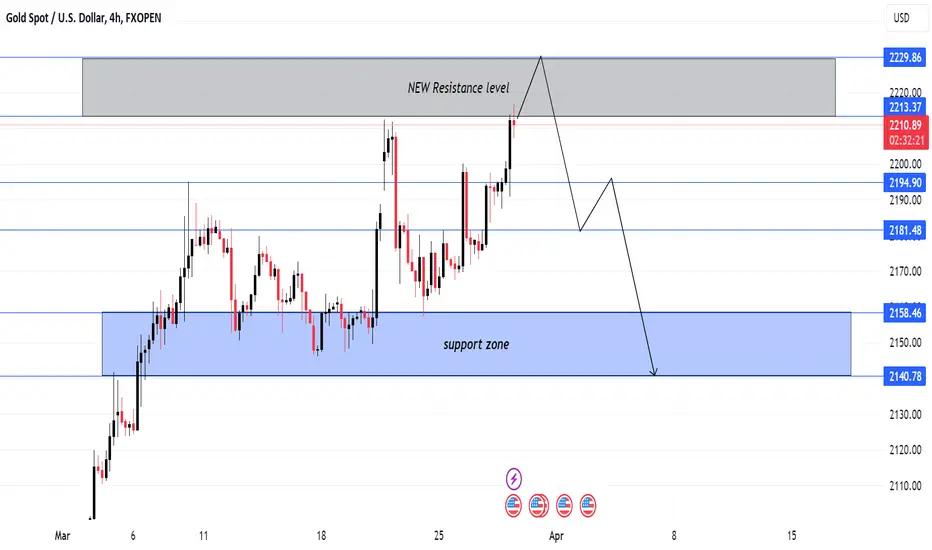
Gold pair price test New resistance levels 2230 drop 💧 2140 ⤵⤵Hello traders what you think Gold pair NES resistance levels 2230 📉📊📈⤵
Gold pair technical analysis
Gold pair take new resistance levels of 2230 pullback Berish support levels 2140
Follow risk management
Safe trade don't forget like this analysis
BRIEFING Week #12 : AltSeason early signaling ?Here's your weekly update ! Brought to you each weekend with years of track-record history..
Don't forget to hit the like/follow button if you feel like this post deserves it ;)
That's the best way to support me and help pushing this content to other users.
Kindly,
Phil

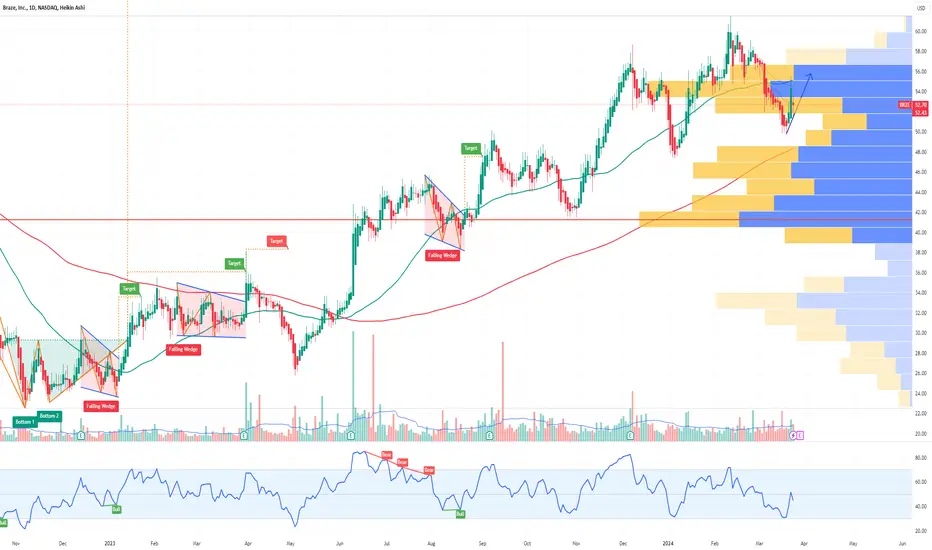
BRZE Braze Options Ahead of EarningsAnalyzing the options chain and the chart patterns of BRZE Braze prior to the earnings report this week,
I would consider purchasing the 50usd strike price in the money Calls with
an expiration date of 2024-4-19,
for a premium of approximately $5.70.
If these options prove to be profitable prior to the earnings release, I would sell at least half of them.
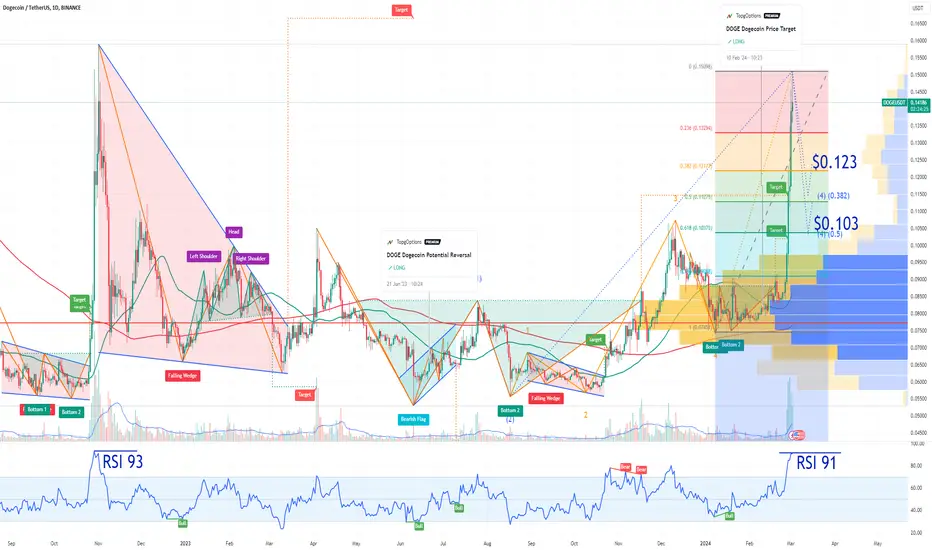
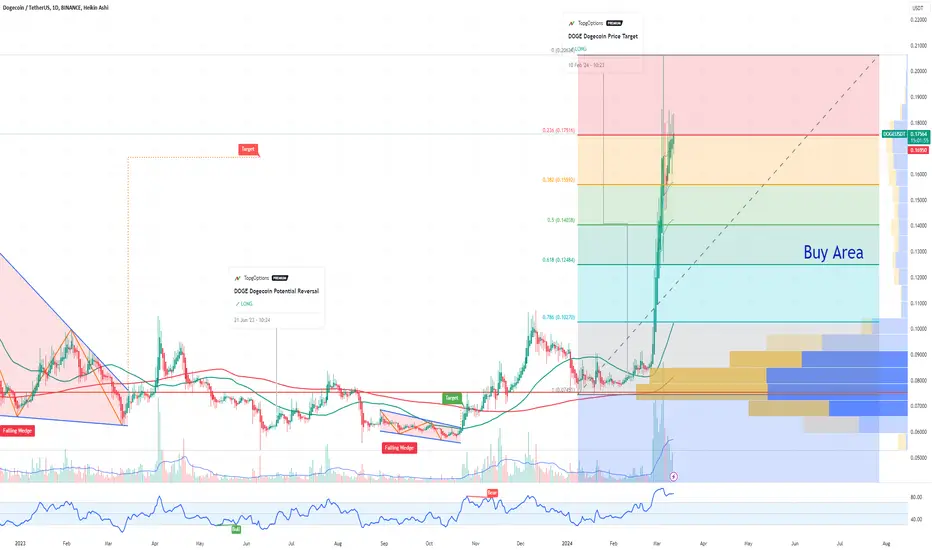
DOGE Dogecoin Potential Retracement Soon After DOGE Dogecoin perfectly reached the price target:
Now, at an RSI exceeding 91, it seems we are currently in a bubble.
The previous correction following an RSI surpassing 90 was substantial.
Taking into account the Fib retracement tool, my anticipated price targets are $0.123 and $0.103.
BONK Potential ReatracementBONK is on the verge of creating a double top, with a possible retracement target at $0.0000193, aligning with the 0.5 Fibonacci retracement level.
It appears significantly overvalued.
In my view, this meme coin bubble is poised to burst soon.

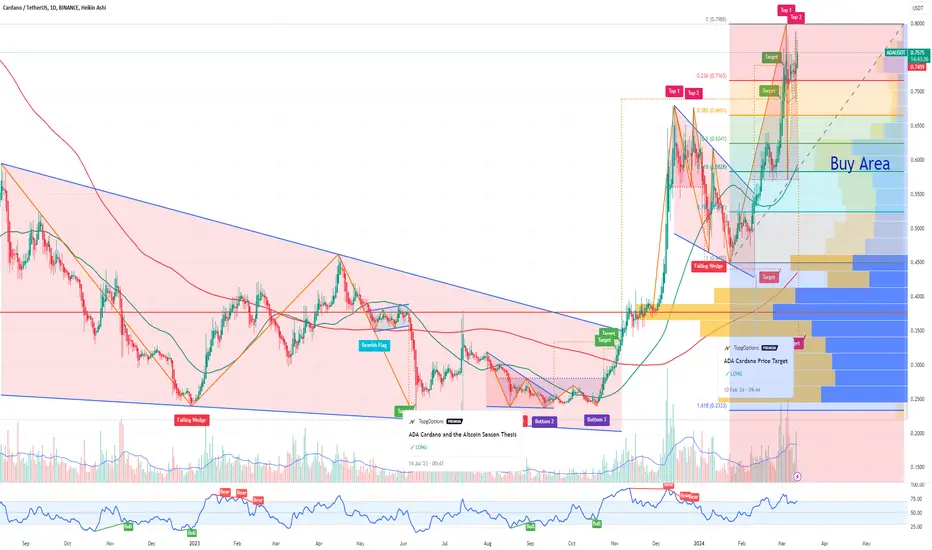
ADA Cardano Potential Retracement SoonIf you haven`t bought ADA just before the rally:
Then using the Fibonacci Retracement tool, I believe there will be a new buy opportunity in the $0.58- $0.62 range!
TRX Tron Potential Retracement SoonUsing the Fibonacci Retracement tool, I believe there will be a new buy opportunity in the $0.10 - $0.11 range for TRX Tron!

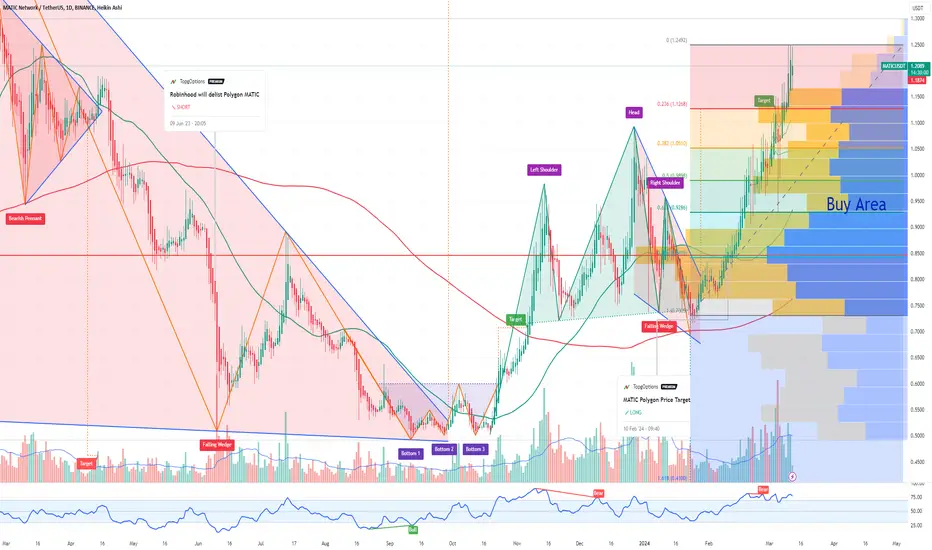
MATIC Polygon Potential Retracement SoonIf you haven`t bought MATIC before the rally:
Then using the Fibonacci Retracement tool, I believe there will be a new buy opportunity in the $0.92- $0.98 range!
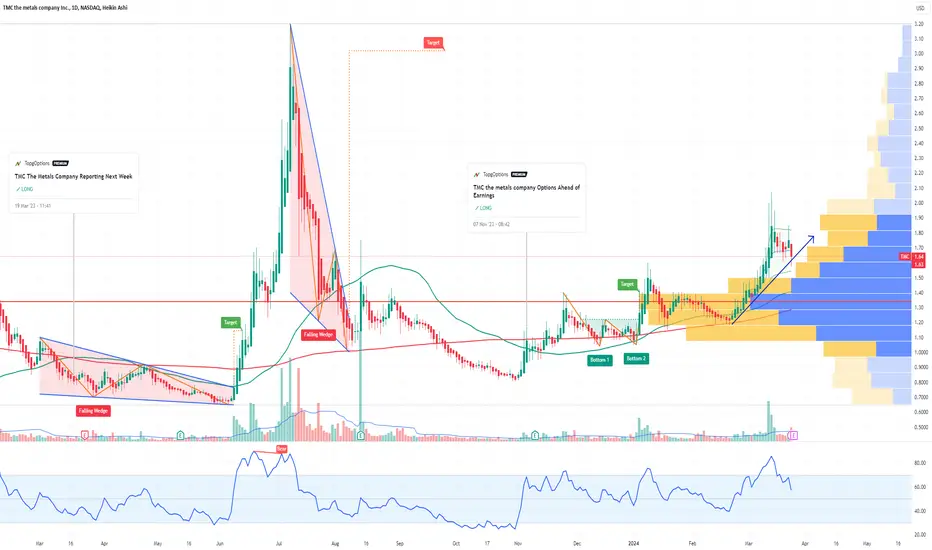
TMC the metals company Options Ahead of EarningsIf you haven`t bought TMC before the previous earnings:
Then analyzing the options chain and the chart patterns of TMC the metals company prior to the earnings report this week,
I would consider purchasing the 1.50usd strike price in the money Calls with
an expiration date of 2024-4-19,
for a premium of approximately $0.27.
If these options prove to be profitable prior to the earnings release, I would sell at least half of them.
XAUUSD 100% CONFIRM ANALYSISDiscover an enticing selling opportunity in GOLD as it undergoes a critical retest of a key support area. With market analysis, technical indicators, and price action as your allies, evaluate the potential downside move. Stay vigilant and informed to capitalize on this precious metal's market dynamics.
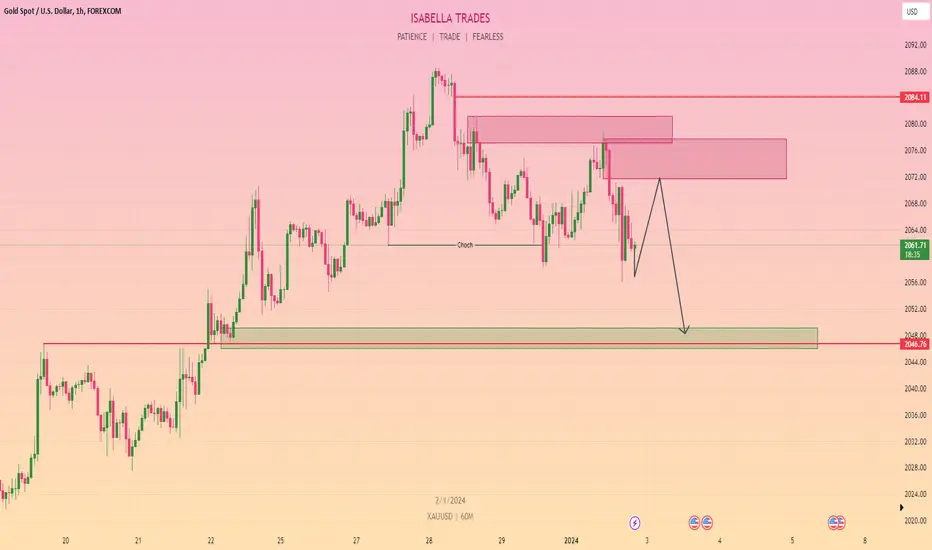
XAUUSD 100% CONFIRM ANALYSISDiscover an enticing Selling opportunity in GOLD as it undergoes a critical retest of a key resistance area. With market analysis, technical indicators, and price action as your allies, evaluate the potential downside move. Stay vigilant and informed to capitalize on this precious metal's market dynamics.
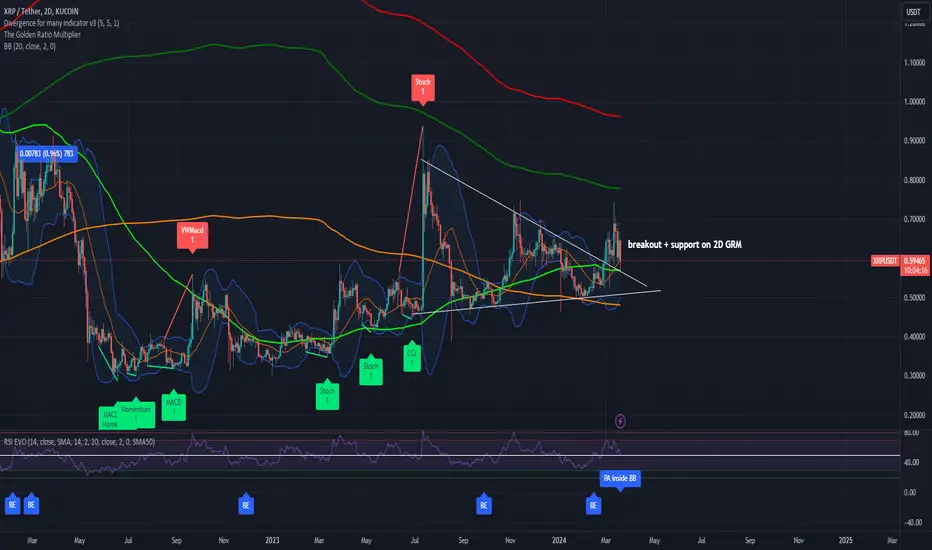
XRPUSDT - Long Couple of things to note here:
USDT pair:
Support on 1D and 2D GRM
Triangle breakout
BTC pair:
Oversold on 1W (also 3D,4D,5D,6D...)
Massive bullish divergence + multiple indicators flashing green
Check charts below and verify for yourself
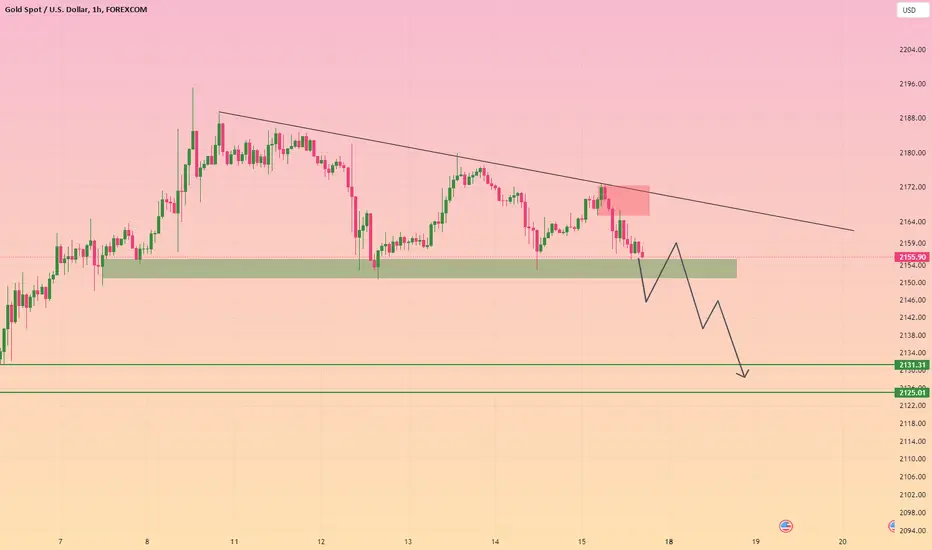
XAUUSD 90% CONFIRM ANALYSISDiscover an enticing Selling opportunity in GOLD as it undergoes a critical retest of a key resistance area. With market analysis, technical indicators, and price action as your allies, evaluate the potential downside move. Stay vigilant and informed to capitalize on this precious metal's market dynamics.
BRIEFING Week #11 : Don't fall into the Crowded Traps !!Here's your weekly update ! Brought to you each weekend with years of track-record history..
Don't forget to hit the like/follow button if you feel like this post deserves it ;)
That's the best way to support me and help pushing this content to other users.
Kindly,
Phil

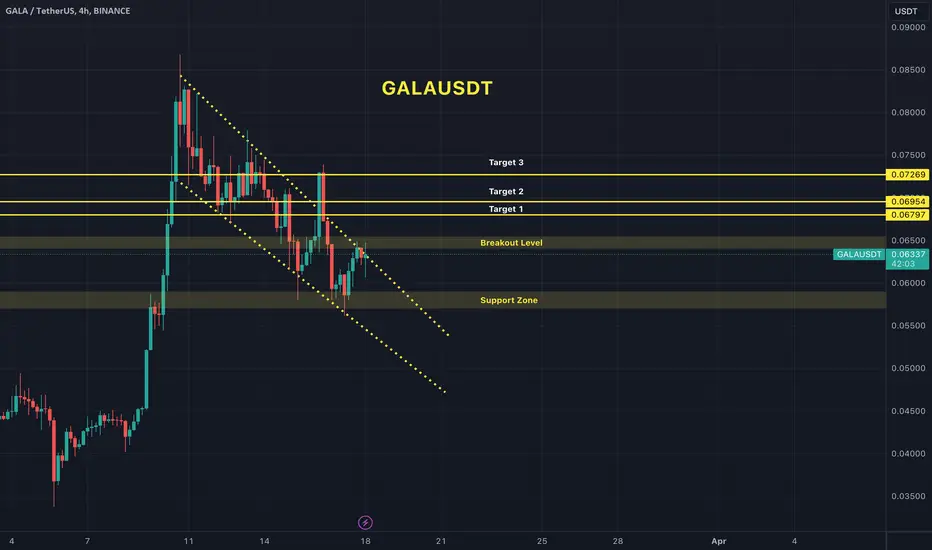
GALA USDT Bout to breakout?!Check out this setup. Highly likely that we will see a breakout to the upside.
Idea is:
- Buy the breakout
- Exit trade at one of the targets
Remember to set your stop losses and trade safely.
PATH UiPath Options Ahead of EarningsIf you haven`t bought PATH before the previous earnings:
Then analyzing the options chain and the chart patterns of PATH UiPath prior to the earnings report this week,
I would consider purchasing the 23usd strike price Calls with
an expiration date of 2024-7-19,
for a premium of approximately $4.10.
If these options prove to be profitable prior to the earnings release, I would sell at least half of them.

STNE StoneCo Options Ahead of EarningsIf you haven`t bought STNE before the previous earnings:
Then analyzing the options chain and the chart patterns of STNE StoneCo prior to the earnings report this week,
I would consider purchasing the 17usd strike price Calls with
an expiration date of 2024-3-22,
for a premium of approximately $1.20.
If these options prove to be profitable prior to the earnings release, I would sell at least half of them.

BTBT Bit Digital Options Ahead of EarningsAnalyzing the options chain and the chart patterns of BTBT Bit Digital prior to the earnings report this week,
I would consider purchasing the 2.50usd strike price Calls with
an expiration date of 2024-4-19,
for a premium of approximately $0.30.
If these options prove to be profitable prior to the earnings release, I would sell at least half of them.

DOGE Dogecoin Potential Retracement SoonIf you haven`t bought DOGE Dogecoin before the rally:
Then using the Fibonacci Retracement tool, I believe there will be a new opportunity in the $0.125 - $0.140 range!
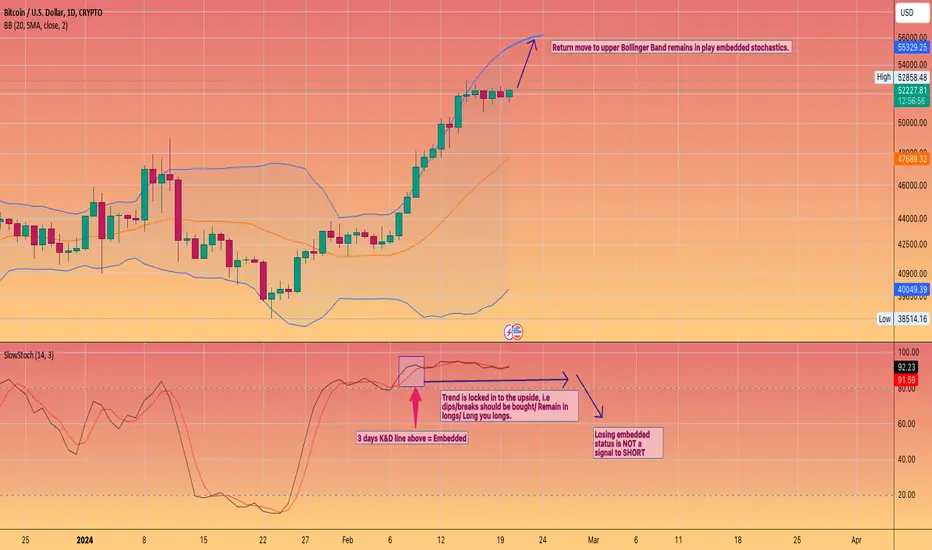
BITCOIN is still BULLISH. Because we are Embedded. I see people trying to short this market!
WRONG, WRONG, WRONG.
You should be
LONG, LONG, LONG.
Whilst the slow stochastic's are embedded - which they have been for 10 days now.
How do Slow Stokes embed? 3 continuous days with readings above 80 on the K&D line.
You now have a indicator that has flipped from overbought to a LOCKED 🔒 in trend.
(This also works in Bear moves with reading under 20)
We could see 55K easily by Friday a return. move to the upper Bollinger Band.
If at any point the stochastic's close under 80... they can regain their embedded status, the very next day ONLY.
Also losing the stochastic's doesn't mean to short, but simply take some chips off the table.
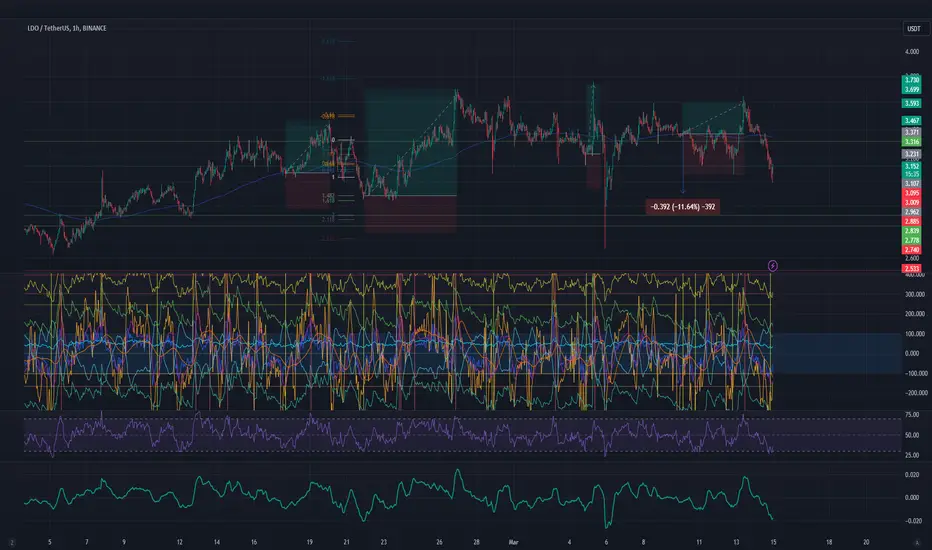
Ma first indicator LDOJust look at THAT!
ITS ALIVE! and its workin'
6 months of testin' and 18 months of backtestin' the yellow iz for longs and red for shorts. Im so sneaky:)