BRIEFING Week #21 : Watch out for ComoditiesHere's your weekly update ! Brought to you each weekend with years of track-record history..
Don't forget to hit the like/follow button if you feel like this post deserves it ;)
That's the best way to support me and help pushing this content to other users.
Kindly,
Phil
Indicators

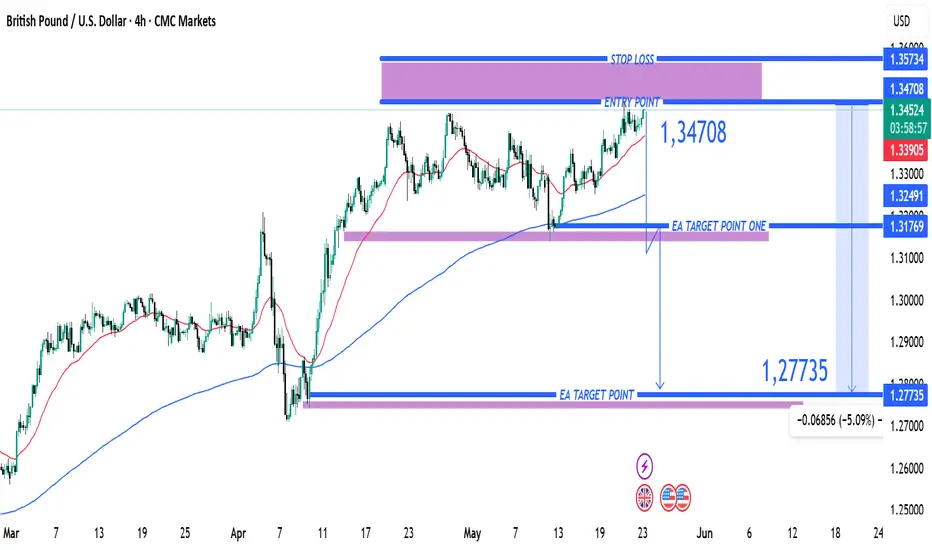
GBPUSD Trade Setup – Entry at 1.34708 with Target at 1.27735Entry Point: ~1.34708
Stop Loss Zone: ~1.35734 (roughly 100 pips above entry)
Target Points:
EA Target Point One: 1.31769
EA Final Target Point: 1.27735
---
Technical Observations:
1. Price Action:
The price is consolidating below the 1.34708 resistance level.
Multiple failed attempts to break above suggest selling pressure around this zone.
2. Moving Averages:
Two MAs (possibly 50 EMA and 200 EMA) show a recent crossover, potentially indicating a shift in momentum.
3. Bearish Bias:
Based on the annotated targets, the trader anticipates a reversal from the current level.
A drop to 1.27735 represents a 5.09% move from the entry point.
4. Risk-Reward Ratio:
Risk (Entry to Stop Loss): ~100 pips
Reward (Entry to Final TP): ~700+ pips
Risk-reward is highly favorable (~1:7)
Confluence & Support Zones:
1.31769: Previously tested support/resistance level – a logical intermediate target
1.27735: Historical support zone from early March – final bearish target.
Summary:
This setup is a swing short trade with an attractive risk-reward profile.
Confirmation via bearish reversal candlesticks near 1.34708 would strengthen the case.
Watch out for news catalysts or USD data that might impact volatility and invalidate the setup.
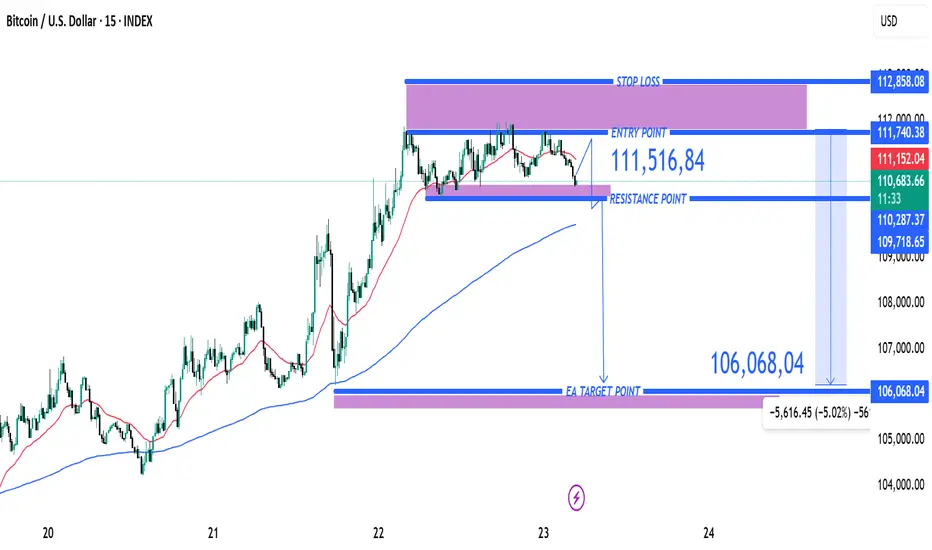
(BTC/USD) Short Trade Setup – Bearish Reversal from Resistance 1. Entry Point: 111,516.84
2. Stop Loss: 112,858.08
3. EA Target Point (Take Profit): 106,068.04
4. Resistance Point: ~110,563 (currently being tested)
Trade Setup Summary:
Type: Short position
Risk (Stop LOss - Entry): 112,858.08 - 111,516.84 = 1,341.24
Reward (Entry - Target): 111,516.84 - 106,068.04 = 5,448.80
Risk/Reward Ratio: Roughly 1:4, which is favorable.
Technical Indicators:
The chart shows:
Moving Averages: A red (shorter) and blue (longer) MA, suggesting recent bullish momentum.
Price Action: Consolidation near the resistance after an uptrend; current candle appears bearish and breaking the support.
Interpretation:
This is a bearish reversal setup.
If the price breaks the support around 110,563 convincingly, it may confirm a move downward.
The stop loss is placed safely above recent highs to avoid getting caught in short-term volatility.
The target is significantly lower, around previous support levels, implying a strong move down is anticipated.
Risk:
This strategy banks on a clear breakdown. If the support holds, price may reverse upward, hitting the stop loss.
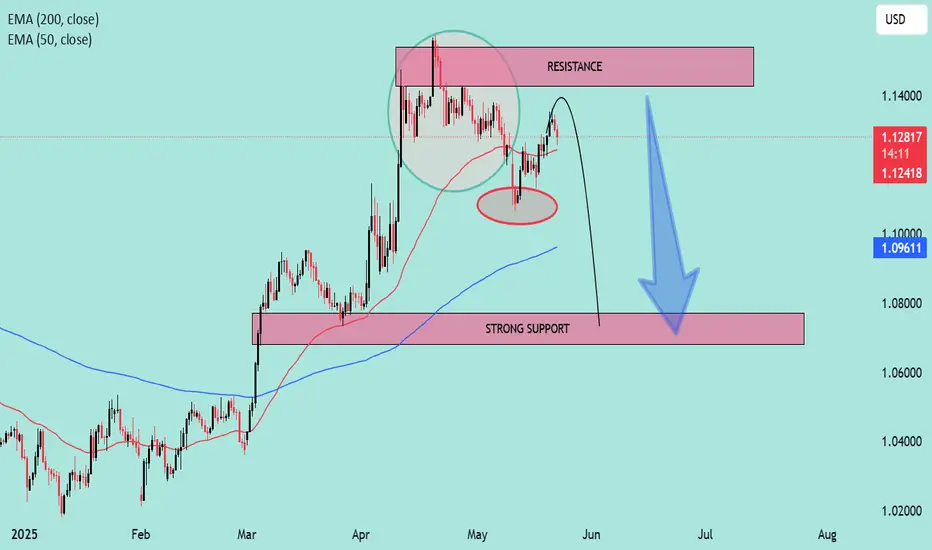
EUR/USD Forming Double Top –Bearish Reversal Toward Key Support?📉 EUR/USD Technical Outlook – Bearish Bias Developing 🔍
🟪 Key Resistance Zone:
📍 1.1350 – 1.1450
Price has tested this resistance zone multiple times, forming a double-top pattern (🔄) within the highlighted circle. This signals buying exhaustion and potential reversal pressure. The recent failure to break above confirms the zone’s strength.
🔴 EMA Confluence:
🧭 50 EMA (red): ~1.1242
🧭 200 EMA (blue): ~1.0961
The price is currently hovering just above the 50 EMA but well above the 200 EMA, which is acting as a dynamic support. The crossover has already occurred, so if price breaks below the 50 EMA decisively, momentum could shift bearish.
🔻 Support Breakdown Risk:
A breakdown from the 1.1200 neckline area (highlighted in red oval) would confirm the double-top pattern 🎯. That opens downside potential toward the strong demand zone below.
🟪 Strong Support Zone:
📍 1.0700 – 1.0800
This area aligns with prior consolidation (March lows) and the 200 EMA, making it a high-probability reversal zone 📈 if the bearish scenario plays out.
📌 Trade Setup Insight:
✅ Bearish confirmation below 1.1200 neckline 📉
🎯 Target: 1.0800 zone
❌ Invalidation: Break above 1.1350 resistance
🔵 Summary:
The chart is hinting at a classic double-top reversal below a key resistance zone. If price breaks the neckline, sellers are likely to gain control, targeting the strong support near the 200 EMA.
📊 Bias: Bearish 👇
📅 Timeframe: Daily
🛑 Risk Management: Watch for fake-outs near neckline; volume confirmation preferred.
Technical Levels Respected – BTC Reaches $108K Target what next?📍 BTC Target Hit with Precision!
✅ As predicted in the previous analysis, Bitcoin has successfully tapped the $108K resistance zone — clean and technical execution!
📊 My chart spoke in advance... and the market listened.
🎯 Why miss out on these accurate forecasts?
📉 My strategies are not just random lines — they’re built on solid market structure, EMAs, and key price action zones.
📢 Let’s stay connected!
🧠 I’m committed to sharing educational content and professional trading insights to help you grow as a trader.
💡 Whether you're a beginner or seasoned trader, there’s always something new to learn with me.
📚 Join the journey — learn, trade, and win!
📩 DM or follow to get consistent updates and chart breakdowns.
🚀 Let’s trade smart, not hard!

Key Rejection Zone Approaching – Bearish Setup in PlayChart Summary:
Asset: Unspecified (USD-based)
Timeframe: Short-term (likely 1H or 4H)
Indicators:
EMA 50 (red): 3,245.772
EMA 200 (blue): 3,223.635
Key Zones:
Resistance Zone (Red box): ~3,310–3,360
Target/Support Zone (Red box): ~3,110–3,160
Mid Support Zone (Blue box): ~3,200–3,230
Trendline: Downward sloping resistance connecting major highs
---
Technical Breakdown:
Trend Analysis:
Primary Trend: Bearish ⬇️
Confirmed by the downtrend line (black) which has been respected multiple times (3 clear touches).
Current Price: 3,290.090
Price is approaching a key confluence zone: resistance area + trendline.
This area has previously acted as strong supply.
Moving Averages:
EMA 50 > EMA 200: Minor bullish signal (Golden Cross), but price action is still below major resistance.
However, this cross may be a false signal if price gets rejected here.
---
Price Action:
Current Move: Strong bullish push toward resistance after rebounding from the target zone ✅
The resistance zone and trendline are likely to act as a rejection point unless broken decisively.
---
Bearish Scenario (High Probability):
If price fails to break above the resistance zone:
Expect a rejection and move back toward:
Blue mid-support: ~3,220
Target zone: ~3,130 (major demand area)
Confirmation: Bearish candlestick pattern or strong wick rejections near resistance.
🔵 Entry Idea: Short near 3,310–3,350
🎯 Target: 3,130 zone
✋ Stop-Loss: Above 3,360 (above trendline + resistance)
---
Bullish Scenario (Less Likely):
If price breaks above the resistance zone with strong volume:
Could signal trend reversal
Next target levels: ~3,400+
---
Conclusion:
Bias: Bearish near resistance zone
Key Level to Watch: 3,310–3,360 (critical for direction)
Trading Approach: Wait for confirmation, don't preemptively short without rejection signals.

BRIEFING Week #20 : ETH Reversed, WTI Next ?!Here's your weekly update ! Brought to you each weekend with years of track-record history..
Don't forget to hit the like/follow button if you feel like this post deserves it ;)
That's the best way to support me and help pushing this content to other users.
Kindly,
Phil

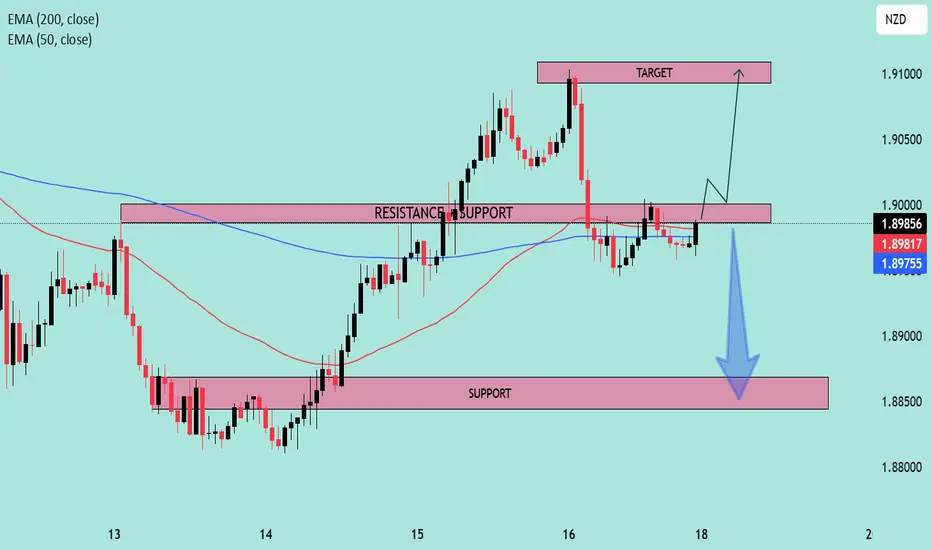
EURNZD at Key Decision Zone | Breakout or Breakdown?📊 Pair: EURNZD
🕒 Timeframe: Likely H1 or H4
📅 Date: May 18, 2025
🔍 Technical Analysis
🔁 Key Zones
🔴 Resistance-Turned-Support (RTS):
1.8975 – 1.8990
This area was previously a resistance level that price broke above, and is now acting as a critical support zone (flip zone). Price is currently retesting this area.
🎯 Target Zone (Resistance):
1.9085 – 1.9110
This is the next projected bullish target if price successfully rebounds from current support.
🛑 Major Support Zone:
1.8840 – 1.8860
Strong buying interest was seen here previously, acting as a safety net in case of bearish rejection from the current level.
🔄 EMA Confluence
📘 EMA 200 (Blue): 1.8975
📕 EMA 50 (Red): 1.8981
Price is hovering around the EMAs, indicating a moment of decision. A decisive move above these EMAs could trigger bullish momentum. 📈
🔮 Scenario Outlook
🟢 Bullish Scenario (Preferred Setup)
✅ Confirmation above 1.8990
➡️ Retest and continuation could push price toward the 1.9100 target zone.
🔼 Momentum supported by prior breakout and higher lows.
📌 Entry Idea: Above 1.8995
🎯 Target: 1.9100
🛡️ Stop: Below 1.8950
🔴 Bearish Scenario
❌ If price fails to hold the 1.8970–1.8990 zone, a breakdown could follow.
⬇️ Likely move toward 1.8850 support zone.
🚨 Watch for bearish engulfing or rejection candles near resistance.
🧠 Summary
Price is at a key decision point.
✅ Bullish bias is slightly stronger due to market structure (higher highs & higher lows).
⚠️ But a clean break below support would shift focus to the downside.
📈 Strategy: Wait for confirmation ⚖️
Bullish: Break + retest of 1.8990
Bearish: Breakdown below 1.8950 and close under EMAs
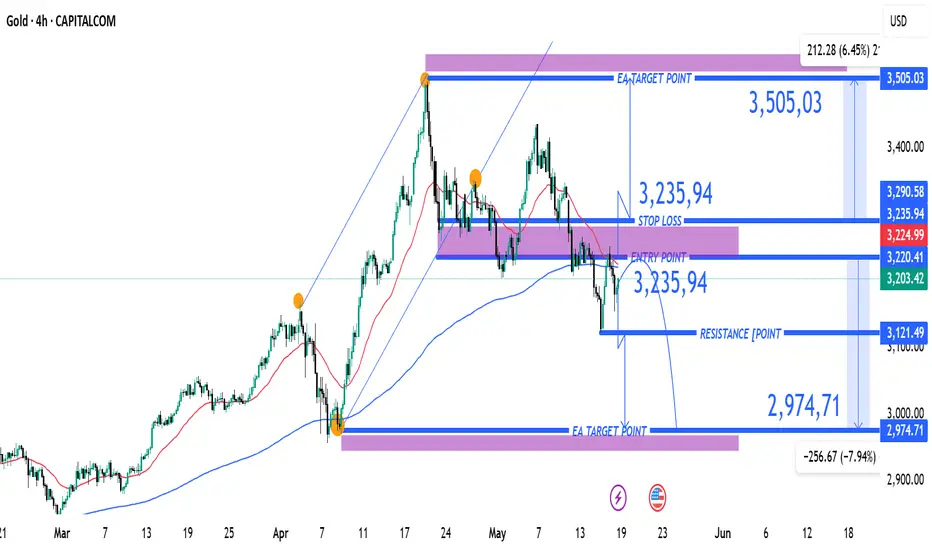
XAUUSD Bearish Setup with Key Entry, Stop Loss & Target LevelsEA GOLD MAN XAUUSD
Entry Point: $3,235.94
Stop Loss: $3,235.94 (above current price, suggesting a SELL trade)
Target Points:
EA Target Point (Downside): $2,974.71 (Short target)
EA Target Point (Upside): $3,505.03 (Long target — likely alternate scenario)
Resistance Level: $3,121.49
Nearby Support Zone: Around $3,000–$2,975
📉 Trade Strategy Implied
This appears to be a short position setup:
Sell at: ~$3,220–$3,235
Stop Loss: $3,235.94
Take Profit: $2,974.71
Risk/Reward Ratio: ~1:3 (very favorable setup if thesis holds)
The upside target ($3,505.03) might be for a different scenario — if price reverses and breaks above resistance.
🧠 Market Structure Observations
Trend: A bearish break from a previous ascending channel.
Momentum: Price has bounced slightly after hitting support, but the moving averages suggest bearish momentum may persist.
Key Risk: If price breaks above $3,236 convincingly, it could invalidate the short setup and trigger a bullish run.
📌 Summary
Bias: Bearish (based on current setup)
Setup: Short with tight stop above resistance
Confirmation Needed: Watch for rejection at the $3,220–$3,236 zone and a breakdown below $3,200 for follow-through.
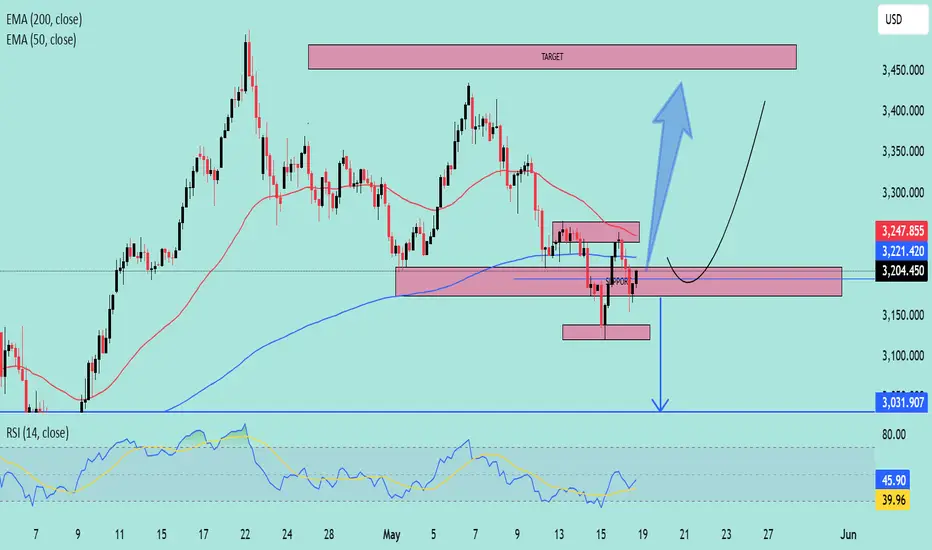
Critical Reversal or Breakdown? | XAU/USD at Make-or-Break Zone📉 Chart Overview:
Instrument: XAU/USD (assumed from chart context)
Timeframe: 4H or Daily (based on candlestick size)
Indicators Used:
📏 EMA 50 (Red): 3,247.86
📏 EMA 200 (Blue): 3,221.42
🔍 RSI (14): Currently at 45.90 (below midline, showing weak momentum)
🔎 Key Zones:
🧱 Support Zone: ~3,180 – 3,220
Price is currently sitting on this key demand zone.
Price previously bounced here sharply ➡️ indicating buyer interest.
📦 Resistance Block: ~3,260 – 3,280
Short-term resistance, price has been repeatedly rejected from here.
🎯 Target Zone: ~3,420 – 3,460
If price breaks out from the support-resistance squeeze, this is the potential bullish target 🎯.
🧭 EMA Analysis:
EMA 50 is still above EMA 200 ➡️ Golden Cross formation (medium-term bullish bias) ✅
However, price is currently below both EMAs, signaling short-term weakness ❌
📉 Bearish Scenario (📍Blue Arrow Down):
If price breaks below the support zone at ~3,180, we could see a sharp drop toward the next support at ~3,032 🔻.
RSI is trending down near 40, close to oversold territory ⚠️
🚀 Bullish Scenario (📈 Blue Arrow Up):
A successful retest and bounce from this support area (currently forming a rounded bottom 🥄) could lead to a bullish move toward the target zone.
This is further supported by the potential RSI bounce from the 40 area, signaling renewed momentum 🔋.
✅ Bias & Conclusion:
Neutral-to-Bullish Bias 🤝: As long as the price holds above the major support zone (~3,180), buyers have a chance to reclaim higher levels.
Look for confirmation breakout above the local resistance (~3,260) for a move toward 3,400+ 🚀.
A breakdown below support would invalidate the bullish thesis and target 3,030 instead 📉.
🛠️ Trading Plan (not financial advice!):
Long Entry: On bullish breakout & retest of ~3,260 ✅
Stop-Loss: Below ~3,180 ⚠️
Target: ~3,420 – 3,460 🎯
Reversal Target: 18,800 USD1. Price Action
The price has been trending within an ascending channel.
It recently touched the upper boundary of this channel and entered a resistance/support zone (marked in red at the top).
The blue arrow suggests a projected breakdown from the channel.
2. Support & Target
The target zone is marked around 18,800 USD, with a label and flag indicating this as a key level.
This zone is also aligned with a previous consolidation area and possibly strong historical support.
3. Indicators
EMAs:
50 EMA (red line): 20,762.7
200 EMA (blue line): 19,861.5
The price is currently above both EMAs, typically bullish, but divergence from the channel and potential resistance may imply an upcoming correction.
RSI:
Currently at 65.03, nearing overbought territory (70).
The RSI shows a bearish divergence—price makes higher highs while RSI stays flat or dips slightly.
4. Implications
If the price breaks below the channel and 50 EMA, a move toward 200 EMA or the marked target zone (around 18,800 USD) is likely.
Traders may look for confirmation via a break of lower trendline support, a strong red candle, or declining volume before entering short.

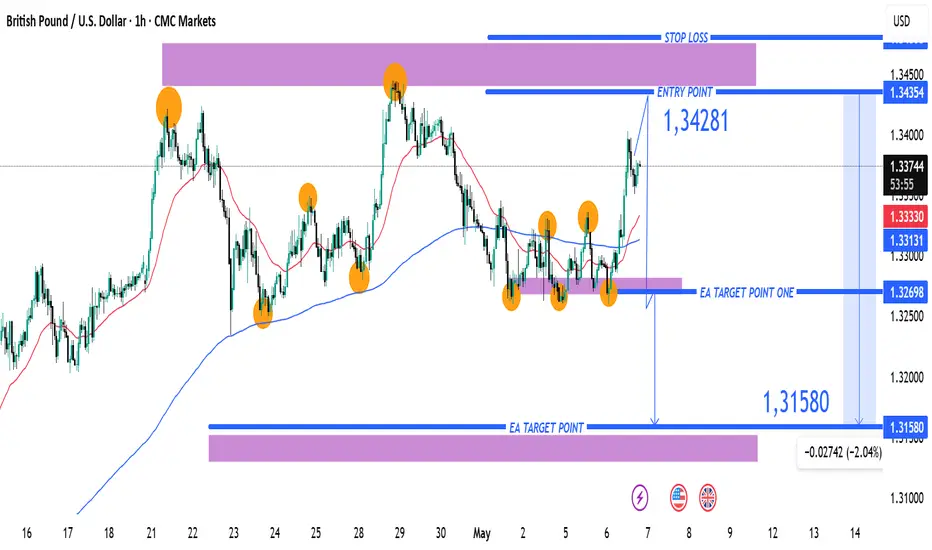
GBP/USD Short Trade Setup – Targeting 1.31580 from 1.34281Entry Point: 1.34281
Stop Loss: 1.34554 (about 27 pips above entry)
Target Points:
Target One: 1.32698
Final Target (EA Target Point): 1.31580 (approx. 270 pips from entry)
Risk/Reward Ratio: Favorable, given the tight stop and wider target.
📈 Chart Features
Highlighted Zones:
Resistance Zone (top purple area): A strong supply zone, where price reversed multiple times.
Support Zone (bottom purple area): Historical demand zone, previous price reactions.
Orange Circles: Represent key swing highs and lows (likely used to confirm the zones or a double/triple top/bottom pattern).
Moving Averages:
Red Line: Likely a shorter-period MA (e.g., 20 EMA).
Blue Line: Likely a longer-period MA (e.g., 50 or 200 EMA), often used for trend confirmation.
🧠 Interpretation
Price Action: The chart suggests the price recently hit a resistance zone and is expected to reverse.
Trade Bias: Bearish – expecting the market to drop from the resistance.
Indicators Support:
Price has rejected multiple times at the top.
Entry is slightly below resistance, confirming a potential reversal.
Targets align with support and past consolidation zones.
EUR/JPY Long Setup – Bullish Reversal from Key Support Zone Entry Point: 162.227
Stop Loss: 161.629
Take Profit (Target): 166.778
Current Price: ~162.798
Risk/Reward Ratio:
Risk: ~60 pips
Reward: ~455 pips
Risk/Reward ≈ 1:7.6 (strong setup)
🔍 Technical Insights
Support Zone:
The purple rectangle around 162.227 to 162.000 is identified as a key demand zone or support area.
Price has tested this zone previously and appears to be bouncing off it.
Price Structure:
The pattern suggests a potential double-bottom or reversal structure forming.
A rounded recovery projection is drawn, implying bullish momentum is expected.
Moving Averages:
A red (shorter period) moving average is crossing below the price.
A blue (longer period) moving average near the support zone could act as dynamic support.
Target Area:
166.778 marks a clear resistance or prior high and is labeled as the “EA Target Point”.
This is a logical profit-taking zone based on past price action.
✅ Bullish Trade Bias Justification
Strong support reaction near entry.
Favorable risk/reward ratio.
Reversal pattern potential.
Confluence with moving average support.
⚠️ Considerations
Ensure confirmation from a bullish candle or reversal signal before entry.
Be mindful of macroeconomic events or EUR/JPY fundamentals that might impact volatility.

BTCUSD UPDATE 15-05-2025This chart shows the Bitcoin (BTC/USD) price action on the 1-hour timeframe, published on TradingView.
Key Details:
Chart Pattern: A distribution phase is visible, forming what appears to be a double or triple top pattern in a resistance zone (highlighted in yellow at the top), which typically signals potential reversal or bearish breakdown.
Current Price: Around $102,265, down by 1.22%.
Support and Resistance Zones:
Resistance: Around $105,600–$105,643
Support: Around $96,000–$97,322
Bearish Projection:
The blue arrow indicates a bearish move is expected, targeting the support zone near $96,000.
This suggests a short position setup, possibly expecting profit-taking at the support zone.
Price Ranges Marked:
Red and green shaded boxes indicate stop-loss and take-profit zones respectively, with risk-reward considerations.
This chart suggests a bearish sentiment in the short term, with the analyst expecting a decline to the lower yellow zone after multiple failed attempts to break resistance.
Let me know if you want technical indicators or further analysis.

"Bearish Reversal Setup with Target at Key Support Zone (95,440 1. EMA Indicators:
50 EMA (red line): Currently at 103,112.73.
200 EMA (blue line): Currently at 98,739.46.
The price is above both EMAs, typically a bullish sign, but the analysis suggests a potential reversal.
2. Support Zone (Top Pink Box):
Around the 105,000–106,000 USD range.
Labeled as "support" but is likely being interpreted as a resistance now due to failure to break higher.
3. Target Zone (Bottom Pink Box):
Around the 95,000–96,000 USD range.
Marked as the "target point" for a potential drop.
4. Bearish Projection:
A curved arrow suggests a rejection from the current levels (~104,000 USD) leading down toward the target zone.
Large blue arrow emphasizes expected bearish momentum.
Interpretation:
The chart suggests a reversal from the recent highs and expects a decline toward the 95,440.94 USD support.
This could be driven by:
Rejection from resistance.
Overbought conditions.
Price losing momentum near the upper level.
Confirmation may be awaited via a break below the 50 EMA or loss of key support.
Strategy Implication:
Short bias if price fails to reclaim the resistance.
Take profit potentially near the 95,440 level.
Invalidation of the bearish scenario may occur on a strong breakout above the resistance zone (~105,700 USD).

WTI Crude Oil (USOIL) Bullish Pullback Setup – Targeting $66.70 Entry Point: Around $62.30 - $62.26
Stop Loss: Set below the entry zone at $61.65, with a potential lower buffer at $60.90
Target Zone (EA TARGET POINT): Between $66.62 and $67.00
A projected gain of 4.22 points (~6.77%)
📈 Price Action & Indicators:
The price had a strong bullish run recently and is now consolidating or pulling back slightly.
The red and blue moving averages (likely short-term and medium-term MAs) show a bullish crossover and trend.
There's a potential bullish setup if the price pulls back to the entry zone and finds support.
The blue curved arrow indicates a projected bounce from the $62.30 support region back up toward the $66.70 target.
🛠️ Strategy Implied:
Wait for pullback to the entry zone (~$62.30).
Enter long at or around that level.
Set Stop Loss at $61.65 to limit downside risk.
Take Profit at $66.70 for a solid risk-reward ratio.
⚠️ Risks:
If support at $62.30 fails, price may head toward $61.65 or lower.
Market volatility (especially with crude oil) can invalidate setups quickly.
Economic events (e.g., U.S. inventory reports, OPEC news) can disrupt technical patterns.

COIN ~ Inverse Head & Shoulders Breakout -- Key Levels- Hello traders! COIN made a massive move today, breaking out of a beautiful Inverse Head & Shoulders pattern. So whats next?
- There are significant resistance levels approaching between $267 and $302 (including the Inverse H&S target level) which could potentially make for a good intraday short trade opportunity.
- Watch for a quick reversal from these levels in the coming days, if you're quick you may be able to catch a short trade.
- Theres no gaurantee that price will bounce from these levels, however this zone will certainly act as significant resistance in the short term.
~ Thanks everyone and best of luck in your trading journey!

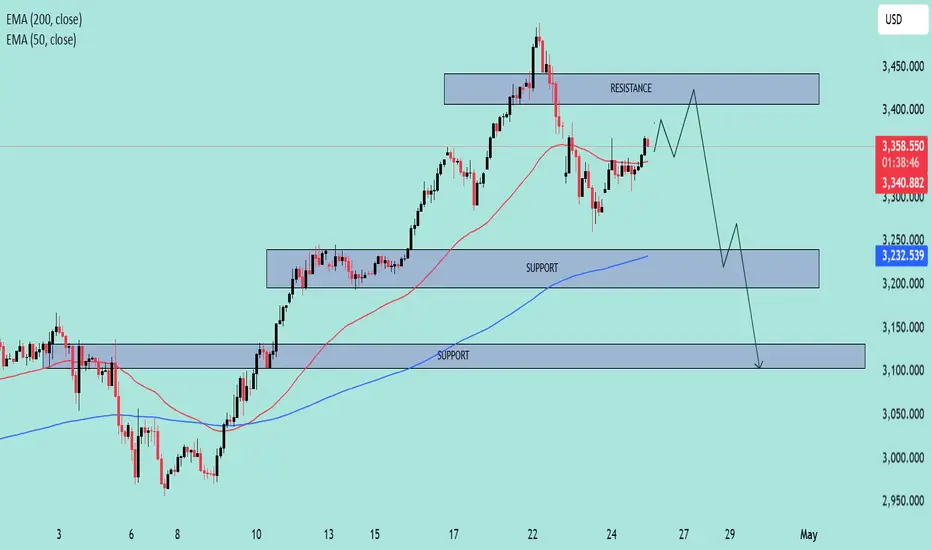
XAUUSD Price Outlook – Bearish Setup in Play ??Asset Overview
The chart represents a price action analysis with support and resistance zones, along with EMA indicators (50 and 200), likely on a 4H or 1H timeframe.
Key Technical Levels
Resistance Zone: ~3,400 to 3,450
First Support Zone: ~3,230 to 3,250
Second Support Zone: ~3,090 to 3,130
Indicators
EMA 50 (Red): Currently around 3,340, acting as dynamic resistance.
EMA 200 (Blue): Positioned near 3,232, reinforcing the first support zone.
Price Action Insight
Price had a strong uptrend, peaking above 3,440 before pulling back.
A lower high may be forming, suggesting possible trend exhaustion.
The current bounce appears to be a retracement back toward resistance or EMA 50.
Projected Move (As Illustrated on Chart)
Short-term bullish move into the resistance zone (~3,400–3,450).
Failure to break above resistance leads to sharp rejection.
Price retraces to first support zone (aligned with EMA 200).
If support fails, deeper drop expected toward the lower support zone (~3,100).
Strategic Notes
📉 Bearish Bias if price fails to break above resistance.
🔍 Watch for bearish candlestick patterns or divergences near resistance.
🛡️ First support aligns with EMA 200, making it a critical level for bulls to defend.
🔻 Breakdown below 3,230 opens room for larger correction to 3,100–3,090.
Conclusion
Currently, the chart suggests a potential short opportunity if price confirms rejection at resistance. The EMA cross structure remains bullish long-term, but momentum is weakening, and failure to reclaim highs could shift sentiment bearish in the short to mid-term.
USD/CHF Reversal Setup (Read-Caption)🧠 Professional Technical Analysis – USD/CHF 💱
🗓️ Date: May 6, 2025
🕰️ Timeframe: Likely 4H or Daily
📊 Current Price: ~0.82218
🔍 Technical Indicators
🔵 EMA 20: 0.84190 (short-term trend)
🔴 EMA 50: 0.82524 (mid-term trend)
❗ Bearish crossover: EMA 20 is below EMA 50 → short-term bearish bias 🐻
📉 Support Zone Analysis 🛡️
🟥 Key Demand Zone (Support): 0.82084 – 0.81437
🔁 Price has bounced here before 🪃
🕯️ Candles with long lower wicks = buyers stepping in 🧍♂️💪
🟠 This is the “bounce zone” 📈
🧭 Trade Idea
✅ Long Entry: Around 0.82084–0.82200
🛑 Stop Loss: Below 0.81437 ❌
🎯 Take Profit: Around 0.83600 🟢
⚖️ Risk/Reward: Excellent (>2:1) if bounce holds 🚀
🔄 Price Action Outlook
📉 Downtrend approaching major support
🕯️ Looking for bullish candlestick confirmation (engulfing, hammer, etc.)
📈 Target area aligns with mean reversion to EMA 20
📌 Conclusion
👀 Watching for bullish reversal signs 🔄
🛒 Buy zone is clearly defined ✅
⛔ Setup is invalidated if price closes below 0.81437

EURNZD Bearish Reversal Confirmed: Break and Retest Below Key Su🧠 Market Context & Structure:
Trend Analysis: The pair is currently in a bearish structure. This is evident from lower highs and lower lows forming after a failed bullish breakout attempt.
Key Zone: A supply zone (highlighted in red) around 1.90198 – 1.90750 has acted as a strong resistance. Price was rejected here after retesting.
Break of Structure (BoS): A clear bearish breakout below the ascending trendline and the horizontal support confirms a shift in sentiment.
📉 Indicators & Confluences:
EMA Analysis:
EMA 50 (red): 1.90757
EMA 200 (blue): 1.90728
Price is trading below both EMAs, which confirms bearish momentum. Also, a bearish EMA crossover (50 crossing below 200) may be forming or has just occurred — a death cross, which further supports downside bias.
🎯 Trade Setup Breakdown (Bearish Bias):
Entry: Around 1.89760 (current price)
Stop Loss: Above the supply zone (~1.9020 - 1.9070)
Take Profit Target: Around 1.86035 (highlighted in green), aligning with previous demand zone or measured move.
Risk-to-Reward Ratio (RRR): Estimated at ~3:1, making this a favorable setup.
🔽 Technical Patterns:
Bear Flag / Rising Wedge: The broken ascending pattern suggests a bearish continuation.
Retest Confirmation: Price retested the broken structure before continuing down — classic bearish retest behavior.
✅ Conclusion:
This is a textbook bearish setup supported by:
A failed breakout and structure shift
Resistance at a key supply zone
Break and retest of support
Price under both EMAs (bearish confirmation)
📌 Bias: Bearish
📌 Invalidation Level: Close above 1.9075
📌 Next Support Zone: 1.8600–1.8550 range

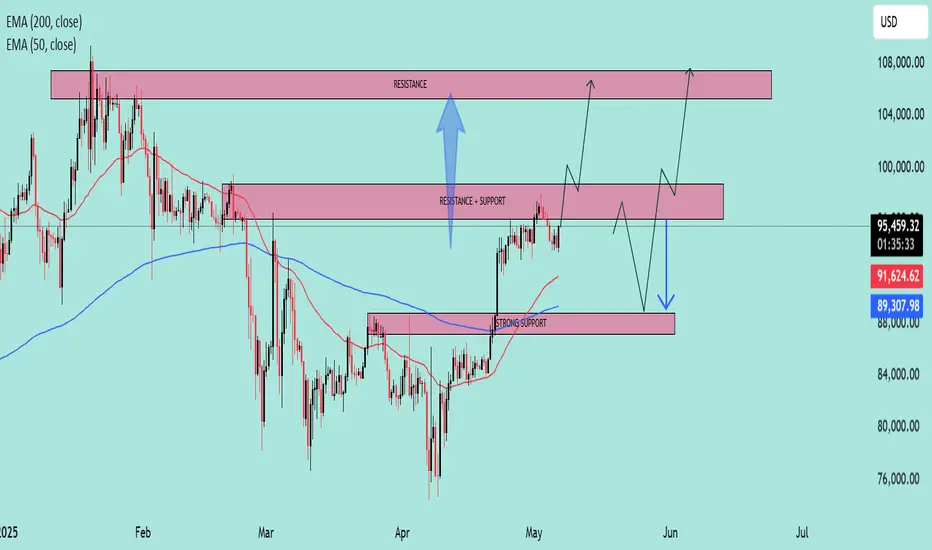
BTC at Key Inflection Zone – Breakout or Rejection Ahead?Asset: BTC/USD
Timeframe: 4H or Daily (based on visual pattern structure)
As of: May 6, 2025
Indicators:
50 EMA (Red): $91,615.79
200 EMA (Blue): $89,305.75
Key Technical Zones:
🔴 Resistance Zone: ~$104,000 – $108,000
This area has historically acted as a major supply zone.
Price has been rejected from this level multiple times, indicating strong selling pressure.
🔁 Flip Zone (Resistance turned Support/Support turned Resistance): ~$95,500 – $100,000
The current price ($95,234.23) is testing this zone from below.
A confirmed break and hold above could signal continuation toward the higher resistance.
🟢 Strong Support Zone: ~$88,000 – $91,000
Confluence of 50 EMA and 200 EMA adds strength to this demand zone.
Previous breakout level and accumulation area.
EMA Outlook:
50 EMA > 200 EMA: Short-term bullish crossover is active, indicating bullish momentum.
Both EMAs are sloping upward slightly, suggesting trend strengthening.
Price is currently above both EMAs, which acts as dynamic support.
Potential Scenarios:
✅ Bullish Scenario:
If price reclaims the $95,500–$100,000 resistance-turned-support zone:
Expect upward momentum to continue.
Target: $104,000–$108,000 zone.
Break of $108K could lead to a macro bull continuation.
⚠️ Bearish Scenario:
If price rejects the current zone and fails to hold above the $91,000 support:
Look for retest of $88,000–$89,000 area (confluence with EMAs).
Breakdown below that zone would invalidate bullish structure and signal potential deeper correction.
Summary:
Bias: Bullish above $91K, Neutral between FWB:88K –$91K, Bearish below $88K.
Key Confirmation Needed: Daily close above $100,000 for strong bullish continuation.
Risk Management: Watch for fakeouts within the $95K–$100K range due to past volatility.
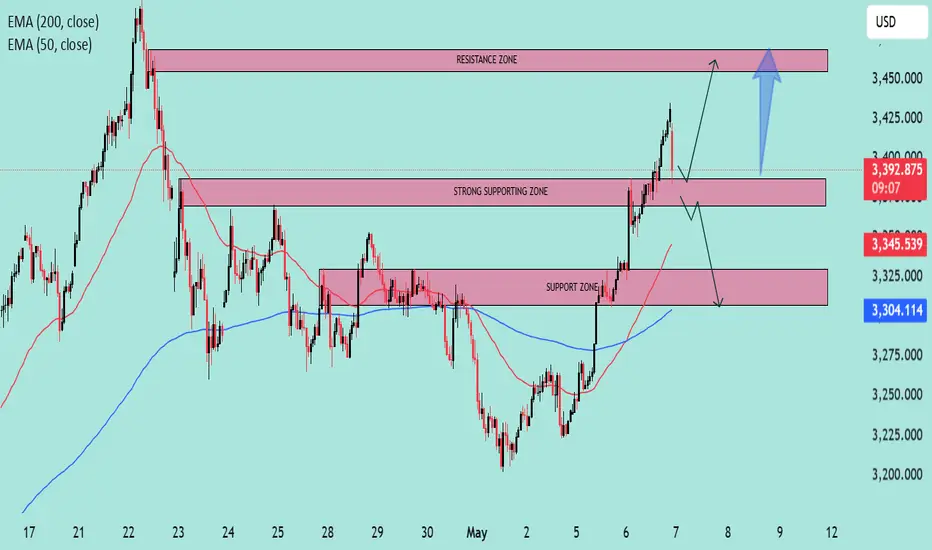
XAUUSD at Critical Support – Bullish Continuation or Pullback 🔍 Market Overview
The chart shows a technical setup with clear support and resistance zones, alongside key Exponential Moving Averages (EMAs) to guide directional bias.
📊 Key Technical Levels
Resistance Zone: ~$3,445–$3,460
This is a historically reactive area where price has reversed sharply in the past. A breakout above this zone would suggest strong bullish continuation.
Strong Supporting Zone: ~$3,375–$3,390
Currently being tested. If the price holds here, it could act as a launchpad for a bullish move toward resistance.
Support Zone: ~$3,320–$3,340
If the strong support breaks, the next downside target would be this zone, which aligns with the 200 EMA (blue line) — a dynamic support level.
📈 Moving Averages
50 EMA (Red): Currently at $3,345.60, serving as a short-term dynamic support.
200 EMA (Blue): Currently at $3,304.13, marking a critical longer-term support. Price staying above this EMA reflects a bullish bias.
🔀 Probable Scenarios
Bullish Case (Preferred Scenario)
If price holds the strong supporting zone and breaks above current highs (~$3,395), it could rally toward the resistance zone at $3,445–$3,460.
Break and close above resistance may open the door for further upside continuation.
Bearish Case
A rejection from current levels or a break below $3,375 would likely lead to a retracement toward the support zone ($3,320–$3,340).
A break below the support zone and the 200 EMA would shift the structure into bearish territory.
✅ Bias & Recommendation
Current Bias: Cautiously Bullish
As long as the price remains above the strong supporting zone and 50 EMA, bulls have the upper hand.
Look for confirmation with a higher low or bullish engulfing candle before entering long.
Trade Idea:
Long Entry: On bullish confirmation above $3,395
Target: $3,445–$3,460
Stop Loss: Below $3,375 (support break)
(XAU/USD) Bearish Trade Setup – Targeting $3,222 with 1:6 Risk/REntry Point: Around 3,409.33 - 3,408.41 USD.
Stop Loss: 3,437.87 USD.
Target (Take Profit): 3,222.53 USD.
Risk/Reward Ratio: Approximately 1:6, which is favorable.
📉 Price Action & Trend Analysis:
A rising wedge (or channel) appears to have formed and broken to the downside — a bearish signal.
The current price at 3,341.47 has broken below a minor support zone (highlighted in purple), indicating bearish momentum.
Price is now approaching the 200 EMA, which is acting as potential dynamic support.
📌 Key Levels Highlighted:
Support Zones: Near 3,347.47 (previous minor support) and 3,222.53 (main target zone).
Resistance Zones: At the entry level and above, near 3,437.87 (Stop Loss zone).
🔄 Indicators:
Moving Averages (Red and Blue Lines): Shorter-term moving average (red) is below the longer-term (blue), indicating downward pressure.
Momentum Shift: The sharp drop suggests a likely continuation of the bearish trend.
