My Market Review for the week 03/06/2025 (Tuesday)Staying bearish for now.
Let me know your thoughts and ideas and of any other pairs you would like me to look at
Indices

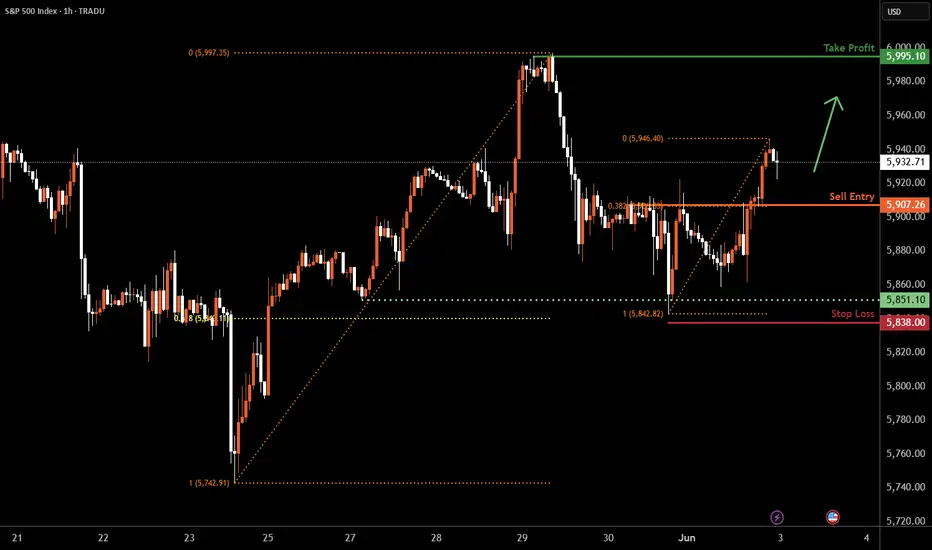
SPX500 H1 | Potential bullish bounceSPX500 is falling towards a pullback support and could potentially bounce off this level to climb higher.
Buy entry is at 5,907.26 which is a pullback support that aligns with the 38.2% Fibonacci retracement.
Stop loss is at 5,838.00 which is a level that lies underneath a multi-swing-low support and the 61.8% Fibonacci retracement.
Take profit is at 5,995.10 which is a swing-high resistance that aligns with the 61.8% Fibonacci retracement.
High Risk Investment Warning
Trading Forex/CFDs on margin carries a high level of risk and may not be suitable for all investors. Leverage can work against you.
Stratos Markets Limited (tradu.com ):
CFDs are complex instruments and come with a high risk of losing money rapidly due to leverage. 63% of retail investor accounts lose money when trading CFDs with this provider. You should consider whether you understand how CFDs work and whether you can afford to take the high risk of losing your money.
Stratos Europe Ltd (tradu.com ):
CFDs are complex instruments and come with a high risk of losing money rapidly due to leverage. 63% of retail investor accounts lose money when trading CFDs with this provider. You should consider whether you understand how CFDs work and whether you can afford to take the high risk of losing your money.
Stratos Global LLC (tradu.com ):
Losses can exceed deposits.
Please be advised that the information presented on TradingView is provided to Tradu (‘Company’, ‘we’) by a third-party provider (‘TFA Global Pte Ltd’). Please be reminded that you are solely responsible for the trading decisions on your account. There is a very high degree of risk involved in trading. Any information and/or content is intended entirely for research, educational and informational purposes only and does not constitute investment or consultation advice or investment strategy. The information is not tailored to the investment needs of any specific person and therefore does not involve a consideration of any of the investment objectives, financial situation or needs of any viewer that may receive it. Kindly also note that past performance is not a reliable indicator of future results. Actual results may differ materially from those anticipated in forward-looking or past performance statements. We assume no liability as to the accuracy or completeness of any of the information and/or content provided herein and the Company cannot be held responsible for any omission, mistake nor for any loss or damage including without limitation to any loss of profit which may arise from reliance on any information supplied by TFA Global Pte Ltd.
The speaker(s) is neither an employee, agent nor representative of Tradu and is therefore acting independently. The opinions given are their own, constitute general market commentary, and do not constitute the opinion or advice of Tradu or any form of personal or investment advice. Tradu neither endorses nor guarantees offerings of third-party speakers, nor is Tradu responsible for the content, veracity or opinions of third-party speakers, presenters or participants.
DOW JONES: Inverse Head and Shoulders looking for a breakout.Dow Jones is marginally bullish on its 1D technical outlook (RSI = 55.600, MACD = 267.860, ADX = 21.901) as just now it is attempting to be detached from the 4H MA50. Technically this could be the attempt to break towards the 2.0 Fibonacci extension, after having formed the RS of an Inverse head and Shoulders pattern. With the 4H MACD close to a Bullish Cross, we are bullish, TP = 44,250.
## If you like our free content follow our profile to get more daily ideas. ##
## Comments and likes are greatly appreciated. ##

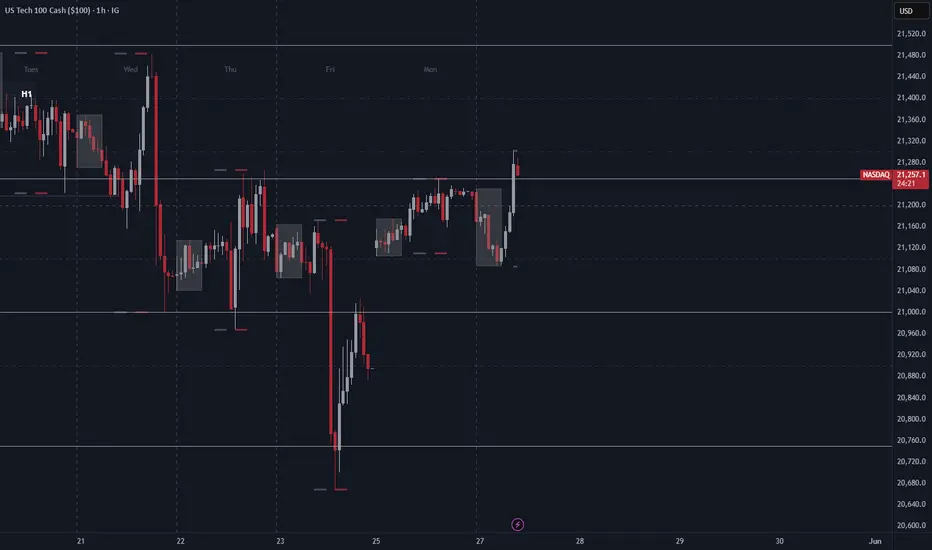
Nasdaq giving hints of bearishness failing to close above rangePlease review what I think I'm seeing. If you have any comments in regard to these potential levels they are always welcome.
I believe we may be actually bearish from here but without a daily close below the highest block, my decided choice must be neutral. Purely mechanical analysis will save your portfolio 💎
Don't forget to subscribe & share this with someone who is learning 🙏🏾

Nasdaq-100 H4 | Approaching an overlap supportThe Nasdaq-100 (NAS100) is falling towards an overlap support and could potentially bounce off this level to climb higher.
Buy entry is at 20,833.76 which is an overlap support that aligns with the 23.6% Fibonacci retracement.
Stop loss is at 20,100.00 which is a level that lies underneath a pullback support and the 38.2% Fibonacci retracement.
Take profit is at 21,763.98 which is a swing-high resistance.
High Risk Investment Warning
Trading Forex/CFDs on margin carries a high level of risk and may not be suitable for all investors. Leverage can work against you.
Stratos Markets Limited (tradu.com ):
CFDs are complex instruments and come with a high risk of losing money rapidly due to leverage. 63% of retail investor accounts lose money when trading CFDs with this provider. You should consider whether you understand how CFDs work and whether you can afford to take the high risk of losing your money.
Stratos Europe Ltd (tradu.com ):
CFDs are complex instruments and come with a high risk of losing money rapidly due to leverage. 63% of retail investor accounts lose money when trading CFDs with this provider. You should consider whether you understand how CFDs work and whether you can afford to take the high risk of losing your money.
Stratos Global LLC (tradu.com ):
Losses can exceed deposits.
Please be advised that the information presented on TradingView is provided to Tradu (‘Company’, ‘we’) by a third-party provider (‘TFA Global Pte Ltd’). Please be reminded that you are solely responsible for the trading decisions on your account. There is a very high degree of risk involved in trading. Any information and/or content is intended entirely for research, educational and informational purposes only and does not constitute investment or consultation advice or investment strategy. The information is not tailored to the investment needs of any specific person and therefore does not involve a consideration of any of the investment objectives, financial situation or needs of any viewer that may receive it. Kindly also note that past performance is not a reliable indicator of future results. Actual results may differ materially from those anticipated in forward-looking or past performance statements. We assume no liability as to the accuracy or completeness of any of the information and/or content provided herein and the Company cannot be held responsible for any omission, mistake nor for any loss or damage including without limitation to any loss of profit which may arise from reliance on any information supplied by TFA Global Pte Ltd.
The speaker(s) is neither an employee, agent nor representative of Tradu and is therefore acting independently. The opinions given are their own, constitute general market commentary, and do not constitute the opinion or advice of Tradu or any form of personal or investment advice. Tradu neither endorses nor guarantees offerings of third-party speakers, nor is Tradu responsible for the content, veracity or opinions of third-party speakers, presenters or participants.

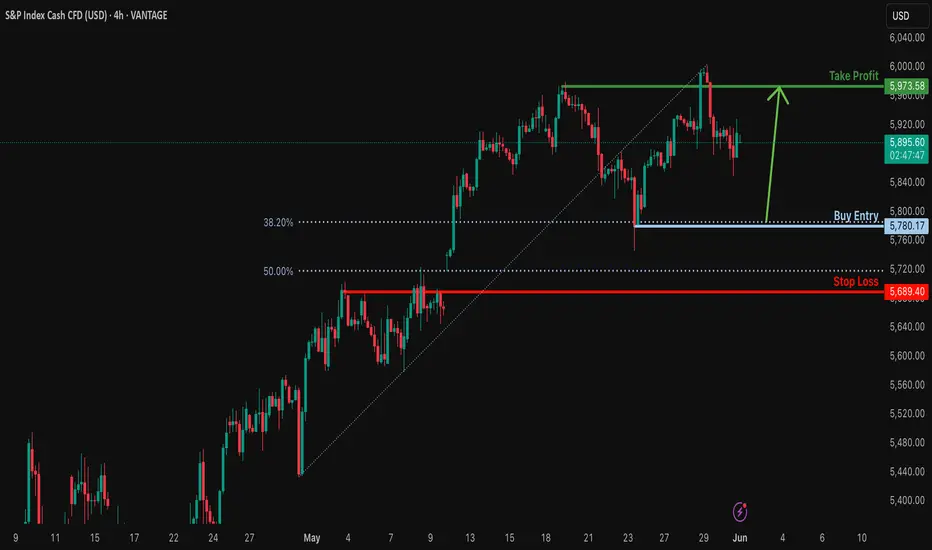
Falling towards pullback support?S&P500 is falling towards the support level which is a pullback support that aligns with the 38.2% Fibonacci retracement and could bounce from this level to our take profit.
Entry: 5,780.17
Why we like it:
There is a pullback support level that lines up with the 38.2% Fibonacci retracement.
Stop loss: 5,689.40
Why we like it:
There is a pullback support level that is slightly below the 50% Fibonacci retracement.
Take profit: 5,973.58
Why we like it:
There is a pullback resistance level.
Enjoying your TradingView experience? Review us!
Please be advised that the information presented on TradingView is provided to Vantage (‘Vantage Global Limited’, ‘we’) by a third-party provider (‘Everest Fortune Group’). Please be reminded that you are solely responsible for the trading decisions on your account. There is a very high degree of risk involved in trading. Any information and/or content is intended entirely for research, educational and informational purposes only and does not constitute investment or consultation advice or investment strategy. The information is not tailored to the investment needs of any specific person and therefore does not involve a consideration of any of the investment objectives, financial situation or needs of any viewer that may receive it. Kindly also note that past performance is not a reliable indicator of future results. Actual results may differ materially from those anticipated in forward-looking or past performance statements. We assume no liability as to the accuracy or completeness of any of the information and/or content provided herein and the Company cannot be held responsible for any omission, mistake nor for any loss or damage including without limitation to any loss of profit which may arise from reliance on any information supplied by Everest Fortune Group.
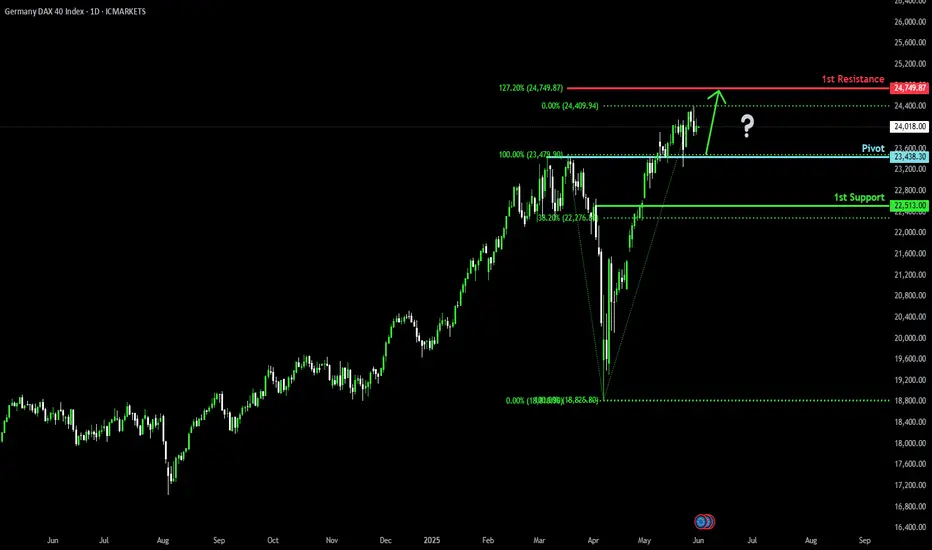
Bullish continuation?DAX40 (DE40) is falling towards the pivot and could bounce to the 1st resistance.
Pivot: 23,438.30
1st Support: 22,513.00
1st Resistance: 24,749.87
Risk Warning:
Trading Forex and CFDs carries a high level of risk to your capital and you should only trade with money you can afford to lose. Trading Forex and CFDs may not be suitable for all investors, so please ensure that you fully understand the risks involved and seek independent advice if necessary.
Disclaimer:
The above opinions given constitute general market commentary, and do not constitute the opinion or advice of IC Markets or any form of personal or investment advice.
Any opinions, news, research, analyses, prices, other information, or links to third-party sites contained on this website are provided on an "as-is" basis, are intended only to be informative, is not an advice nor a recommendation, nor research, or a record of our trading prices, or an offer of, or solicitation for a transaction in any financial instrument and thus should not be treated as such. The information provided does not involve any specific investment objectives, financial situation and needs of any specific person who may receive it. Please be aware, that past performance is not a reliable indicator of future performance and/or results. Past Performance or Forward-looking scenarios based upon the reasonable beliefs of the third-party provider are not a guarantee of future performance. Actual results may differ materially from those anticipated in forward-looking or past performance statements. IC Markets makes no representation or warranty and assumes no liability as to the accuracy or completeness of the information provided, nor any loss arising from any investment based on a recommendation, forecast or any information supplied by any third-party.
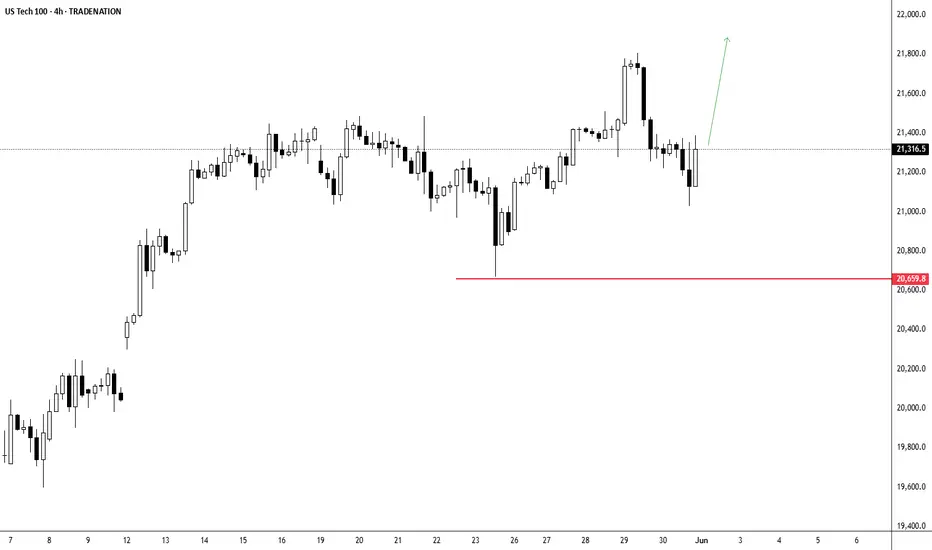
US100 - Bullish Momentum Favors Upside ContinuationThe US Tech 100 is displaying strong bullish momentum after successfully breaking above the critical resistance level at 20,659.8, which had previously acted as a significant barrier. Currently trading at 21,316 the index has demonstrated impressive upward trajectory following what appears to be a healthy consolidation phase around the key resistance-turned-support zone. The technical setup strongly favors continuation to the upside as the higher probability scenario, with the breakout above 20,659.8 potentially opening the door for further gains toward higher resistance levels. However, prudent risk management suggests taking this rally piece by piece, monitoring how price action develops at each significant level while watching for any signs of exhaustion or pullback that might offer better entry opportunities. The bullish bias remains intact as long as the index maintains its position above the former resistance level, which should now serve as dynamic support for any potential retracements.
Disclosure: I am part of Trade Nation's Influencer program and receive a monthly fee for using their TradingView charts in my analysis.
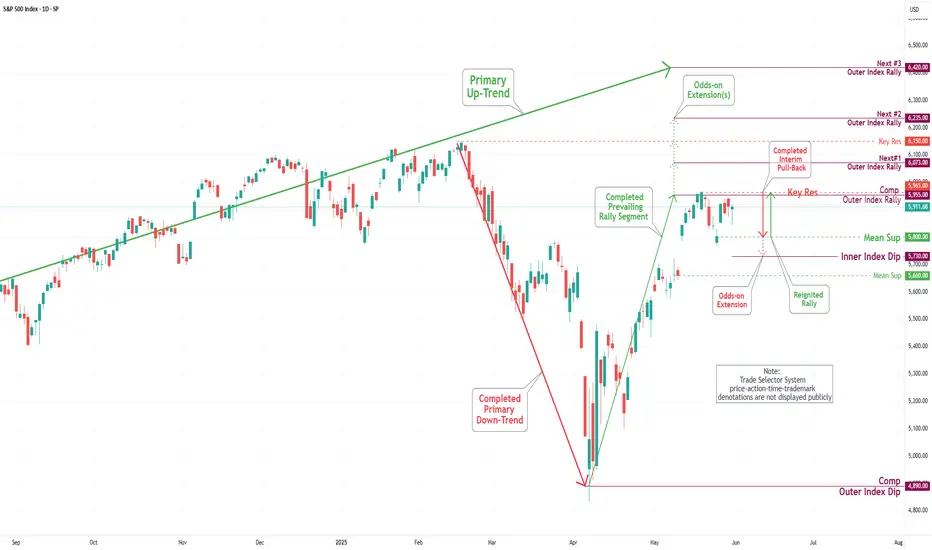
S&P 500 Daily Chart Analysis For Week of May 30, 2025Technical Analysis and Outlook:
The S&P 500 Index has undergone considerable price fluctuations during the trading sessions of this week, successfully reaching a critical target at the Mean Support level of 5800. Presently, the index is exhibiting an upward trend with a focus on the retest of the Inner Index Dip at 5955 and Key Resistance at 5965. Furthermore, additional significant levels have been identified, including the Next#1 Outer Index Rally at 6073, Key Resistance at 6150, and the Next#2 Outer Index Rally at 6235. Conversely, there is a potential for the index prices to downfall aiming to retest Mean Support 5800 and to complete the Outer Index Dip, noted at 5730.
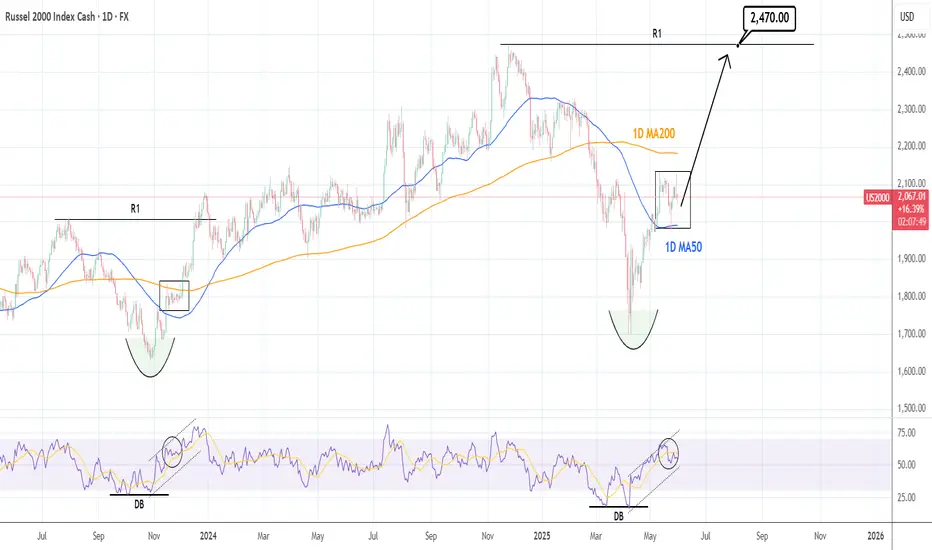
RUSSELL: Short term consolidation before ATH test.Russell is technically neutral on its 1D outlook (RSI = 55.323, MACD = 20.400, ADX = 20.042) as for the whole month of May it is trading sideways inside the 1D MA50 and 1D MA200. April's bottom and the subsequent RSI DB rebound, is very much like the October 27th 2023 bottom. The rebound that was followed, also had the index consolidate between the 1D MA50 and 1D MA200 and soon after it resumed the uptrend to cross above the R1 level (prior High) before pulling back to the 1D MA50 again. Based on that we remain bullish on Russell, aiming for the R1 (TP = 2,470).
## If you like our free content follow our profile to get more daily ideas. ##
## Comments and likes are greatly appreciated. ##
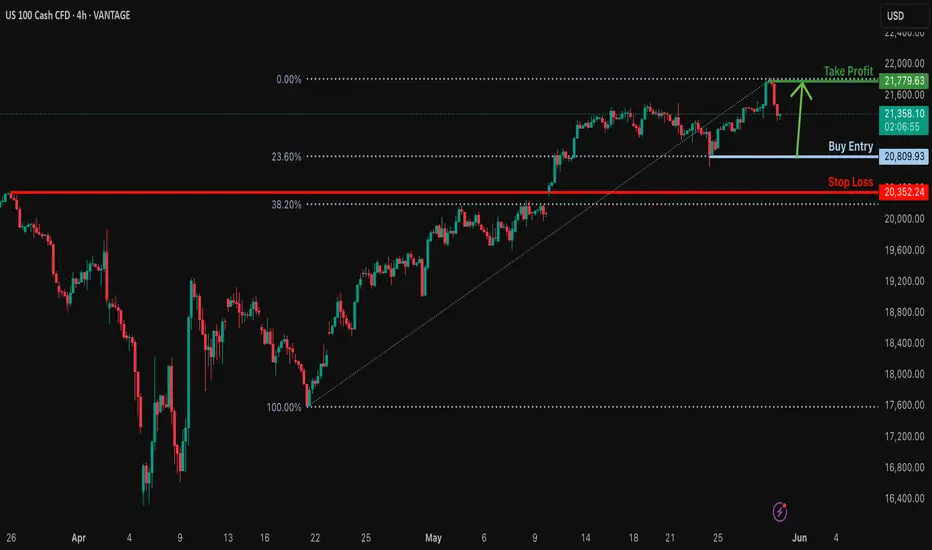
Falling towards pullback support?NAS100 is falling towards the support level which is a pullback support that lines up with the 23.6% Fibonacci retracement and could bounce from this level to our take profit.
Entry: 20,809.93
Why we like it:
There is a pullback support level that aligns with the 23.6% Fibonacci retracement.
Stop loss: 20,352.24
Why we like it:
There is a pullback support level that is slightly above the 38.2% Fibonacci retracement.
Take profit: 21,779.63
Why we like it:
There is a pullback resistance level.
Enjoying your TradingView experience? Review us!
Please be advised that the information presented on TradingView is provided to Vantage (‘Vantage Global Limited’, ‘we’) by a third-party provider (‘Everest Fortune Group’). Please be reminded that you are solely responsible for the trading decisions on your account. There is a very high degree of risk involved in trading. Any information and/or content is intended entirely for research, educational and informational purposes only and does not constitute investment or consultation advice or investment strategy. The information is not tailored to the investment needs of any specific person and therefore does not involve a consideration of any of the investment objectives, financial situation or needs of any viewer that may receive it. Kindly also note that past performance is not a reliable indicator of future results. Actual results may differ materially from those anticipated in forward-looking or past performance statements. We assume no liability as to the accuracy or completeness of any of the information and/or content provided herein and the Company cannot be held responsible for any omission, mistake nor for any loss or damage including without limitation to any loss of profit which may arise from reliance on any information supplied by Everest Fortune Group.
Bullish bounce off overlap support?S&P500 is falling towards the support level which is an overlap support that lines up with the 23.6% Fibonacci retracement and could bounce from this level to our take profit.
Entry: 5,784.04
Why we like it:
There is an overlap support level that aligns with the 23.6% Fibonacci retracement.
Stop loss: 5,689.40
Why we like it:
There is a pullback support level that is slightly above the 38.2% Fibonacci retracement.
Take profit: 5,973.58
Why we like it:
There is a pullback resistance level.
Enjoying your TradingView experience? Review us!
Please be advised that the information presented on TradingView is provided to Vantage (‘Vantage Global Limited’, ‘we’) by a third-party provider (‘Everest Fortune Group’). Please be reminded that you are solely responsible for the trading decisions on your account. There is a very high degree of risk involved in trading. Any information and/or content is intended entirely for research, educational and informational purposes only and does not constitute investment or consultation advice or investment strategy. The information is not tailored to the investment needs of any specific person and therefore does not involve a consideration of any of the investment objectives, financial situation or needs of any viewer that may receive it. Kindly also note that past performance is not a reliable indicator of future results. Actual results may differ materially from those anticipated in forward-looking or past performance statements. We assume no liability as to the accuracy or completeness of any of the information and/or content provided herein and the Company cannot be held responsible for any omission, mistake nor for any loss or damage including without limitation to any loss of profit which may arise from reliance on any information supplied by Everest Fortune Group.

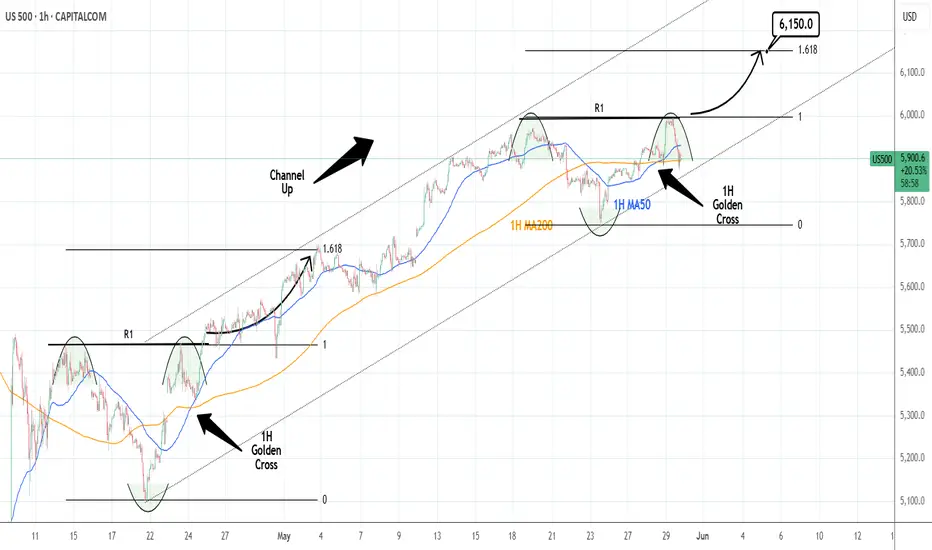
S&P500: Inverse Head and Shoulders set to extend Apr-May rally.The S&P500 is bullish on its 1D technical outlook (RSI = 58.868, MACD = 85.480, ADX = 31.901) as it maintains a steady Channel Up pattern and just formed the first 1H Golden Cross in a month. Technically this is forming the Right Shoulder of an Inverse Head and Shoulders pattern, typically a bullish reversal formation, which not surprisingly was last seen in April when the Channel Up started and was completed with the previous 1H Golden Cross on April 24th. The result was a bullish extension fo rht 1.618 Fibonacci level. We're bullish on this, TP = 6,150.
## If you like our free content follow our profile to get more daily ideas. ##
## Comments and likes are greatly appreciated. ##
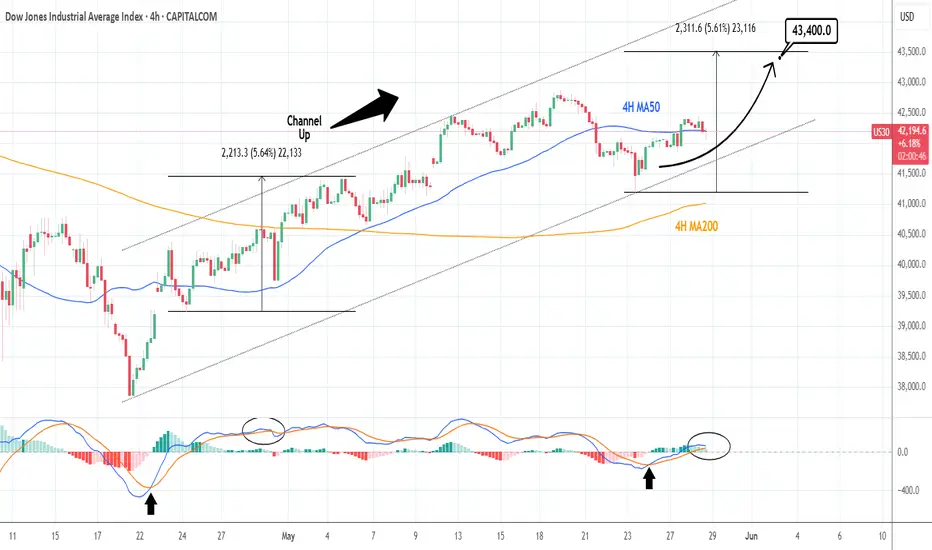
DOW JONES: Channel Up targeting 43,400.Dow Jones is practically neutral on its 1D technical outlook (RSI = 55.880, MACD = 380.350, ADX = 13.770) as the price is consolidating on its 4H MA50. Despite the neutrality, it remains inside the Channel Up, that is supported by the 4H MA200 and whose 4H RSI squeeze indicates we might be on a similar slow uptrend as late April's. We expect a similar +5.60% rise from the HL bottom, TP = 43,300.
## If you like our free content follow our profile to get more daily ideas. ##
## Comments and likes are greatly appreciated. ##
SHORT ON SPY (SPX/USD)Spy has given us bearish divergence at a major supply zone.
I will be selling spy to the next support level.
Today is FOMC and I expecting it to influence spy move to the downside.

DAX: Continues higher?Huge drop on the left side which happens to reset the trend similar to NAS. Maybe DAX could continue to rally from this point forward, however, there is a huge gap that hasn't been filled yet.

NASDAQ: More Bullish MovementsHuge drop on the left side which happens to reset the trend. Maybe NAS could continue to rally from this point forward
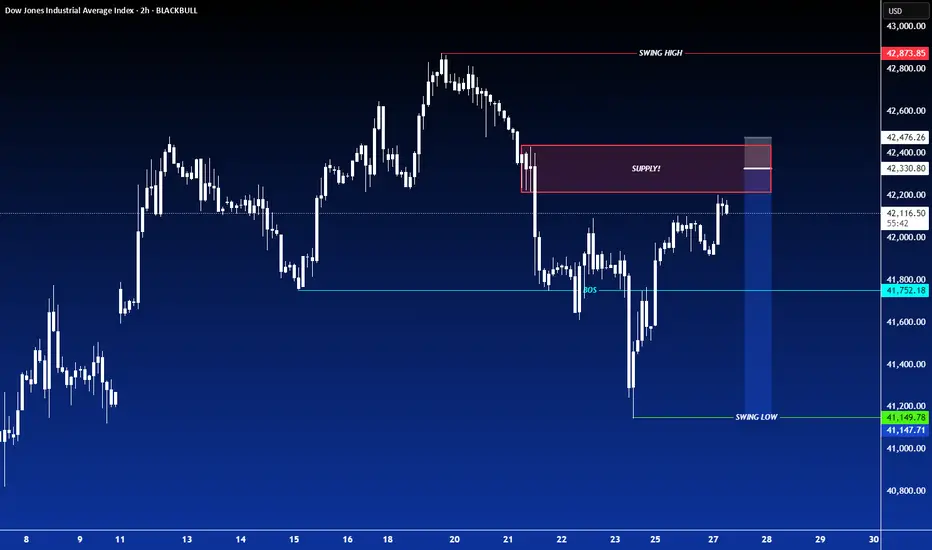
SHORT ON US30US30 Has given us a nice pullback to a major supply area.
I am expecting price to rise a little higher into the supply are then give us a major drop to the previous swing low for over 1000 points!!!
I have placed a sell limit order withing the supply area looking to short us30 for the rest of the week.
Nikkei H4 | Falling toward a multi-swing-low supportNikkei (JPN225) is falling towards a multi-swing-low support and could potentially bounce off this level to climb higher.
Buy entry is at 36,688.39 which is a multi-swing-low support that aligns with the 23.6% Fibonacci retracement.
Stop loss is at 35,300.00 which is a level that lies underneath an overlap support and the 38.2% Fibonacci retracement.
Take profit is at 38,831.79 which is a swing-high resistance.
High Risk Investment Warning
Trading Forex/CFDs on margin carries a high level of risk and may not be suitable for all investors. Leverage can work against you.
Stratos Markets Limited (tradu.com ):
CFDs are complex instruments and come with a high risk of losing money rapidly due to leverage. 63% of retail investor accounts lose money when trading CFDs with this provider. You should consider whether you understand how CFDs work and whether you can afford to take the high risk of losing your money.
Stratos Europe Ltd (tradu.com ):
CFDs are complex instruments and come with a high risk of losing money rapidly due to leverage. 63% of retail investor accounts lose money when trading CFDs with this provider. You should consider whether you understand how CFDs work and whether you can afford to take the high risk of losing your money.
Stratos Global LLC (tradu.com ):
Losses can exceed deposits.
Please be advised that the information presented on TradingView is provided to Tradu (‘Company’, ‘we’) by a third-party provider (‘TFA Global Pte Ltd’). Please be reminded that you are solely responsible for the trading decisions on your account. There is a very high degree of risk involved in trading. Any information and/or content is intended entirely for research, educational and informational purposes only and does not constitute investment or consultation advice or investment strategy. The information is not tailored to the investment needs of any specific person and therefore does not involve a consideration of any of the investment objectives, financial situation or needs of any viewer that may receive it. Kindly also note that past performance is not a reliable indicator of future results. Actual results may differ materially from those anticipated in forward-looking or past performance statements. We assume no liability as to the accuracy or completeness of any of the information and/or content provided herein and the Company cannot be held responsible for any omission, mistake nor for any loss or damage including without limitation to any loss of profit which may arise from reliance on any information supplied by TFA Global Pte Ltd.
The speaker(s) is neither an employee, agent nor representative of Tradu and is therefore acting independently. The opinions given are their own, constitute general market commentary, and do not constitute the opinion or advice of Tradu or any form of personal or investment advice. Tradu neither endorses nor guarantees offerings of third-party speakers, nor is Tradu responsible for the content, veracity or opinions of third-party speakers, presenters or participants.

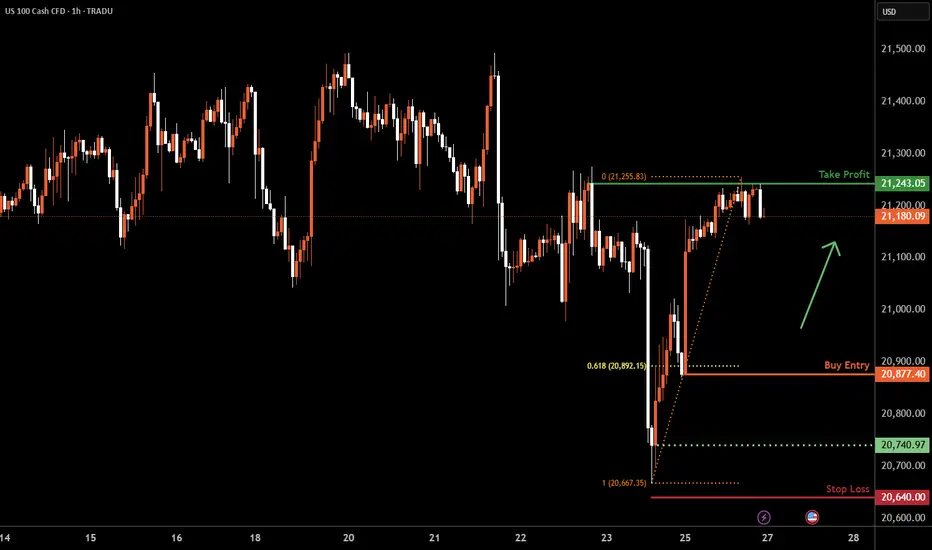
Nasdaq-100 H1 | Swing-low support at 61.8% Fibonacci retracementNasdaq-100 (NAS100) is falling towards a swing-low support and could potentially bounce off this level to climb higher.
Buy entry is at 20,877.40 which is a swing-low support that aligns with the 61.8% Fibonacci retracement.
Stop loss is at 20,640.00 which is a level that lies underneath a swing-low support.
Take profit is at 21,243.05 which is a multi-swing-high resistance.
High Risk Investment Warning
Trading Forex/CFDs on margin carries a high level of risk and may not be suitable for all investors. Leverage can work against you.
Stratos Markets Limited (tradu.com ):
CFDs are complex instruments and come with a high risk of losing money rapidly due to leverage. 63% of retail investor accounts lose money when trading CFDs with this provider. You should consider whether you understand how CFDs work and whether you can afford to take the high risk of losing your money.
Stratos Europe Ltd (tradu.com ):
CFDs are complex instruments and come with a high risk of losing money rapidly due to leverage. 63% of retail investor accounts lose money when trading CFDs with this provider. You should consider whether you understand how CFDs work and whether you can afford to take the high risk of losing your money.
Stratos Global LLC (tradu.com ):
Losses can exceed deposits.
Please be advised that the information presented on TradingView is provided to Tradu (‘Company’, ‘we’) by a third-party provider (‘TFA Global Pte Ltd’). Please be reminded that you are solely responsible for the trading decisions on your account. There is a very high degree of risk involved in trading. Any information and/or content is intended entirely for research, educational and informational purposes only and does not constitute investment or consultation advice or investment strategy. The information is not tailored to the investment needs of any specific person and therefore does not involve a consideration of any of the investment objectives, financial situation or needs of any viewer that may receive it. Kindly also note that past performance is not a reliable indicator of future results. Actual results may differ materially from those anticipated in forward-looking or past performance statements. We assume no liability as to the accuracy or completeness of any of the information and/or content provided herein and the Company cannot be held responsible for any omission, mistake nor for any loss or damage including without limitation to any loss of profit which may arise from reliance on any information supplied by TFA Global Pte Ltd.
The speaker(s) is neither an employee, agent nor representative of Tradu and is therefore acting independently. The opinions given are their own, constitute general market commentary, and do not constitute the opinion or advice of Tradu or any form of personal or investment advice. Tradu neither endorses nor guarantees offerings of third-party speakers, nor is Tradu responsible for the content, veracity or opinions of third-party speakers, presenters or participants.
NASDAQ: Needs to reclaim the 4H MA50.Nasdaq is bullish on its 1D technical outlook (RSI = 62.436, MACD = 467.180, ADX = 28.529) as it maintains its long term bullish trend through the Channel Up pattern, which recently is transitioning into a Rising Wedge. We are willing to turn bullish again upon a 4H candle closing over the 4H MA50 and aim for a +11.17% rise (TP = 23,000) on the HH trendline, like the April 21st rebound did.
## If you like our free content follow our profile to get more daily ideas. ##
## Comments and likes are greatly appreciated. ##

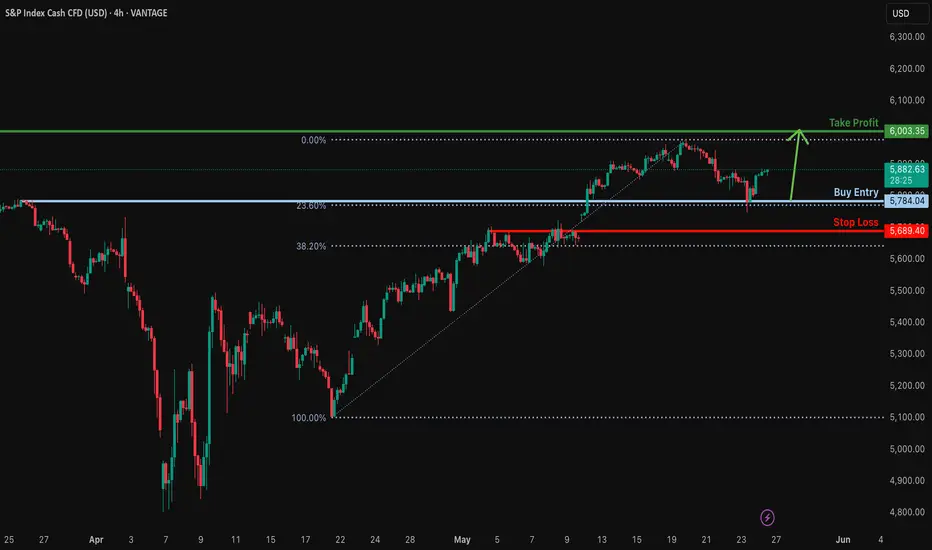
Bullish continuation?S&P500 has bounced off the support level which is a pullback support that aligns with the 23.6% Fibonacci retracement and could potentially rise from this level to our take profit.
Entry: 5,784.04
Why we like it:
There is a pullback support level that lines up with the 23.6% Fibonacci retracement.
Stop loss: 5,689.40
Why we lik eit:
There is a pullback support level that is slightly above the 38.2% Fibonacci retracement.
Take profit: 6,003.35
Why we like it:
There is a pullback resistance level.
Enjoying your TradingView experience? Review us!
Please be advised that the information presented on TradingView is provided to Vantage (‘Vantage Global Limited’, ‘we’) by a third-party provider (‘Everest Fortune Group’). Please be reminded that you are solely responsible for the trading decisions on your account. There is a very high degree of risk involved in trading. Any information and/or content is intended entirely for research, educational and informational purposes only and does not constitute investment or consultation advice or investment strategy. The information is not tailored to the investment needs of any specific person and therefore does not involve a consideration of any of the investment objectives, financial situation or needs of any viewer that may receive it. Kindly also note that past performance is not a reliable indicator of future results. Actual results may differ materially from those anticipated in forward-looking or past performance statements. We assume no liability as to the accuracy or completeness of any of the information and/or content provided herein and the Company cannot be held responsible for any omission, mistake nor for any loss or damage including without limitation to any loss of profit which may arise from reliance on any information supplied by Everest Fortune Group.
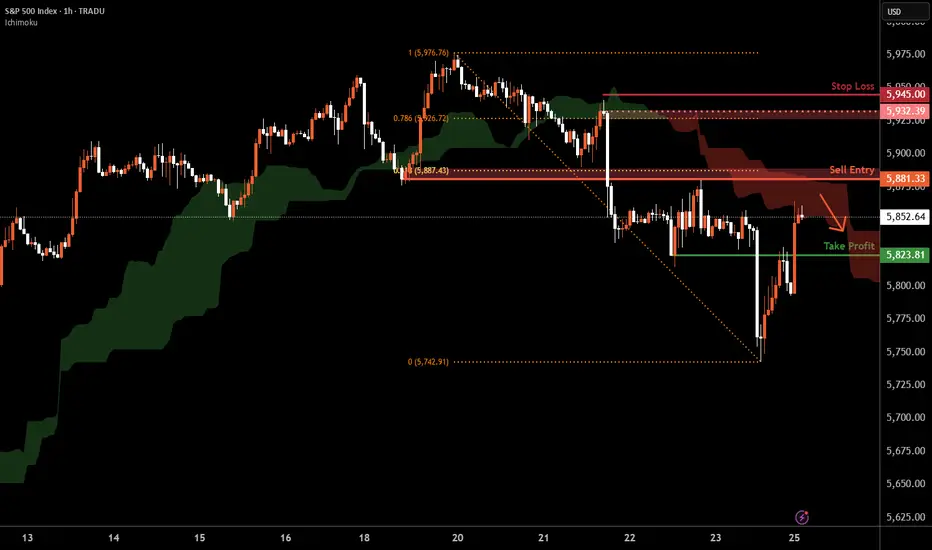
SPX500 H1 | Overlap resistance at 61.8% Fibonacci retracementSPX500 is rising towards an overlap resistance and could potentially reverse off this level to drop lower.
Sell entry is at 5,881.33 which is an overlap resistance that aligns close to the 61.8% Fibonacci retracement.
Stop loss is at 5,945.00 which is a level that sits above the 78.6% Fibonacci retracement and a swing-high resistance.
Take profit is at 5,823.81 which is an overlap support.
High Risk Investment Warning
Trading Forex/CFDs on margin carries a high level of risk and may not be suitable for all investors. Leverage can work against you.
Stratos Markets Limited (tradu.com ):
CFDs are complex instruments and come with a high risk of losing money rapidly due to leverage. 63% of retail investor accounts lose money when trading CFDs with this provider. You should consider whether you understand how CFDs work and whether you can afford to take the high risk of losing your money.
Stratos Europe Ltd (tradu.com ):
CFDs are complex instruments and come with a high risk of losing money rapidly due to leverage. 63% of retail investor accounts lose money when trading CFDs with this provider. You should consider whether you understand how CFDs work and whether you can afford to take the high risk of losing your money.
Stratos Global LLC (tradu.com ):
Losses can exceed deposits.
Please be advised that the information presented on TradingView is provided to Tradu (‘Company’, ‘we’) by a third-party provider (‘TFA Global Pte Ltd’). Please be reminded that you are solely responsible for the trading decisions on your account. There is a very high degree of risk involved in trading. Any information and/or content is intended entirely for research, educational and informational purposes only and does not constitute investment or consultation advice or investment strategy. The information is not tailored to the investment needs of any specific person and therefore does not involve a consideration of any of the investment objectives, financial situation or needs of any viewer that may receive it. Kindly also note that past performance is not a reliable indicator of future results. Actual results may differ materially from those anticipated in forward-looking or past performance statements. We assume no liability as to the accuracy or completeness of any of the information and/or content provided herein and the Company cannot be held responsible for any omission, mistake nor for any loss or damage including without limitation to any loss of profit which may arise from reliance on any information supplied by TFA Global Pte Ltd.
The speaker(s) is neither an employee, agent nor representative of Tradu and is therefore acting independently. The opinions given are their own, constitute general market commentary, and do not constitute the opinion or advice of Tradu or any form of personal or investment advice. Tradu neither endorses nor guarantees offerings of third-party speakers, nor is Tradu responsible for the content, veracity or opinions of third-party speakers, presenters or participants.