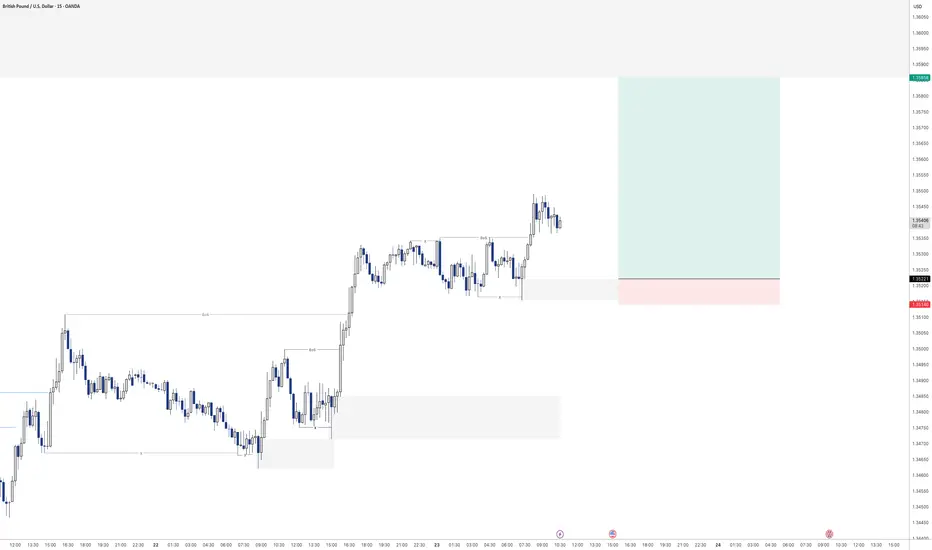
GBPUSD - Next buy from demandLooking here for potential further buying momentum to the upside.
Will see how this plays out tomorrow
Inducement
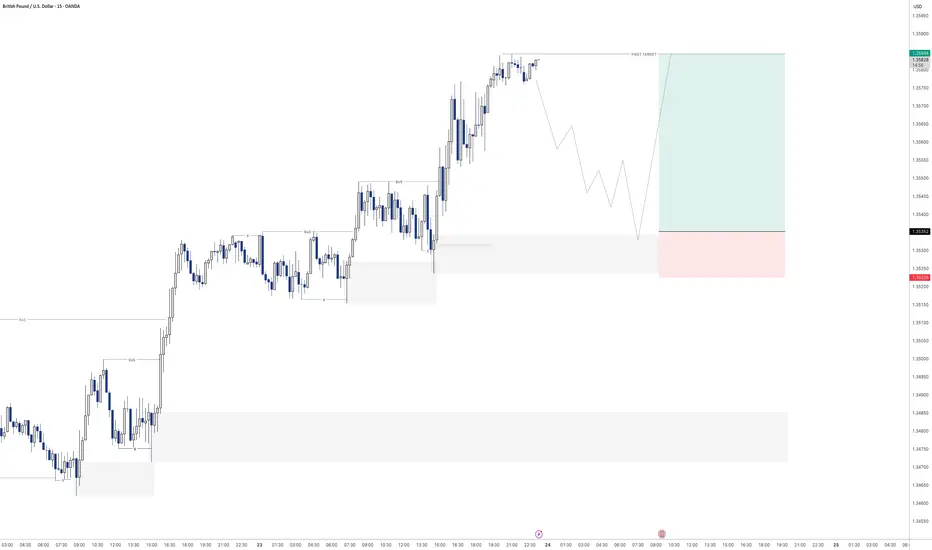
GBPUSD - Buying continuationLooking to keep buying the bullish orderflow on the 15min.
Had a nice sweep of liquidity before creating a new high. Will see how this one plays out over the day
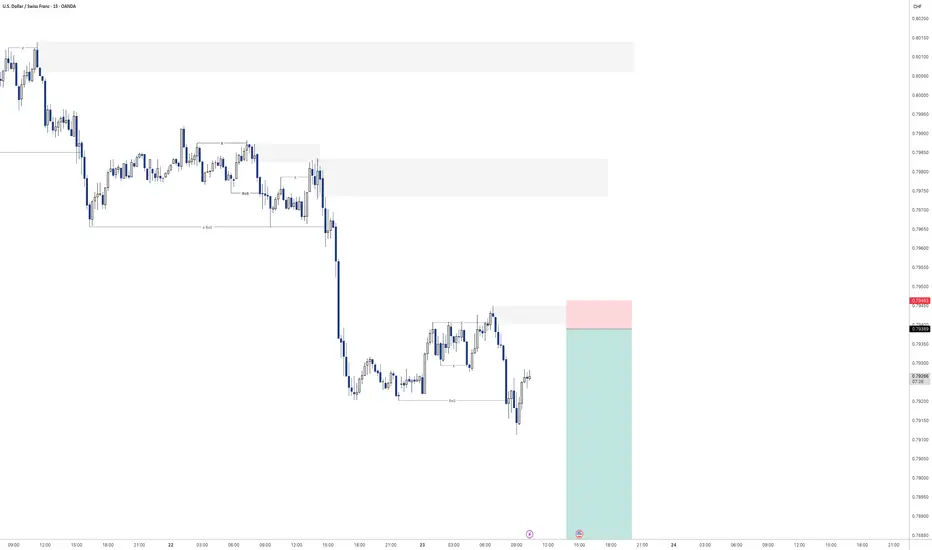
USDCHF - Sell off continuation?Looking for continuation of the selling pressure here on USDCHF
Will see how we play out for the rest of the day
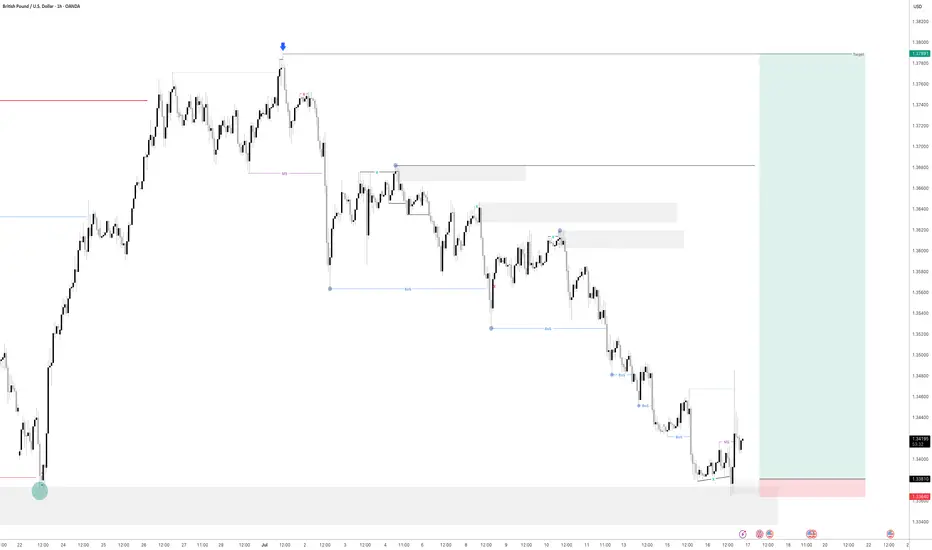
GBPUSD - Is it Ready? Looking at GBPUSD
We have had a Market shift to the upside from a HTF Point of Interest. I am now waiting for price to come back into a 15min demand area and hopefully price will take off to the upside from here.
We have also swept liquidity before a drastic move to the upside.
Lets see how this one plays out
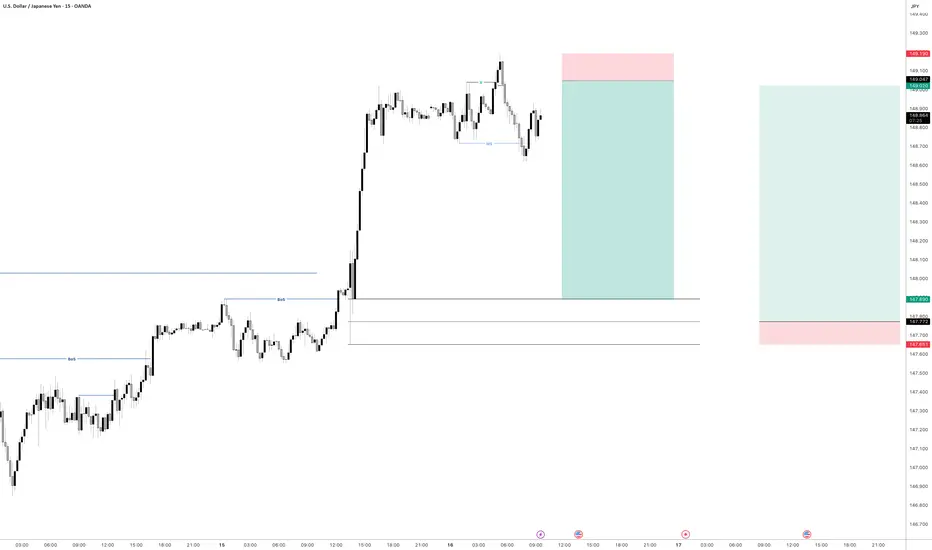
USDJPY - Time to sell short term i believeHave a pending order waiting to be triggered on UJ
Will see how we go if we get tagged in
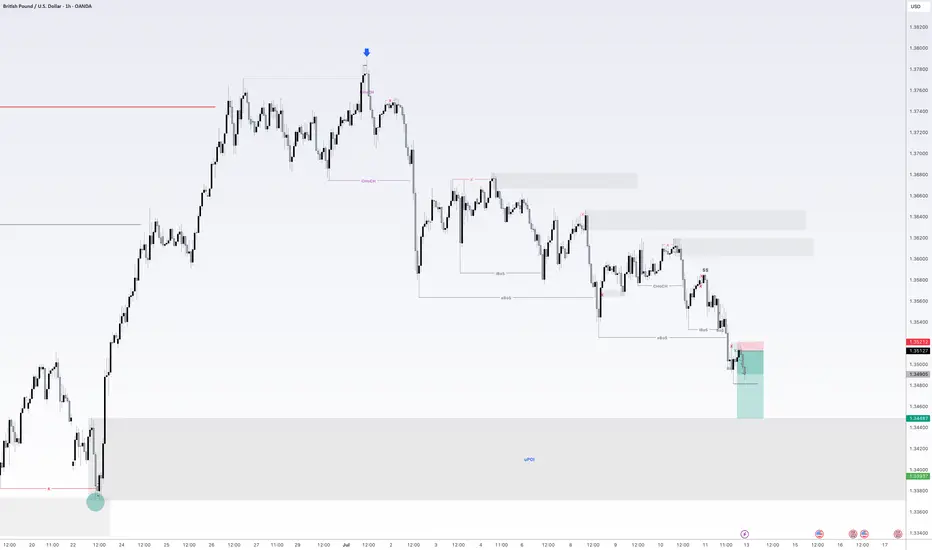
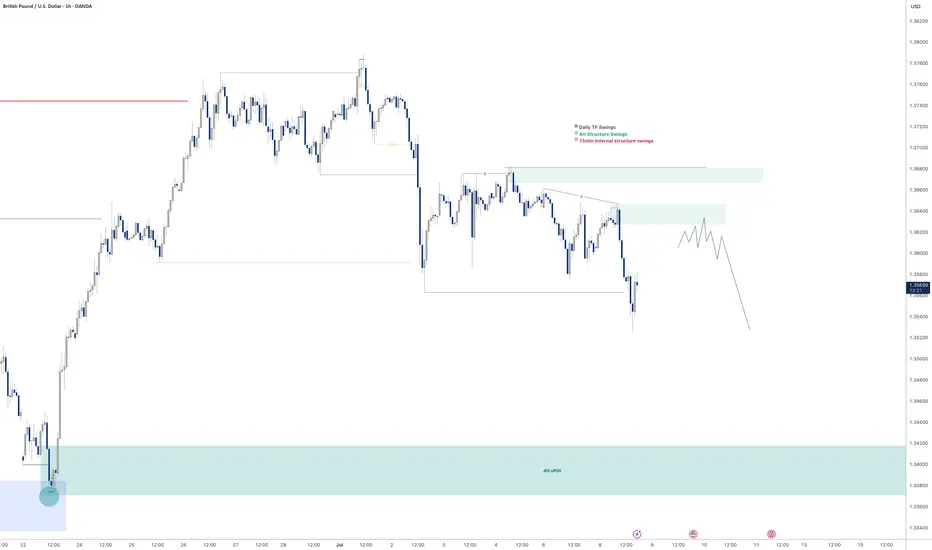
GBPUSD - Also continued downside continuationLooking at GU. This is a little bit ahead of its time in comparison to EU.
And what i mean by that is EU is a lot further away from its 4H demand zone compared to GBP so it will be super interesting to see how we react at the level we are fast approaching on GU.
I am in a short position as of Friday. I will be posting a video tomorrow showing exactly how and why i got short on GU so stay tuned for that one.
As always if there is anything else i can be of assistance with give me a message and i will be happy to answer any questions you may have
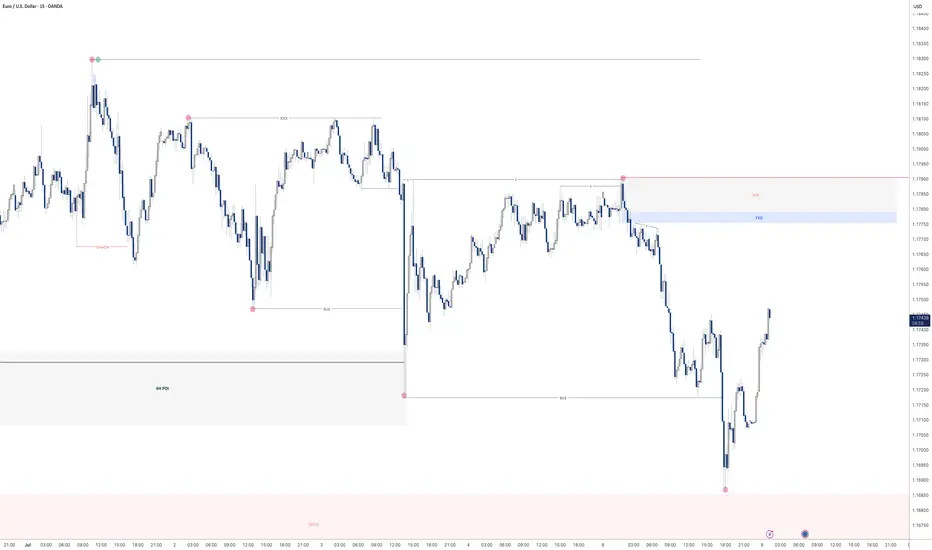
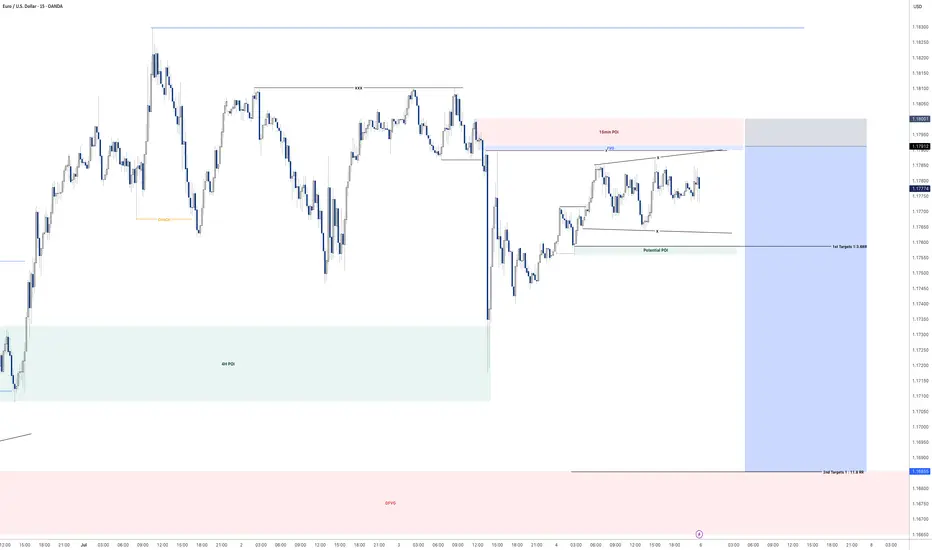
EURUSD - Still Orderflow remains bearishLooking at EU. The 1H Orderflow is still maintaining that bearish intent. My area is set now for where i want to take a potential sell to the downside seeing as everything else is pretty much mitigated.
The only issue with this potential sell of is that we never really had a sweep of liquidity before we rolled over and moved to the downside.
We do have a level of inducement before our POI but i think in an ideal world i would love to see us build up a bit more liquidity before the POI just to induce the early sellers before making that move to the downside.
For now. On the lower TF's i will be looking to take short term long positions back up to our POI before looking for the longer terms short. to our 4H POI in which i will be looking to get long once again.
Any questions feel free to give me a message

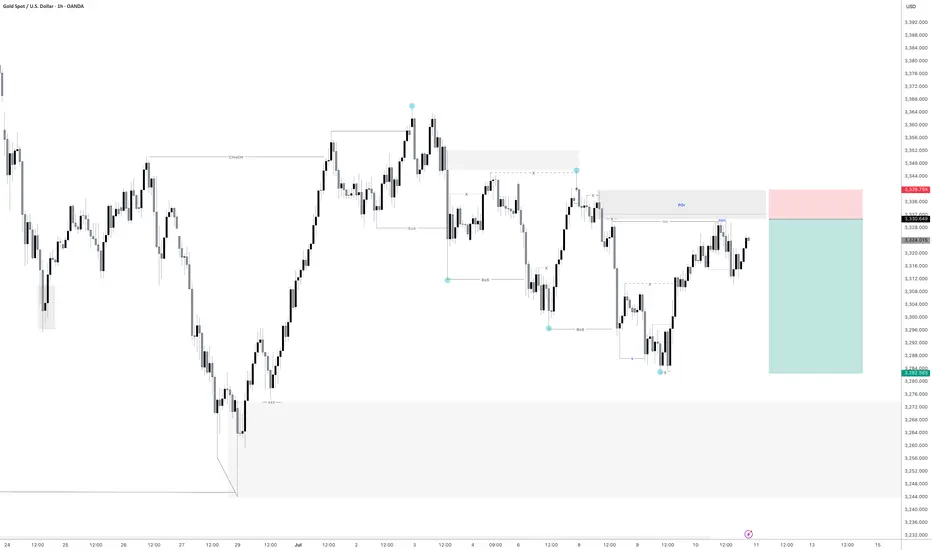
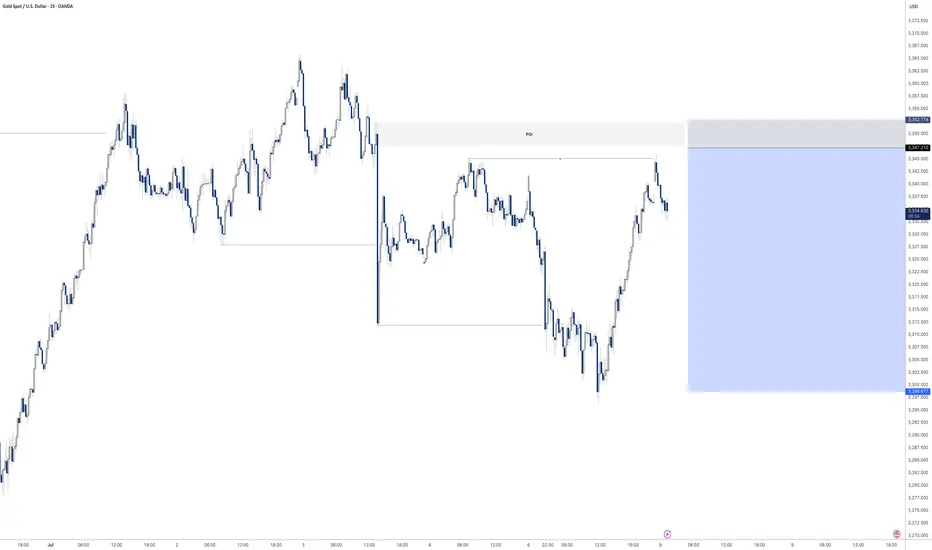
Gold - Sell inboundGold is looking very promising for another sell off. we are already showing signs that price has intent to move lower with some lower timeframe break of structure.
Just waiting for a manipulation now of the most recent highs put in before price moves lower.
Let's see if we get an entry tonight.
GBPUSD - 2 potential selling opportunitiesLooking at GBPUSD
We have 2 potential selling POI's.
The first one being a point in which we will need to sit on our hands for a little bit to see what price does at there is no inducement in the push down in the impulse leg. With that being the case we will need to see some sort of inducement built before we enter that POI
IF we clear the first POI I think I will take a more aggressive entry on the secondary POI that sits a little bit higher. This is due to us having already put in some sort of liquidity in and around that POI before pushing lower.
Will wait and see what happens.
Tomorrow could be a very good trading day
Gold sell off before continuation higher? Pending order set on this one before bed
Will see what develops overnight
EURUSD - Potential sell at LDN or NY openLooking for sell from the POI highlighted
We have raided buy side liquidity so now its time to look at the origin of the move and see if we can further capitalise on a similar set up I took yesterday in order to bank a lovely 8.5% profit on this single trade.
Will post the trade below
USDCHF - Potential downside incominglooking at UCHF we have just swept a level of liquidity.
We have had a Change of Character on the 15min to the downside and left a nice inducement / liquidity level alongside a nice FVG that has left a nice bearish orderblock
Once the spreads calm down I will set my pending order on this level and hope to be tagged into this position.
Due to the time it will be a reduced risk entry as I won't be able to manage the trade during the night.

EURUSD - Where next?Looking at EURUSD
I still feel like we are due some sort of deeper retracement to the downside considering how bullish the 4H and Daily time frame have been in recent times.
Although the market does not care how I feel in all honesty haha. I will play the short term short until the 15min orderflow switches bullish once again.
The expansion that is currently happing right now is very interesting and makes a good watch to see what we will do come market open as we are engineering liquidity for both a buy and sell with both POI's looking primed for entries.
Will be keeping a close and keen eye on EURUSD when the market opens
Any questions feel free to give me a message
Market Re-Cap and Outlook for NEXT WEEKHere I am giving you a little insight as to what trades I am currently in, taken & looking to take for the week just gone and the week coming.
1 Winning trade on EU
1 Current open position on EU
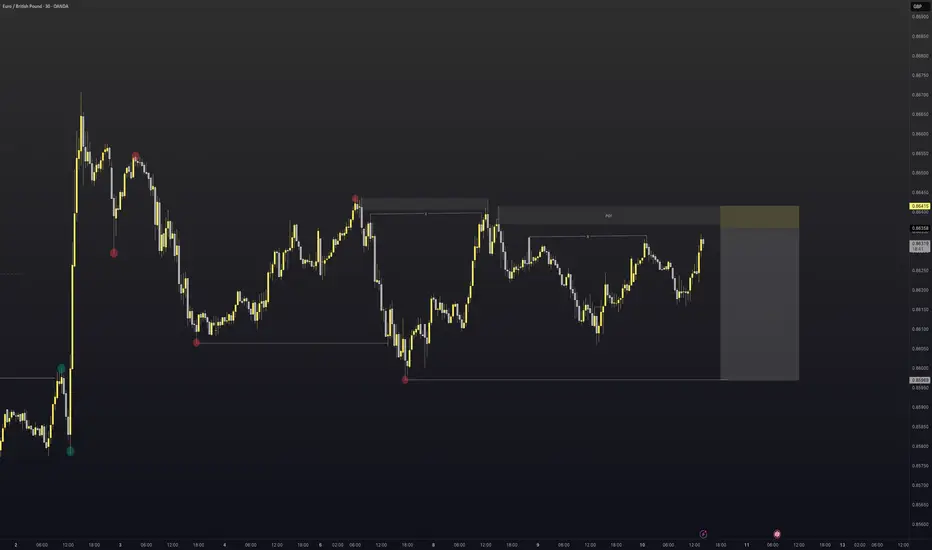
EURGPB - Breakdown
AUDUSD - Breakdown
NZDUSD - Breakdown
Gold - Breakdown
If there are any pairs you would like me to share my feedback on give me a message and I will be happy to try and do so.
Thanks
Happy Hunting

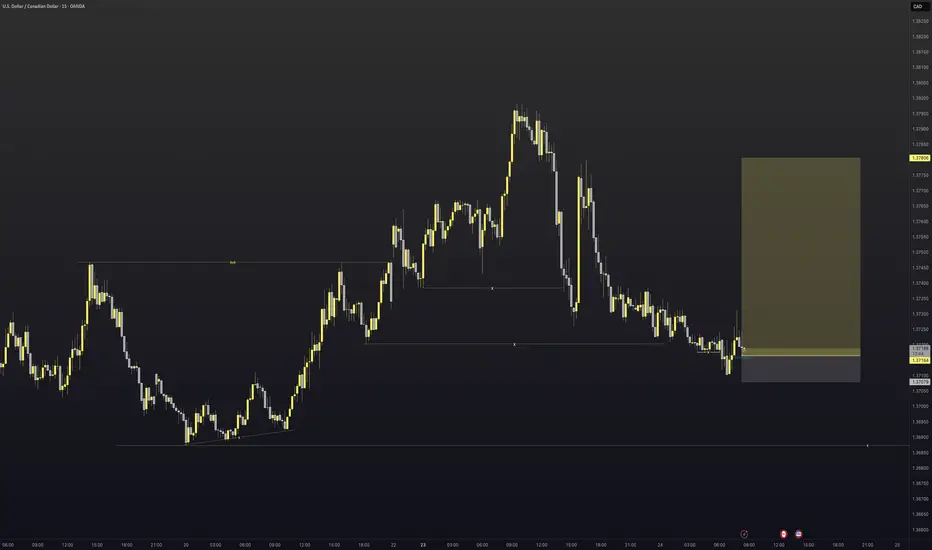
USDCAD - Long triggered We have entered into the discount area of the most recent swing point on USDCAD. With doing this we have taken out all the areas of liquidity within the trading range so it was time to look for potential long moves.
Now at current price we have had a great example of AMD where by we
Accumulate
Manipulate
and then the hope is that we begin to distribute higher.
There was also a nice fair value gap that was left behind on the 5min
So all that was left to do was execute.
Let us see how it plays out.
Win or lose great entry super happy with the trade. Lets see how it goes
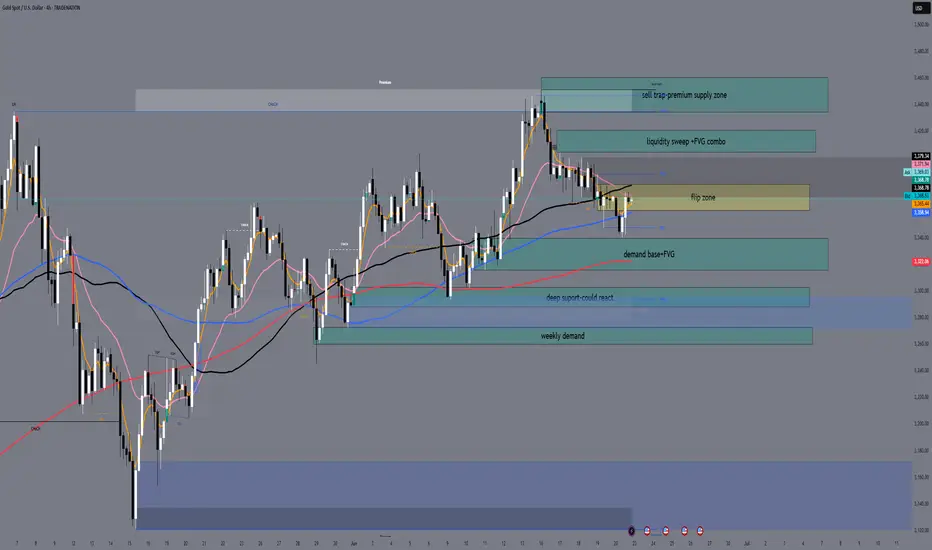
H4 Outlook – Between Flip and Trap👋 Hey Gold minds, welcome to another sniper-level breakdown. We're mid-range between major sweep zones and watching carefully how price reacts around the current compression under key EMAs and FVG. Let’s break it down:
🔸 MACRO + FUNDAMENTAL CONTEXT
USD drivers this week:
🔹 Monday–Tuesday: Multiple FOMC Members speaking
🔹 Wednesday: Powell Testimony
🔹 Thursday: Final GDP + Unemployment Claims
🔹 Friday: Core PCE and UoM Inflation Expectations
Macro sentiment:
FOMC speakers remain hawkish while inflation is sticky. Gold reacts defensively as markets price in Powell’s tone. Liquidity traps on both sides still active. Gold consolidates below key liquidity at 3405, potentially setting up for either expansion or sweep rejection.
🔸 H4 STRUCTURE + BIAS
Market structure:
Price formed a Lower High (3452) and confirmed bearish intent with a break of structure to the downside (CHoCH & BOS).
Currently compressing under H4 Fair Value Gap and retesting an internal OB + EQ zone around 3360–3370, showing signs of rejection.
EMA Cluster:
Price is compressing between EMA 21 / 50 / 100, failing to reclaim EMA100.
EMA5 is crossing under EMA21 – short-term bearish bias holds.
Bias: 🔻 Bearish to neutral
As long as price stays under 3380, supply remains in control. Only a break and close above 3405–3415 would flip bias bullish short term.
🧭 Sniper Zones – H4 Precision Map
🔷 Type 📍 Price Zone 📌 Justification
🔵 Buy Zone #1 3315 – 3340 Valid OB , previous HL structure, FVG reaction support
🔵 Buy Zone #2 3280 – 3302 Deeper demand pocket, untapped imbalance
🟠 Flip Zone 3360 – 3380 FVG + internal OB + EMA compression = key battle zone
🔴 Sell Zone #1 3405 – 3415 Internal OB + unmitigated premium zone under LH
🔴 Sell Trap Zone 3440 – 3460 Extreme rejection zone — 3452 HH sweep logic + OB
🔸 Price Action Expectations (PA)
If price rejects 3360–3380, expect a clean push back to 3320, with possible deeper draw to 3300–3285.
A clean break and close above 3380 (not just a wick) may open the door for a sweep of 3405, where sellers are expected.
Only an aggressive news-driven breakout above 3415 would unlock the final trap zone toward 3450+ – lower probability unless Powell surprises.
✅ Conclusion & Execution Plan
🎯 Watch how price behaves around the Flip Zone — this is the decision point.
📉 Main bearish confirmation = strong rejection at Flip Zone or 3405.
📈 Bullish continuation only above 3415 with volume and closing strength.
💎 Best RR zones:
Sell 3405–3420 → targeting 3360 / 3340
Buy 3315–3340 → targeting 3360 / 3380
🔥 If this breakdown helped sharpen your edge, drop a 🚀 in the comments and like the post!
🔔 Follow GoldFxMinds for more real-time, structure-based sniper plans.
🧠 Precision isn't optional. It's the edge.
🔹 Disclosure: As part of Trade Nation’s Influencer Program, we receive monthly compensation for using their charts.
GoldFxMinds
XAUUSD Sniper Plan – June 18, 2025Hey GoldMinds! 💛
After a messy reaction to today's Retail Sales miss, Gold continues to coil inside a premium range. With FOMC projections, rate statement, Powell’s press conference, and Unemployment Claims lined up next — volatility is far from over. Here’s our refined tactical plan 👇
🌍 Macro & Geopolitical Context
• US Retail Sales disappointed — signaling cracks in consumer demand, potentially weighing on the USD.
• Unemployment Claims up next — job market weakness could add pressure on USD if claims increase.
• FOMC day: Expect massive liquidity sweeps during economic projections, rate decision, and Powell’s press conference.
• Geopolitical tensions persist — no ceasefire in Middle East conflicts (Israel–Iran), and Russia–Ukraine remains unstable. Safe haven bids may still support gold on dips.
🧭 Bias: Tactical Neutral → Bearish
• Price remains capped under 3415–3445 supply
• EMAs are showing indecision: H1 trapped between EMA 5–21, H4 leaning weakly bullish
• RSI on most TFs is neutral → market waiting for event catalyst
• Structure suggests bull trap risk if 3415 holds
🔑 Key Sniper Zones
🔻 Sell Zones
1️⃣ 3405 – 3415
→ H1-H4 OB + FVG + sweep confluence
→ Premium liquidity pocket — ideal trap for reactive sellers
→ Watch M15 for rejection confirmation
2️⃣ 3430 – 3445
→ Upper inducement + clean OB + imbalance
→ Only valid if price spikes irrationally post-FOMC
→ Stronger reversal setup likely here
🟡 Pullback Monitor Zone
3390 – 3398
→ No trade zone — watch for signs of rejection or continuation
→ Could act as short-term resistance before deeper moves
🟢 Buy Zones
1️⃣ 3365 – 3380
→ Bounce zone with clean confluence: FVG, OB, previous HL
→ Best used for reactive entries after wick flushes
→ Key pivot zone with HL structure
→ OB + FVG combo, ideal for tactical long bounces with M15/M30 confirmation
2️⃣ 3335 – 3345
→ Deeper structure retracement zone
→ Contains H4 OB, imbalance + golden Fibo pocket
→ Most reactive buy zone post-event volatility
🧠 Battle Plan Recap
• If price fails to break 3415, we prepare for further bearish continuation
• Bounces expected at 3365–3380 — confirmation needed
• Final long setup lives at 3335–3345 — cleanest buy zone if FOMC triggers selloff
• 3390–3398 is not for entries — only reaction monitoring
• FOMC + Claims = high risk day → trade only sniper zones
✨ Final Notes
Volatility creates traps. Structure gives clarity.
We don’t predict — we react to the third move.
👇 Found this valuable? Hit the 🚀, follow for more sniper plans, and comment your bias!
Let’s trade like pros, not guessers — GoldFxMinds 🧠✨
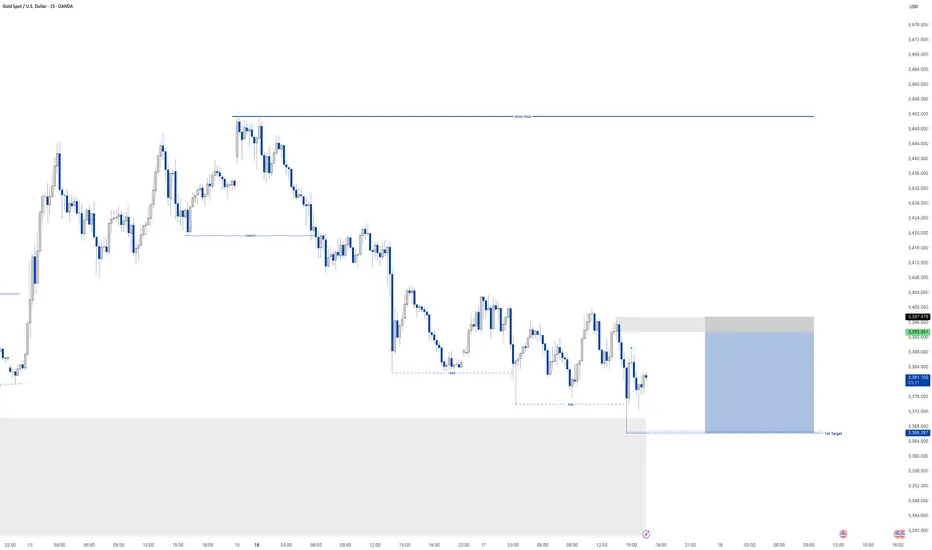
GOLD - Selling opportunity on the horizonLooking at gold.
We have a nice bearish continuation orderflow on the 15min TF.
We have a nice potential inducement level of liquidity that we are more than likely to take before moving lower.
This is a reduced risk entry due to where we are on the higher TF as we are pulling into a potential demand zone on the higher timeframe.
ITS REALLY IMPORTANT to remember where we are in terms of structure and as we well know Gold doesn't tend to fall for to long as it remains bullish the majority of the time. so in regards to the HTF like I mentioned above we are still bullish so we are expecting a reversal for the longer term at some point in the near future so this could be a case of get what we can from the market and then look for our LTF orderflow to switch Bullish before then looking for them long entries
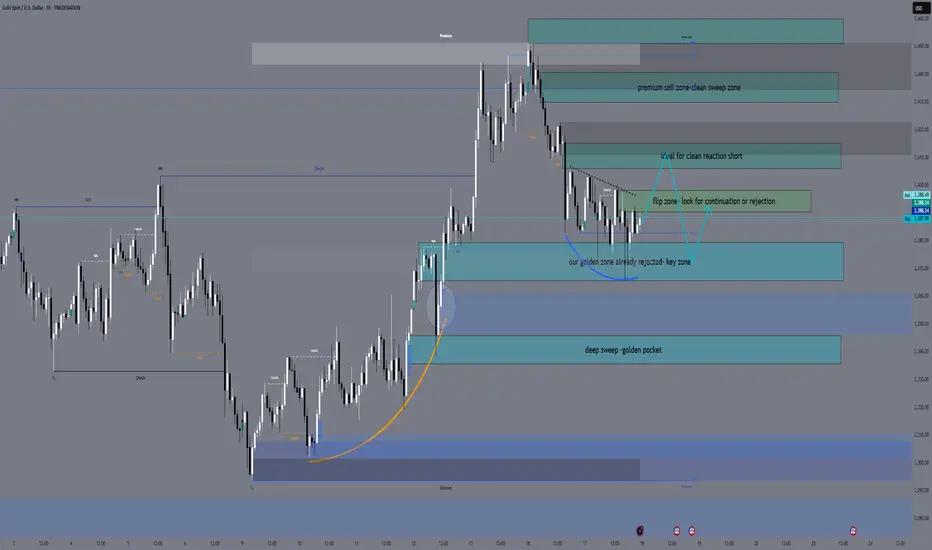
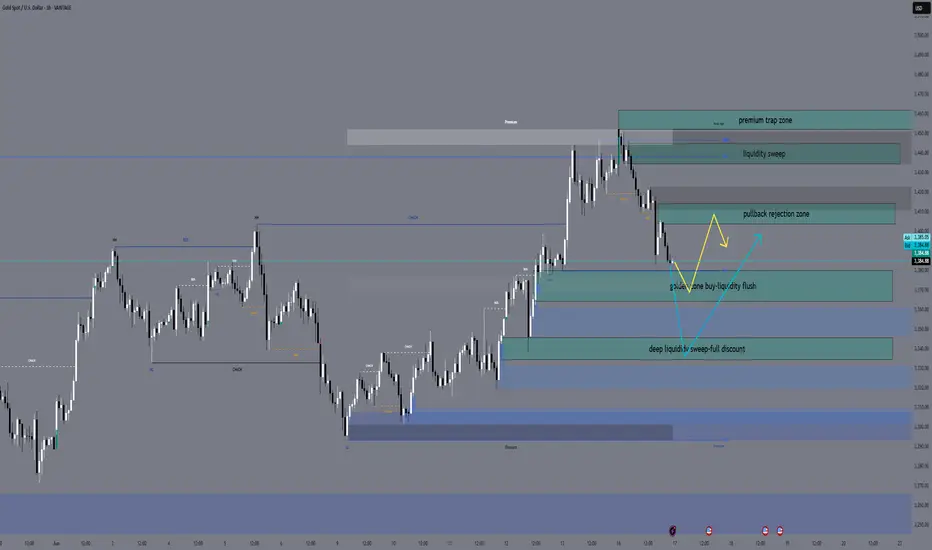
GoldFxMinds Sniper Plan — June 17, 2025 🚀 GoldMinds Battle Plan Loaded — June 17, 2025
Good morning GoldMinds 👋
The market is again building perfect traps after CPI & PPI whipped both sides last week. Liquidity is stacking and volatility is hiding behind a quiet news calendar — exactly when the market loves to attack both sides. We stay patient, sniper-style.
🌎 Macro & Sentiment:
No major data today, but liquidity still reacts after last week’s CPI & FOMC tone.
DXY remains stable — gold remains capped inside premium supply zones.
The real game now is liquidity manipulation — we focus on clean execution.
🔬 Structure & Bias:
✅ D1: Liquidity sweep above 3450 — sellers protecting premium.
✅ H4: Lower high distribution forming.
✅ H1: Bearish order flow starting to control.
✅ EMAs 5/21/50: compressed bearish.
✅ RSI: showing divergence on intraday.
Bias: Tactical Bearish — under 3460 we remain sellers on sweeps. Liquidity hunts both ways but premium remains the trap zone.
🎯 Sniper Zones
🔻 SELL ZONES:
3405 – 3410 → early pullback rejection zone
3435 – 3445 → main OB liquidity sweep
3452 – 3460 → extreme premium trap zone
🔻 BUY ZONES:
3365 – 3380 → golden zone buy (perfect fibo confluence)
3335 – 3345 → deep flush exhaustion buy
🔄 Tactical Scenarios
Sell spikes into premium → M15 rejection → target 3380 first.
If flushed into golden zone → watch M15 confirmation → target 3405.
If deep flush into 3335 → exhaustion buy setups only.
💡 Tactical Notes
No chasing — liquidity first, reaction second.
News absence = perfect condition for engineered liquidity sweeps.
Stay sniper. Only act when structure confirms.
🔥 If this sniper battle plan helps you prepare, smash the 🚀, drop your bias in comments & hit FOLLOW to support real structure-based trading. Let’s bring back real value content to TradingView.
GoldFxMinds 🧠✨
EURUSD - Long from hereDue to having internal Breaks of Structure to the upside here I have entered a long position as it is a reasonable area to potentially get long as it is a strong area of demand.
I'm aware that there isn't much liquidity built up in and around this area before hitting the demand but its a risk im willing to take as price may just be filling the FVG from all the buying pressure that was in the market yesterday
Any questions please message

NZDUSD - Time to buyWhen the market opens and we have a clear longing opportunity to get long on NZDUSD
We have an inducement level to the left and already have a sign of strength to the upside.

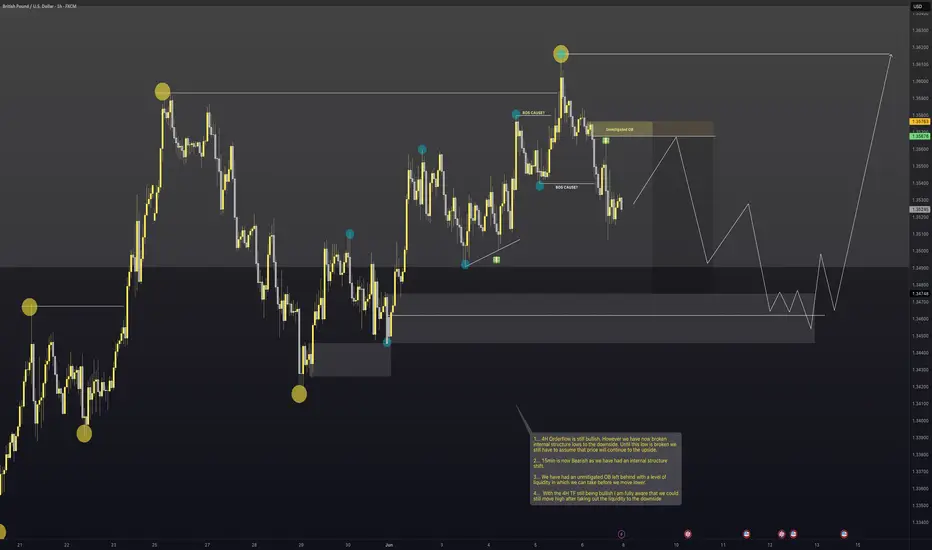
GBPUSD - Very InterestingWith NFP creating massive volatility on Friday this pair is a bit messy.
We have however created an internal structure shift on the 15min timeframe to the downside lower the HTF order flow still being bullish
This could be a case of get what we can to the downside until we hit the HTF demand and look to get long.
As you can see I am already trying to forecast ahead of what could potentially happen with this pair as when it gets to certain levels and there are reactions it will come as no surprise.
If I can be of assistance to anybody please don't hesitate to message.