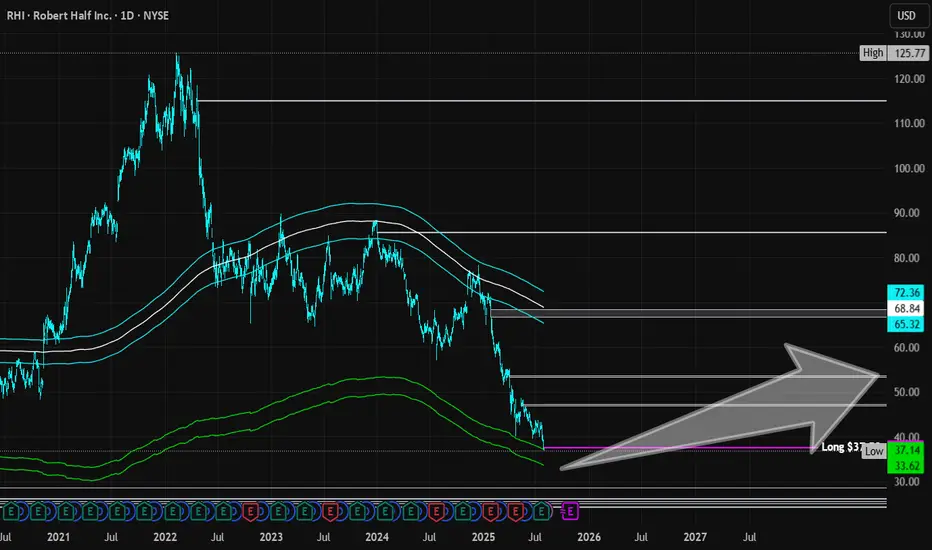
Robert Half | RHI | Long at $37.58Robert Half NYSE:RHI is a company that provides talent solutions and business consulting services in the US and internationally. It's a cyclical stock. Currently, the price has entered my "crash" simple moving average zone ($37-$33) and has historical bounced from this area. This doesn't mean the "major crash" area won't be reached ($26-$21 or below), but the company has been around since 1948 and survived many hurdles along the way.
Earnings are forecast to grow 8% annually and it has a 6.3% dividend. P/E = 21x and financially healthy (low debt-to-equity: .2x, low bankruptcy risk/Altmans Z Score: 5; and enough cash to pay current bills/quick ratio: 1.6).
Regardless of bottom predictions, I think there is a high chance the stock may reach $33 before a slight bounce. If the market flips for a bit, that "major crash" area ($20s) may be hit.
So, a starter position for NYSE:RHI has been created at $37.58 with additional entries near $33 and $25-$26.
Targets into 2028:
$46.00 (+22.4%)
$53.00 (+41.0%)
Industrials
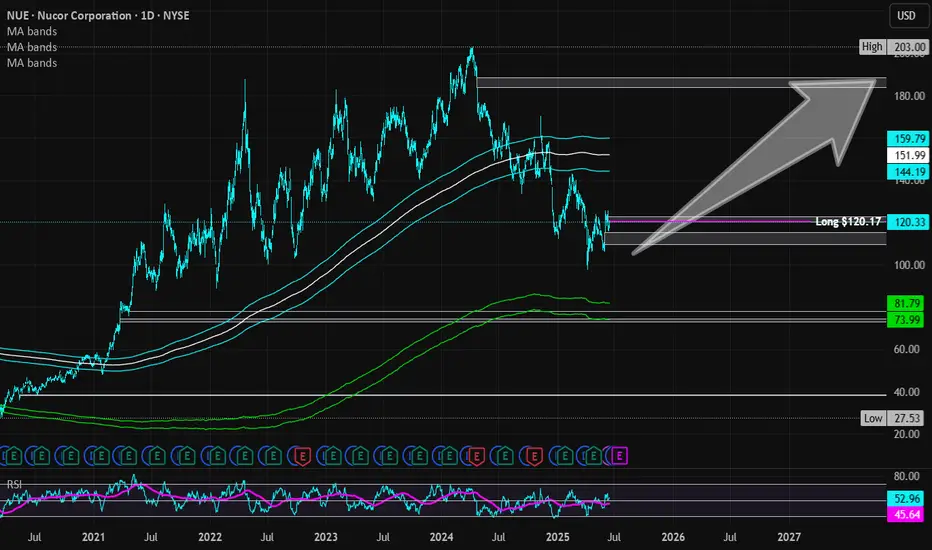
Nucor | NUE | Long at $120.17Nucor NYSE:NUE , a US manufacture of steel and steel products, will likely capitalize on reduced foreign competition as tariffs become reality. The CEO also recently stated that the steelmaker's order backlog is the largest in its history and is increasing prices. So, while there is a potential for short-term downside as tariff "unknowns" are negotiated, the longer-term upside may be there for those who are patient... but time will tell.
Basic Fundamentals:
Current P/E: 21x
Forward P/E: 15-16x
Earnings are forecast to grow 29.6% per year
Projected Revenue in 2025: $32.3 billion
[*} Projected Revenue in 2028: $39.4 billion
Debt-to-Equity: 0.4x (healthy)
Dividend Yield: 1.8%
Technical Analysis:
Riding below the historical simple moving average and there is risk the daily price gap near $109 will close before moving higher. If there is a "crash" in price, $70s is absolutely possible which will be a "steel" if fundamentals do not change.
Targets in 2027:
$142.00 (+18.2%)
$187.00 (+55.6%)
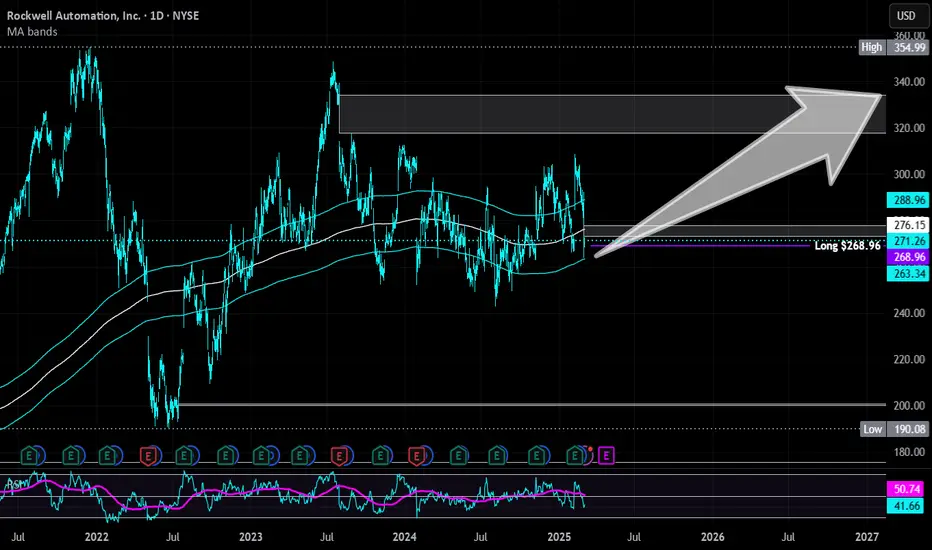
Rockwell Automation | ROK | Long at $268.96Rockwell Automation NYSE:ROK appears to be gaining upward momentum once again. With two price gaps above (highest near $333+) and the historical simple moving average lines showing a positive change, this company could be poised to fill the gaps soon. A strong billion-dollar company with rising revenue, but stay cautious of the slightly high debt, insider selling, and changing economy / tariff implications.
At $268.96, NYSE:ROK is in a personal buy-zone.
Targets:
$300.00
$333.00
$PWR: The outperformer momentum stock within $XLIMany will say not all industrials are created equal. Some stocks give more α- than others. Within the SPDR Industrial subsector ETF AMEX:XLI we have stocks like Boeing which have done nothing for the last 5 years. On the other hand, we have midcap industrial stocks like NYSE:PWR , NYSE:TT and NYSE:GEV whose chart looks amazing and has clear uptrends. What is common among these industrial names? All these industrials provide solutions to the Generational AI Data Center Build Solutions. Quanta Services NYSE:PWR provides electrical and power solutions and components which go into building these data centers which need reliable power supply and high-quality equipment’s. In the chart below you can see the ratio chart of NYSE:PWR vs $XLI. This indicates the performance dominance of NYSE:PWR vs the industrial ETF AMEX:XLI with the ratio touching the lows of 0.4. So instead of buying the index AMEX:XLI , I would rather long NYSE:PWR over $XLI.
Coming back to technical the stock is in a clear uptrend. During the April Bear market, the stock NYSE:PWR took a plunge and lost almost 40% of the value and touched the 0.236 Fib Retracement level with RSI of 30. From the bottom of 230 $ the stock recovered 60% of its losses. With an RSI of 60 the stock is still not in overbought territory. If the stock follows the same price pattern and touches the upper limit of 4.236 Fib retracement level, then we can see a 380 – 400 $ stock before we turn cautious.
Verdict: Long NYSE:PWR over $XLI. Best industrial momentum stock. 400 $ target price.

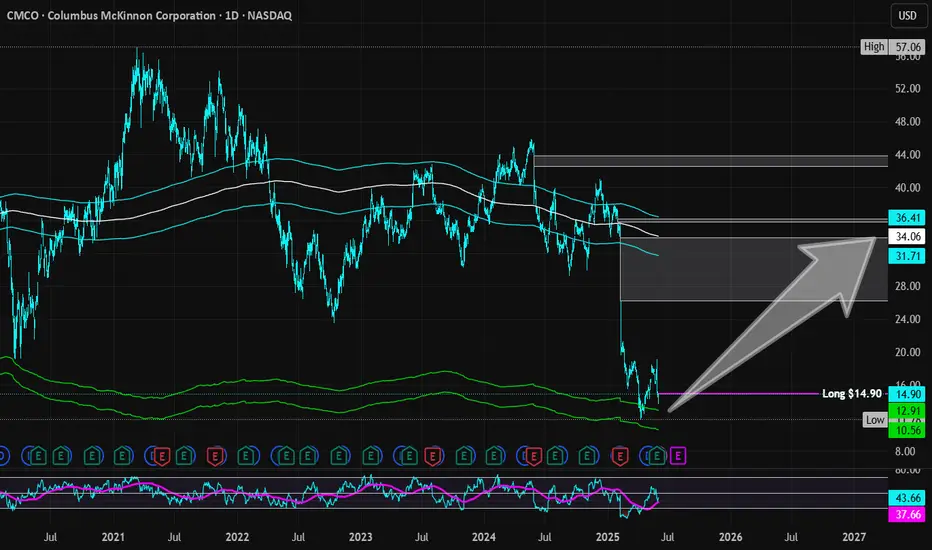
Columbus McKinnon Corp | CMCO | Long at $14.90Columbus McKinnon Corp NASDAQ:CMCO is a stock that is highly cyclical, moving in "boom and bust" cycles every 3-5 years. As indicated by its entry into my "crash" simple moving average area (currently between $11 and $13), it may be nearing the end of its bust cycle (time will tell). With a book value at $31, debt-to-equity of 0.6x (healthy), quick ratio over 1 (healthy), insiders buying over $1 million in the past 6 months, a 2% dividend yield, and earning forecast to grow after 2025, NASDAQ:CMCO may be a hidden gem for double-digit returns in the coming years. But every investment is a risk.
Thus, at $14.90, NASDAQ:CMCO is in a personal buy zone.
Targets:
$25.00 (+67.8%)
$30.00 (+101.3%)
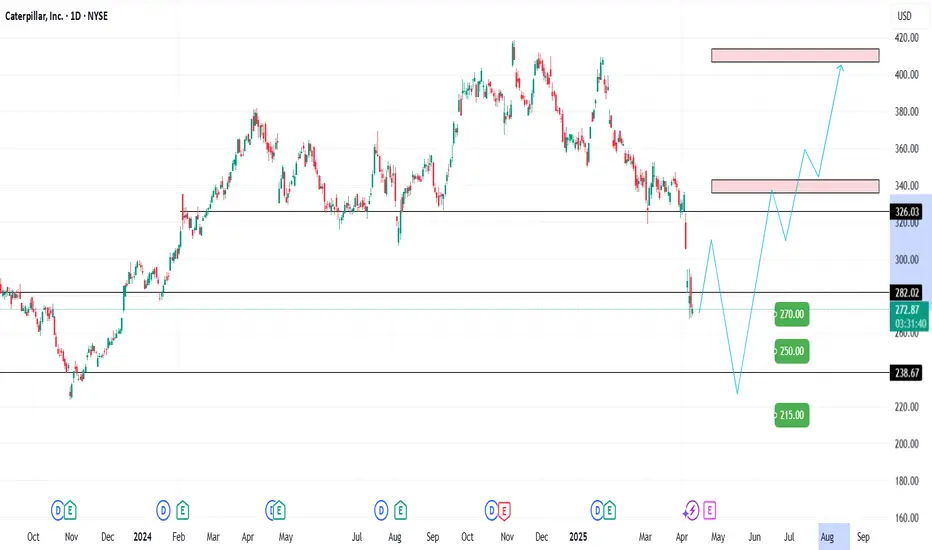
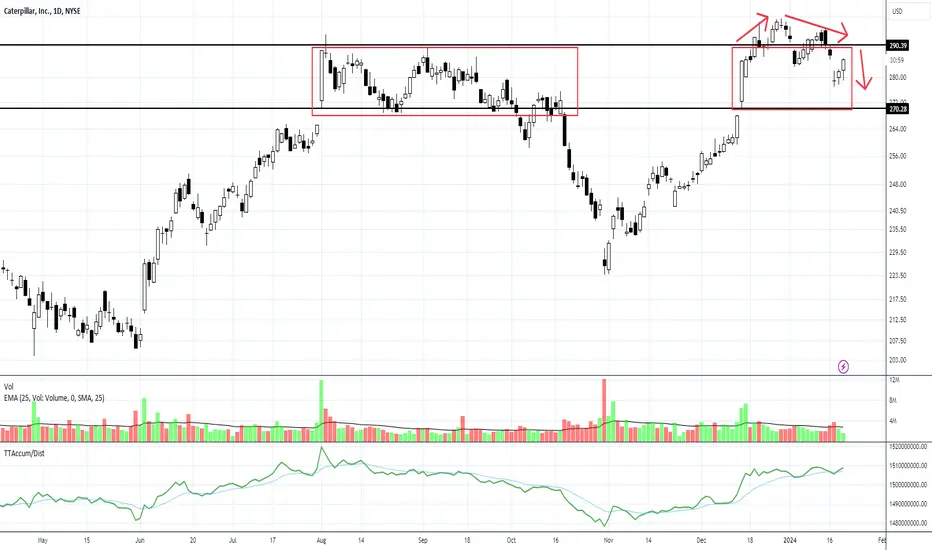
CAT TRADE IDEA – HEAVY EQUIPMENT, HEAVY POTENTIAL 📈🏗️🐾Sector: Industrials – Construction & Machinery
When the giants sleep, we prepare. And when they wake, we ride the momentum.
Caterpillar has been consolidating, and the recent pullback opens the door for a high-conviction setup. I'm looking to build my position in 3 strategic zones — scaling in with patience, letting the market give me the setup on my terms.
🟢 Entry Plan (Scaling In):
⚙️270 – First nibble as it approaches key structural support
⚙️250 – Historical support level and psychological round number
⚙️215 – Panic zone entry — if it hits here, it's a gift 🧨
🎯 Profit Targets:
320 – Swing back to resistance; first trim zone
370 – Momentum continuation with strong industrial tailwinds
400 – Full send 🚀 Long-term target if infrastructure demand and global growth trends align
🛡️ Risk Strategy:
Staggered entries allow for cost basis control
Adjust position sizing based on entry zone reached
💡 Why CAT?
Caterpillar’s fundamentals remain strong with global infrastructure spending on the rise, and the stock is approaching historical discount levels. This setup is about anticipating the bounce, not chasing it. Plan the trade, trade the plan.
📢 DISCLAIMER:
This is not financial advice. I'm sharing my personal trade plan for educational purposes only. Always do your own research and consult a licensed financial advisor before making any investment decisions. Trading involves real risk — respect it.
DOW Inc | DOW | Long at $27.59NYSE:DOW Inc is a strong company with good fundamentals currently trading at a good value (it just may take time for the value to truly show).
P/E = 18x
Dividend Yield = 7.74%
Price/Cahs Flow = 6.9x
Debt/Equity = 0.94x
Price/Book = 1.14x
Insiders buying and awarded options
Thus, at $27.59, NYSE:DOW is in a personal buy zone.
Targets:
$34.00
$40.00
$44.00

One more ratio Chart: $HWKN vs $XLBSome say ‘there is no bull market without materials and industrials. Today we looked at a specialty chemicals and material company called Hawkins Inc. This stock is a great compounder and a huge momentum play. The stock has returned more than 500% to its investor. This small material cos., which works in the field of specialty chemicals and provides industrial solutions for waste and water management has outperformed the Select Sector Materials sector ETF ( AMEX:XLB ).
IN the ratio chart of NASDAQ:HWKN vs AMEX:XLB we see the bullish momentum in favor of NASDAQ:HWKN and its relative outperformance against the Material sector. Recently this momentum has stalled, and the Ratio is below the 20-Day, 50-Day and 100-Day SMA and just hanging above the 200-Day SMA. If this holds, we can accumulate NASDAQ:HWKN at this level as one of the strongest momentum stocks within the materials complex.

Stanley Black & Decker | SWK | Long at $85.00Stanley Black and Decker NYSE:SWK breached my selected historical simple moving average and may likely be forming an upward channel into an overall positive reversal. It's "obeying" the simple moving average lines so far, with a nice bounce off the base at $85. Earnings and cash flow are expected to grow into 2026, but caution should be used if the economy slows further... It currently has a dividend yield of 3.74%. While I wouldn't be surprised if the price dipped to close out the price gap in the low $80s, NYSE:SWK is in a personal buy zone at $85.00.
Target #1 = $100
Target #2 = $114
Target #3 = $125
Target #4 = $137

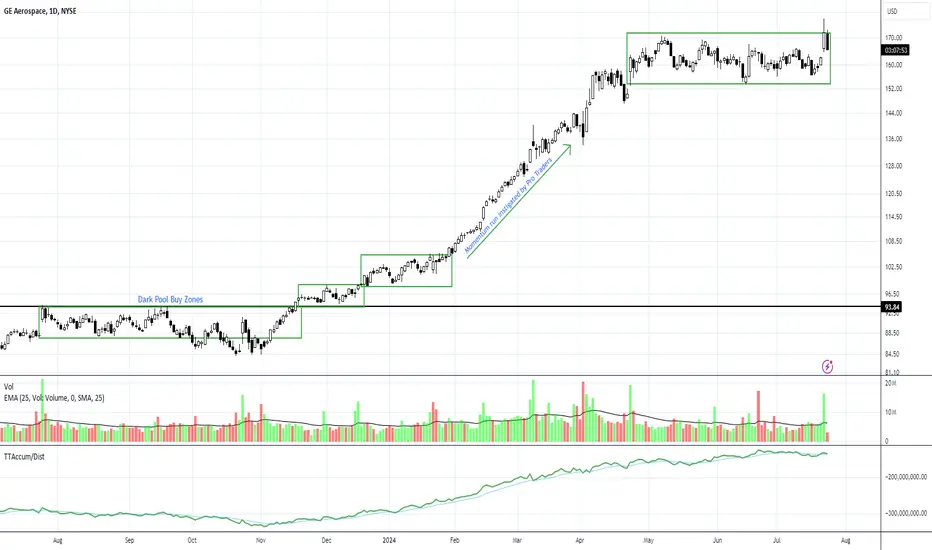
Technical Patterns of Reinvention: GENYSE:GE reported earnings yesterday and had a minor gap up to the high of the sideways range with some selling for profit toward the end of the day. This company is reinventing. Momentum Runs have developed out of Dark Pool Buy zones for swing trading since the last time it was mentioned.
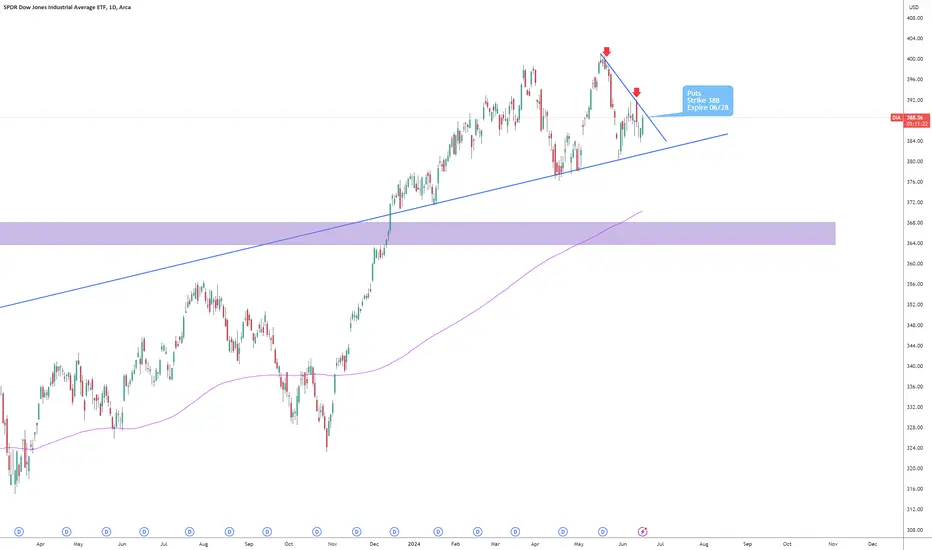
Puts DOWI think the DOW has already peaked out. I'm going to short it with puts on every rally. If tomorrow opens with a gap up I'll buy more.
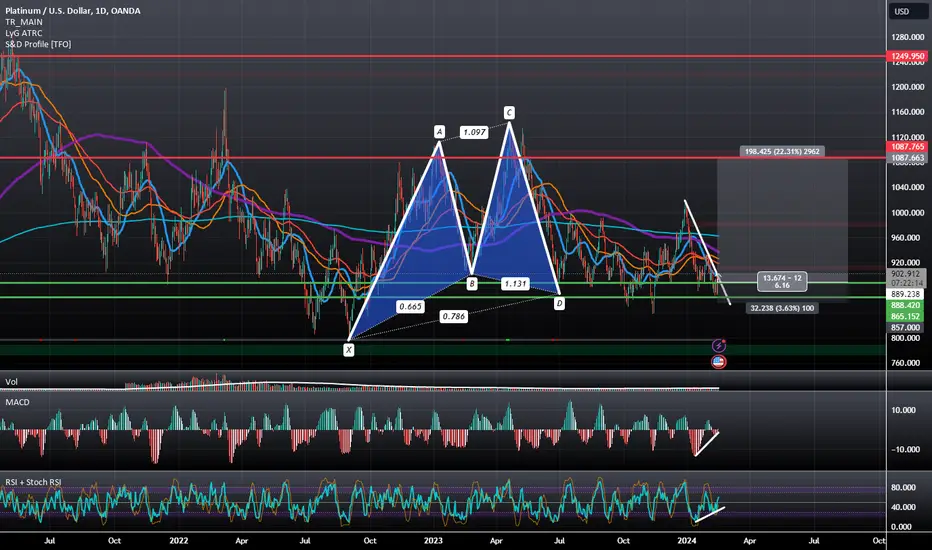
Platinum: Bullish Cypher at Support with Bullish DivergencePlatinum is sitting at a Support Zone which aligns with the PCZ of a Bullish Cypher with RSI and MACD Bullish Divergence all on the Daily Timeframe and looks to be setting up to begin a retrace towards the resistances marked above.
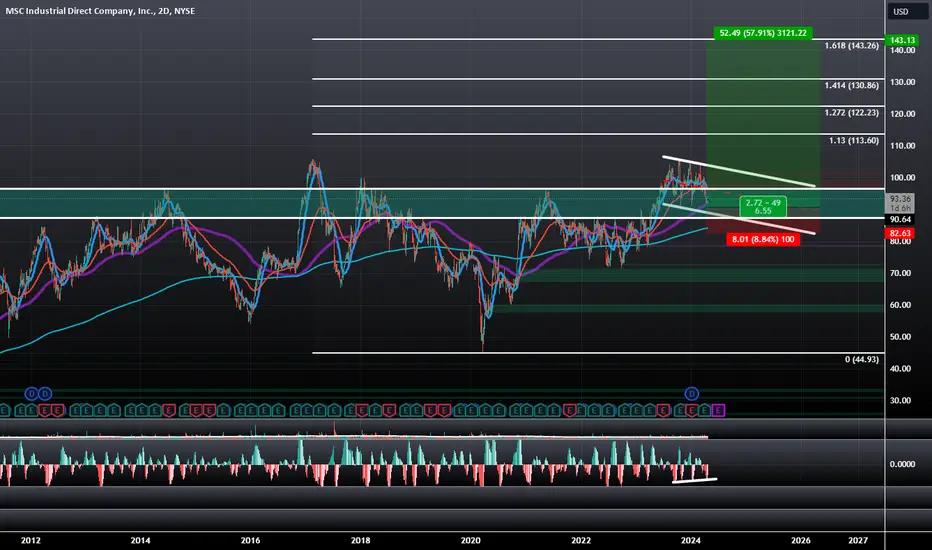
MSM: Holding Above 200 Moving Average In Support ZoneMSM looks to be Triple Bottoming with Triple Bullish Divergence on the MACD above a Congestion Zone and has also formed a Bullish Deep Gartley Visible on the Daily and 4 Hour Timeframes. If it holds we could see the period of consolidation break upwards and given the industrial nature of this stock and how other industrials have performed after experiencing similar retraces towards support, we would likely see a move towards the ATHs, after that we would then aim for the Fibonacci Extensions which could hopefully even take us to the 1.618 near 150 Dollars.
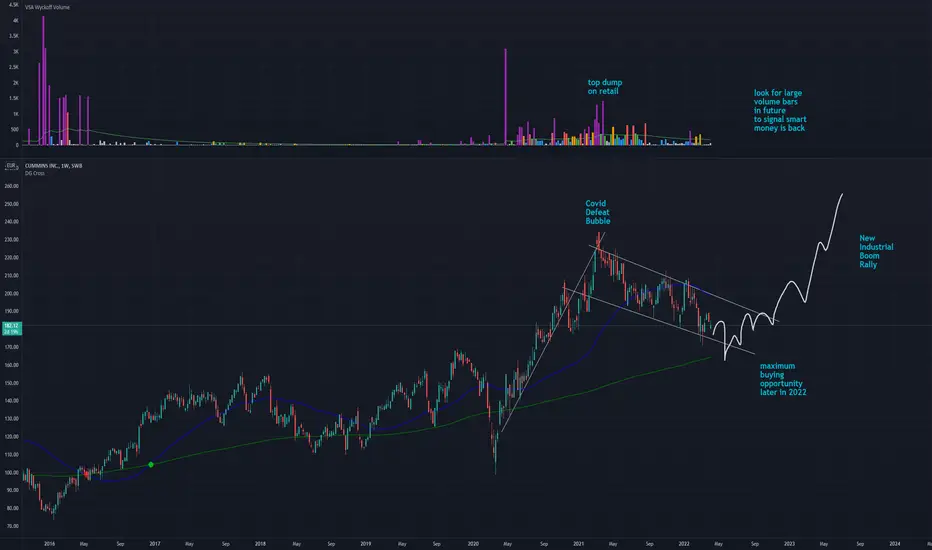
Don't Blow this Dip-Buy opportunity in 2022 for Cummins"Natural science has invaded and transformed human life all the more practically through the medium of industry; and has prepared human emancipation, although its immediate effect had to be the furthering of the dehumanization of man."
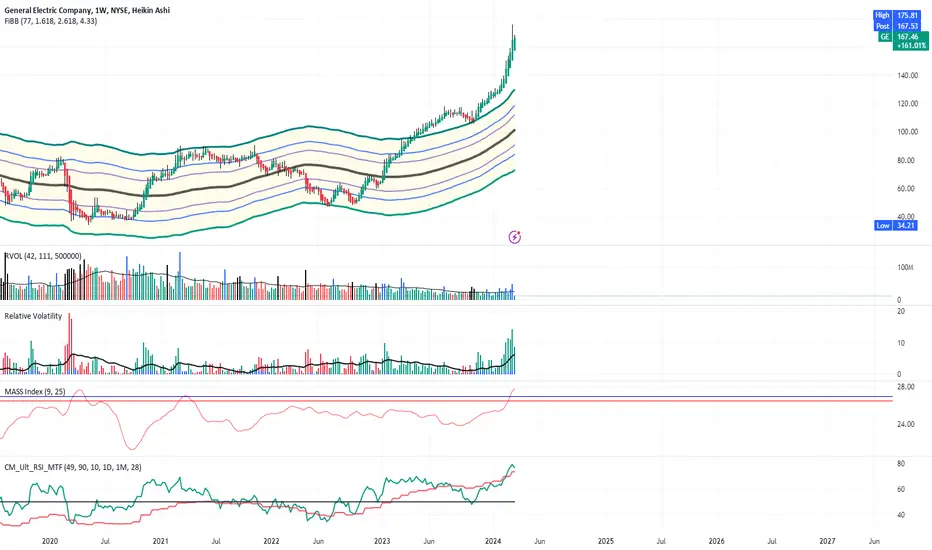
GE continues its bullrun LONGGE on the weekly chart has been in a trend up with some corrections along the way since a
double bottom in the summer of 2022. It has had some sections spin-off including the health
care poriton of the company. This company as a mega-cap industrial with cash on hand
is independent of interest rate concerns. Much of its business in long term contracts. I see
GE as a great long-term long trade. I am focused on accumulating long shares as well an
options into 2026. The last correction on this chart was this past October. I will average more
in at this time but am really looking for another smaller correction like last October for a
bigger buy to add to the positions. GE is safe from the volatility of most of the technology
stocks and in my opinion, is a good stock to "back up the truck".
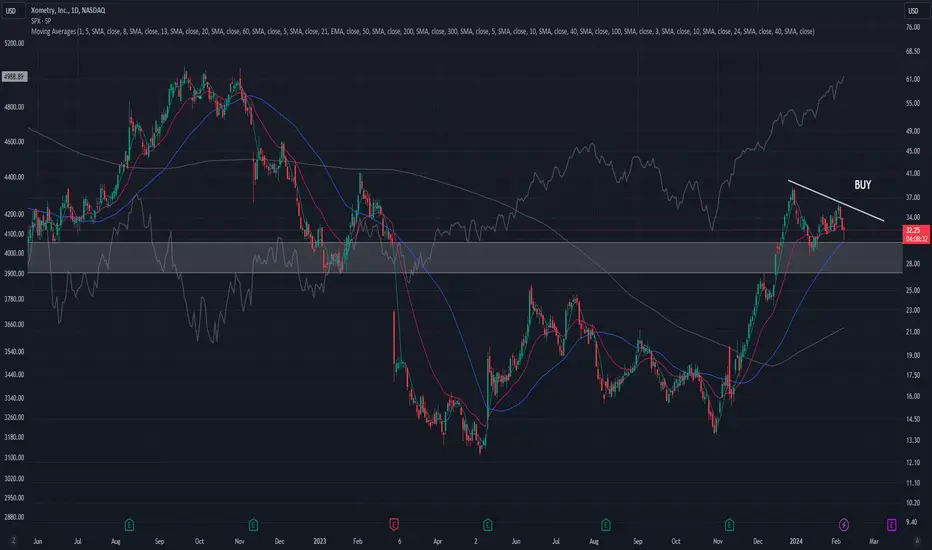
Carefull tech here comes industrialsProvides online manufacturing services which enable manufactured custom parts to be sold via xometry.com
NASDAQ:XMTR is forming a base just after it broke out a polarity zone around $30
The AMEX:XLI is making new highs along with AMEX:XLK and AMEX:XLC but the leaders are showing signs of exhaustion and some rotation to small cap might be underway
The AMEX:IWO is close of breaking out of a huge base
Lets wait and see!
Stocks at New All-Time Highs Ahead of Earnings: CATThis Dow component attempted a new all-time high and failed. However, it has ample support from the prior sideways trend after the previous all-time high. NYSE:CAT has been over-speculated as it moved out of its bottom low.
The company reports end of January. Watching to see how the stock performs in the next week or so should indicate whether it will be stuck range bound for another couple of quarters or if it will have the fundamentals to support a new high. For now, it has more of the appearance of a range bound sideways pattern developing.
Caterpillar Inc. did well during the years of huge real estate and city development in China. Unfortunately, the great industrial revolution of China is long gone, their population in decline due to fewer births and more deaths reducing their billions. Their consumer-based economy has slammed into Market Saturation as their population continues to age at a faster pace than any nation on earth. CAT needs to find another source for its machinery.
TSXV primed for a BULL RUN, which means SO ARE MINING STOCKSFor those into junior mining stocks, one of the best indicators of a bull run is the TSX Venture Exhange. Typically, when this chart bounces off oversold territory, it has led to strong bounces for most miners on this exchange and the overall mining sector.
A positive divergence is forming on the monthly. No guarantee it will hold up, but something to keep an eye on for sure.

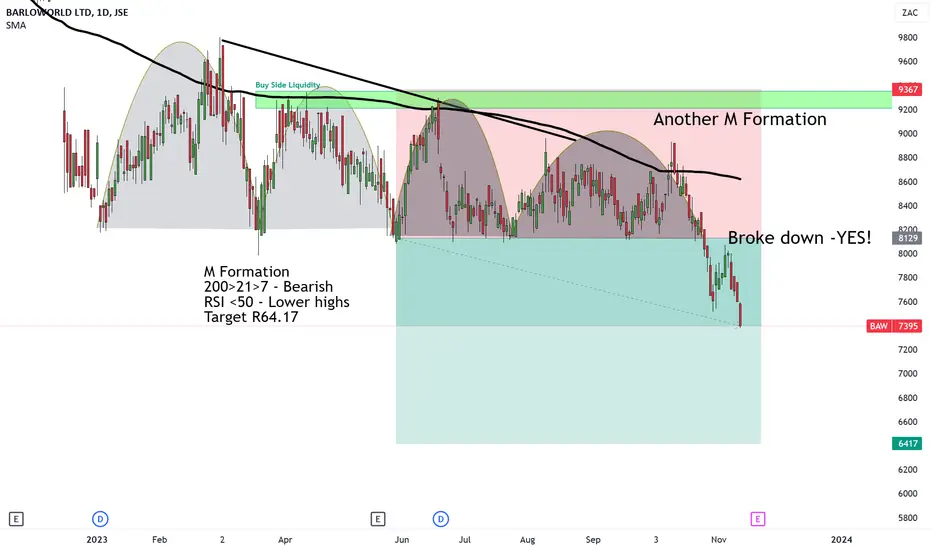
UPDATE: Barloworld M Formations! Not one but TWO for the down! In May 2023, I wrote to you saying I epxect Barloworld to drop.
ANd if you had the patience and just invested in this short, would be paying nicely by now.
Not only because the price is down but also with the time held you could have made some interest income from the short.
Anyway, there is nothing more confirming than when you have a Bearish formation like the M Formation and then you have ANOTHER Double Top.
ANd since the price broke below the neckline, it's been carnage for Barloworld.
The target remains at R64.17. And if it breaks below, I'll write another trading analysis...
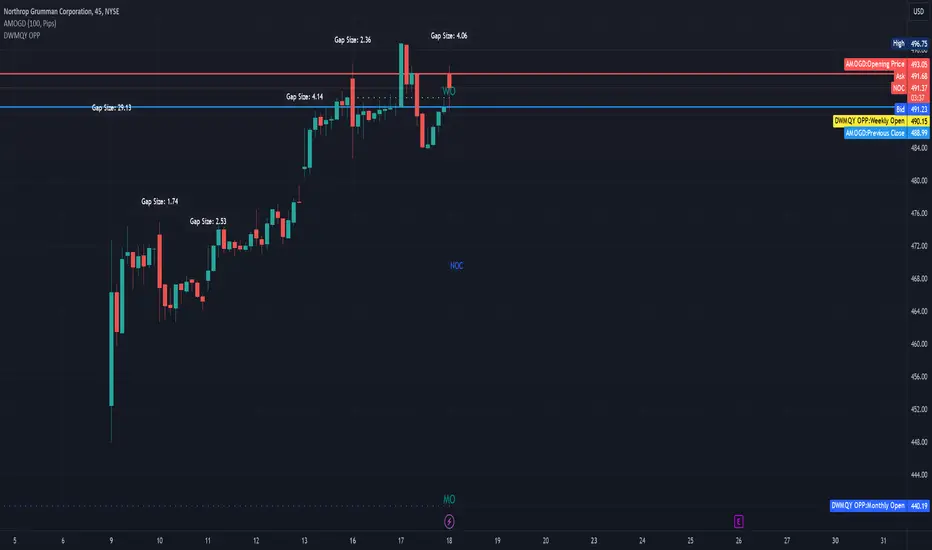
Northrop Grumman Corporation (NOC) October 2023 to April 2024
Northrop Grumman Corporation (NOC)
Fundamentals:
Market Cap: $73.996 billion
EPS (Earnings Per Share): $30.13
P/E Ratio: 16.232
Book Value: $102.293
Operating Margin (TTM): 11.49%
Profit Margin: 12.27%
Return on Assets (TTM): 8.45%
Return on Equity (TTM): 31.91%
Wall Street Target Price: $504.33
Revenue (TTM): $37.881 billion
Gross Profit (TTM): $7.474 billion
Recent Earnings:
Q2 2023: Actual EPS of $5.34 vs. Estimated EPS of $5.33 (Surprise: +0.1876%)
Q1 2023: Actual EPS of $5.5 vs. Estimated EPS of $5.09 (Surprise: +8.055%)
Q4 2022: Actual EPS of $7.5 vs. Estimated EPS of $6.57 (Surprise: +14.1553%)
Technical Indicators:
52 Week High: $547.6509
52 Week Low: $414.56
50-Day Moving Average: $436.8846
200-Day Moving Average: $453.325
Beta: 0.437 (indicating the stock is less volatile than the market)
Dividends:
Forward Annual Dividend Rate: $7.48
Forward Annual Dividend Yield: 1.53%
Payout Ratio: 29.72%
Performance Metrics:
YTD Return: -9.27%
1-Year Return: 4.55%
3-Year Return: 17.6%
5-Year Return: 11.52%
10-Year Return: 19.05%
Analysis:
Northrop Grumman has demonstrated a solid financial performance with a healthy profit margin and return on equity. The company's earnings have been consistently beating estimates, indicating strong operational efficiency. The stock's P/E ratio is relatively moderate, suggesting it might be fairly valued. The company also offers a decent dividend yield, making it attractive for income-seeking investors. However, the stock has underperformed YTD, which might be a concern for short-term investors. Given its industry positioning and financial metrics, it seems to be a stable investment for those looking at the defense sector.
XLI : No Buyers YetXLI has had a picture perfect breakdown.
We warned our members of this last week.
this pattern technically has more downside but it is very oversold and were approaching the breakout trend line as well as many weeks of consolidation & support.
A bounce is most likely as the daily chart is becoming exhausted to the downside.

XLI could be on the verge of breaking down. A close above the neckline negates the bearish pattern.
If Weak ISM data continues you could see more weakness in this sector.
A pair trade I'm watching is Long GE / Short XLI

Industrials are holding best, which stock is better?All these 3 stocks are leaders in the Building Materials industry.
NASDAQ:USLM is the clear leader between the 3, breaking from its 2022 highs earlier.
The technicals between NYSE:MLM and NYSE:VMC are very similar but, the fundamentals are another story.
Martin Marietta NYSE:MLM , produces crushed stone/sand/other aggregates for infrastructure/commercial/residential construction markets.
It has a +9% and +13% 3-year EPS Growth rate and Sales Growth rate respectively, while NYSE:VMC has -8% in EPS and +20% in Sales.
I prefer stocks with both EPS and sales trending together.
So, NASDAQ:USLM and NYSE:MLM are my choices.
