ITW WCA - Cup and HandleCompany: Illinois Tool Works Inc.
Ticker: ITW
Exchange: NYSE
Sector: Industrials
Introduction:
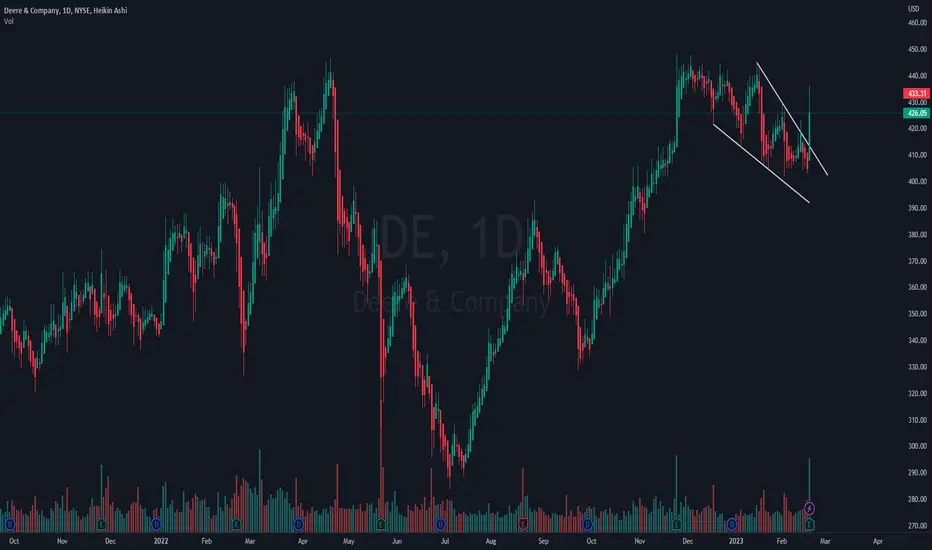
In this analysis, we are looking at Illinois Tool Works Inc. (ITW) on the NYSE, a noteworthy name in the industrials sector. The weekly chart suggests a possible bullish continuation in the form of a classic Cup and Handle pattern that has been forming for the past 608 days.
Cup and Handle Pattern:
The Cup and Handle is a bullish continuation or reversal pattern that depicts a teacup with a handle on the right side. It's characterized by a rounded bottom followed by a minor pullback, forming the handle.
Analysis:
The previous trend for ITW was upward, which was interrupted by a consolidation phase that materialized as a Cup and Handle pattern, potentially indicating a continuation of the bullish trend. The so-called "lip" or the horizontal resistance of the pattern is at 248.68.
The price is well above the 200-day exponential moving average (EMA), underlining our bullish sentiment. As we observe the current candle's behavior, it appears that we might achieve a close above the lip. A successful candle closure above this resistance could pave the way for a long position.
Conclusion:
In the event of a successful breakout, the price target would be projected at 515.51, corresponding to an estimated rise of about 30%.
Remember, this analysis should be one component of a broader market research and risk management strategy, and it's not intended as direct trading advice.
If you found this analysis helpful, please consider liking, sharing, and following for more insights. Here's to successful trading!
Best regards,
Karim Subhieh
Disclaimer: This analysis is for educational purposes only and should not be considered financial advice. Always conduct your own research and consult with a financial advisor before making investment decisions.
Industrials
ODFL WCA - Cup and HandleCompany: Old Dominion Freight Line, Inc.
Ticker: ODFL
Exchange: NASDAQ
Sector: Industrials
Introduction:
Today we are studying Old Dominion Freight Line, Inc. (ODFL) listed on the NASDAQ, a well-regarded player in the industrials sector. The weekly chart is indicating a possible bullish continuation based on a classic Cup and Handle pattern that has been forming over the past 608 days.
Cup and Handle Pattern:
The Cup and Handle is a bullish continuation or reversal pattern that mimics a teacup with a handle on the right side. It's defined by a rounded bottom, followed by a minor pullback that forms the handle.
Analysis:
The previous trend for ODFL was in an upward direction, which was interrupted by a consolidation phase that manifested as a Cup and Handle pattern, potentially indicating continuation of the bullish trend. The so-called "lip" or the horizontal resistance of the pattern is at 374.41.
The price is significantly above the 200-day exponential moving average (EMA), reinforcing the bullish sentiment. Notably, two weekly candles have successfully closed above the resistance level.
Conclusion:
In light of the successful close of the candles above the resistance, a long position might be considered. In the event of a successful bullish continuation, the price target is projected to be at 515.51, which corresponds to a potential rise of around 30%.
Remember, this analysis should be part of a broader market research and risk management strategy and is not direct trading advice.
If you found this analysis helpful, please consider liking, sharing, and following for more insights. Wishing you profitable trading!
Best regards,
Karim Subhieh
Disclaimer: This analysis is for educational purposes only and is not financial advice. Always conduct your own research and consult with a financial advisor before making investment decisions.

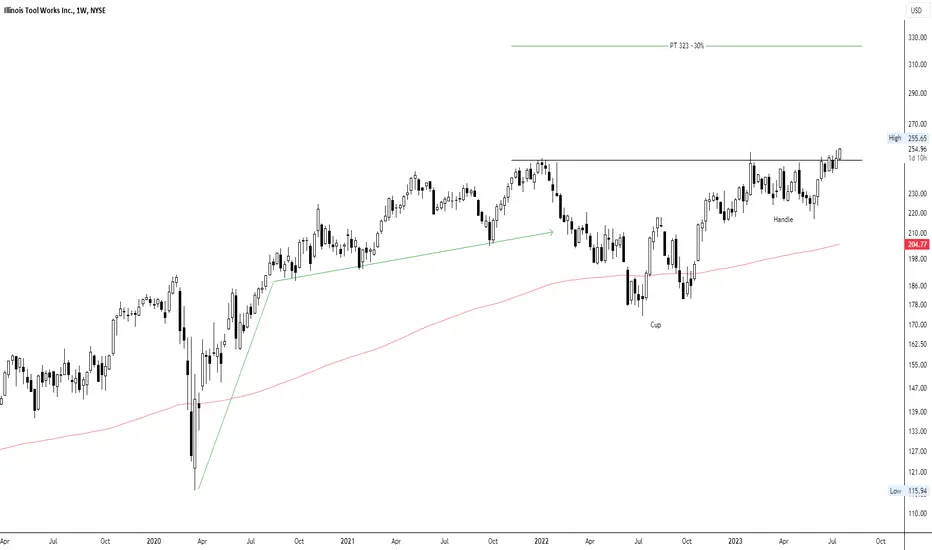
Dow Jones Possible Reversal & Recession in 2023looking for a strong rebound above 27.000
bullish target : 36.000+
possible deep recession in 2023.
trade with care.
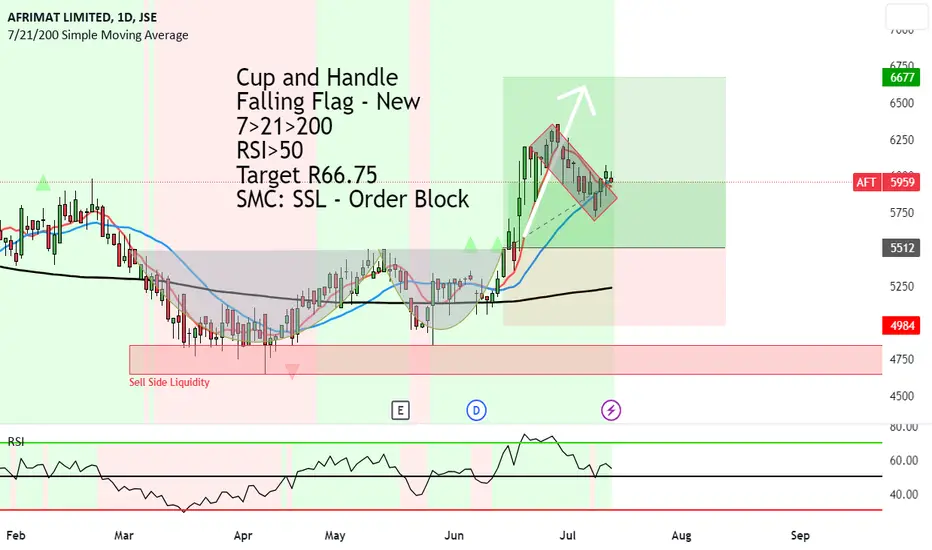
UPDATE: Afrimat on target to R66.75 and a new pattern arisesCup and Handle was the last pattern we used to make this prob prediction.
Lately, we have had the price fall into a Falling Flag consolidation formation.
And the price has already broken up and out of it.
This means, we can expect upside to continue and head to our first target of R66.75.
7>21>200
RSI>50
Target R66.75
ABOUT THE COMPANY
Afrimat Limited is a leading black empowered open pit mining company in South Africa.
Name:
Afrimat's name appears to be a combination of "Africa", reflecting its roots and primary operational region, and "mat", which could potentially be derived from "materials", representing the company's core business in supplying construction and industrial materials.
Founding:
Afrimat was founded in the early 1960s as the Lancaster Group, and was rebranded as Afrimat Limited in 2006.
Listing:
The company is listed on the Johannesburg Stock Exchange (JSE), and its listing took place in 2006.
Headquarters:
Afrimat's headquarters are situated in Durbanville, Cape Town, South Africa.
Operations:
Afrimat operates nationally in South Africa, and internationally in Namibia.
It provides a range of materials, including aggregates, industrial minerals, and commodities.
Aggregates:
The company started as a producer of building aggregates, but it has since diversified into a wide range of mining and related sectors.
Industrial Minerals:
Afrimat expanded into industrial minerals and now produces dolomite, limestone, silica, and others.
Leadership:
Andries van Heerden is the Chief Executive Officer (CEO) of Afrimat.
Ready to fly?After all this crazy volatility last week, on thing is clear, the DOW wants to break up. I chose this DOW stock, look at the consolidation. I thinks is going to pop soon.
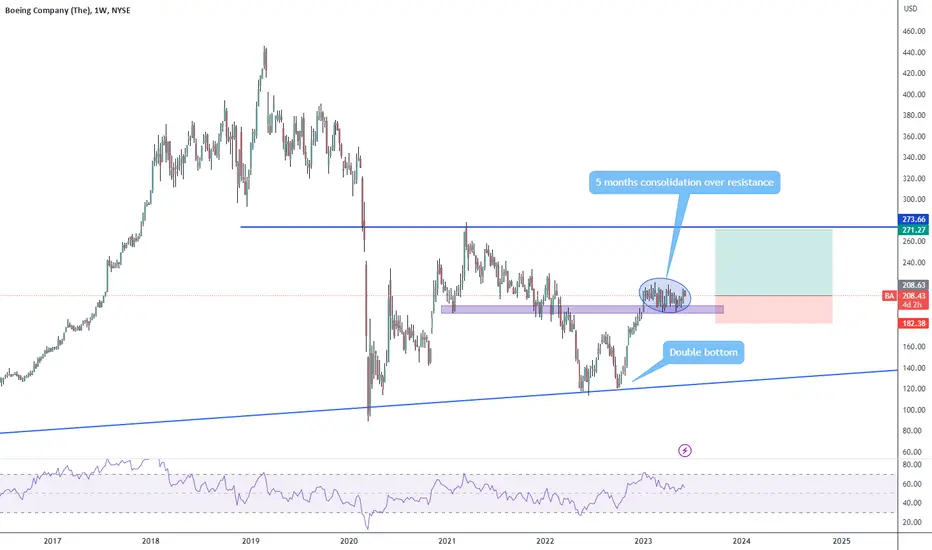
Dow Jones Industrials suddenly not looking too shabbyThe Dow Jones has been out on vacation for the first half of this year, not really participating in the melt-up, and instead, consolidating and working off that sharp rally from Q4 2022.
After all, it was one of the first indexes to bottom from the depths of the bear and start leading things higher.
But now after all of this sideways consolidation, it's starting to offer up a favorable reward-to-risk if it can build momentum over 34,500.
Perhaps a possible rotation into YTD leaders and back into industrials for the second half of the year? I'm not so sure about that yet, but it's a chart worth paying attention to.

Afrimat showing strong upside after C&H break up to R65.43Afrimat after a volatile period of ups and downs, seems to have chosen a direction.
It's been making higher lows, which has solidified the Cup and Handle formation.
We see indicators pointing up including:
7>21>200
RSI>50
My first target is to R65.43. This will give it enough room for upside and will give room in case the market jumps back down.
SMART MONEY CONCEPTS
Below the Handle and the Cup is clearly a Sell Side Liquidity Order Block.
With the wicks coming down and for the bodies closing near the highs, states that buying is stronger.
And so with SSL Smart Money buys into positions (and sweeps liquidity) from traders who are long (get stopped) and for short traders who enter into their trades.
ABOUT THE COMPANY
Afrimat Limited is a leading black empowered open pit mining company providing industrial minerals and construction materials in South Africa.
Founding: Afrimat was founded in 1965 as Prima Klipbrekers, primarily a mobile crushing company.
Name Origin: The name Afrimat is a combination of "Africa" and "Materials," indicating the company's African identity and its focus on materials.
Public Listing: Afrimat was listed on the Johannesburg Stock Exchange (JSE) in 2006.
Diversified Portfolio: Afrimat's portfolio of products includes crushed aggregates, limestone, silica, and other industrial minerals.
Geographic Reach: The company has operations across South Africa, has expanded into other African countries.
Acquisitions: Afrimat has grown through a series of strategic acquisitions, including Lancaster Quarries and the Glen Douglas dolomite mine.
Construction Materials: The company supplies construction materials, primarily concrete-based products, to the construction industry.
Industrial Minerals: Afrimat also has a strong presence in the industrial minerals sector, supplying materials for various industrial applications.

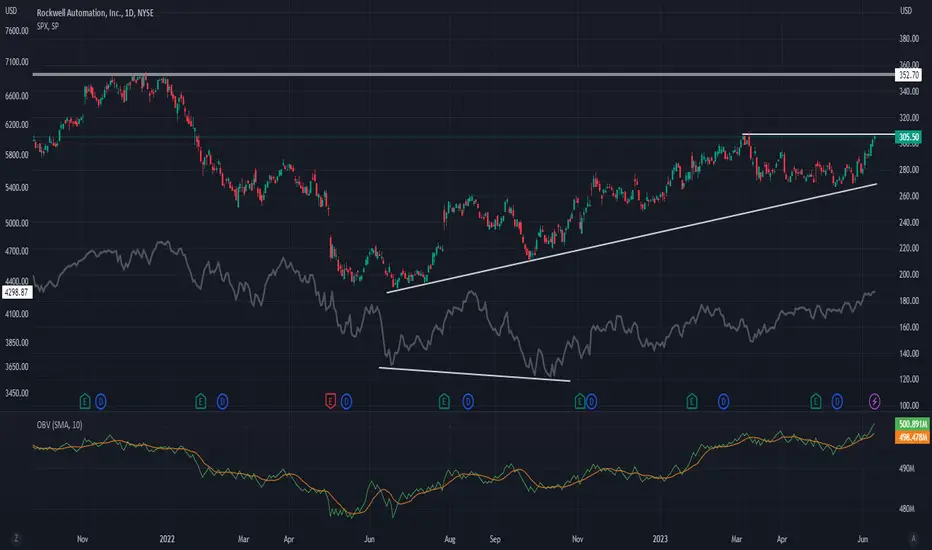
Is it time for industrials already? $ROKTechnology and Consumer Discretionary tend to lead the start of bull markets and Industrials should follow up.
The Industrials ETF AMEX:XLI is not outperforming the SP:SPX but, NYSE:ROK certainly is.
Maybe will be the sector's leader, is ranked #6 by IBD in its industry group ( AMEX:GAST ).
With higher lows and higher highs since June of 2022, Rockwell Automation is about to make new 52-week highs from a cup pattern. With the OBV already making new highs.
Will there be a handle? Maybe, it just had 4 weeks in a row closing higher. Let's wait and see.
I'd buy the breakout above $305 with a target sell at $350.
I don't know anymoreI'm tired of the Nasdaq, not sure what's going on in the market. Keeps pushing up for no reason. Anyway, this is a two weeks chart, looks like DOW is pushing to break up the consolidation. Some stocks like NYSE:CAT already broke up. I wouldn't be short even in VIX is in the basement. It may pull back but not much. This is a new era. Indicators means nothing, just see price action.

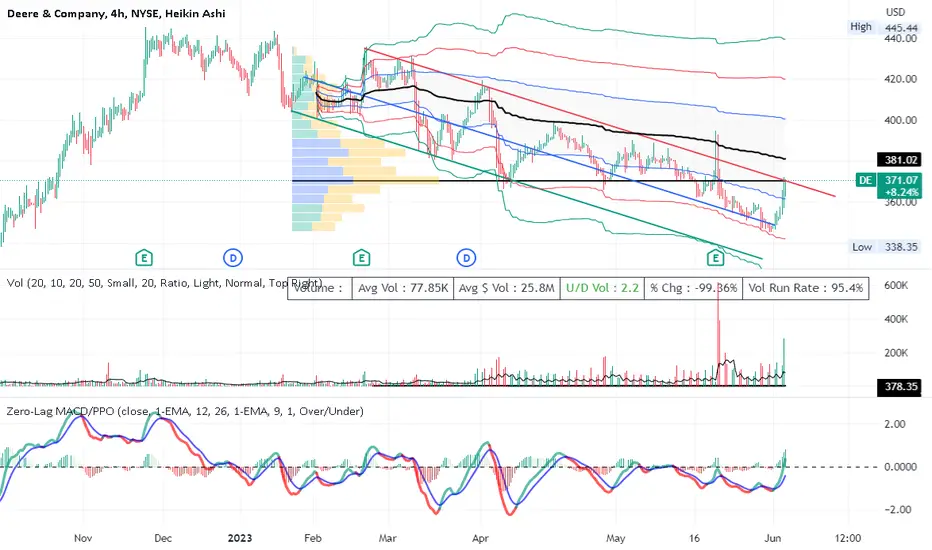
DE traders buy on favorable earningsDeere Company had favorable earnings in May reporting quarterly earnings of about 3.5 % on
their share's market price. DE is a blue-chip industrial sector stock comparable to CAT. It not
a fast mover but very suitable for options trading or investment. On the 4H chart DE had been
trending down through earnings in a descending parallel channel and relying on a lower VWAP
for support. At the middle of this past week, DE made its reversal move into a trend up. This
was accompanied by a change in the volume to predominantly buying volumes relatively high
compared with the period before the earnings. This surge of volume of sorts is the fuel for
upward price action. The zero-lag MACD indicator shows moving average divergence Price is
breaking out of the channel moving towards the mean VWAP and POC line of the volume profile.
demonstrating bullish momentum. Accordingly, I see DE as well setup for a long trade.
( SL $345 pivot low TP1 $400 ( 1 std above mean VWAP ) TP2 $420 ( 2 std above mean VWAP)
✨ NEW: 3M (MMM) ✨ Swing/Position Trade ✨SLO @ 124.50 ⏳
TP1 @ 85.20
TP2 @ 60.00
BLO @ 52.80 ⏳
ADDITIONAL INFO:
Based on the fundamental analysis below, I'm anticipating a swing to the upside before price action returns to the downside and continues to drop toward Demand (75D). Once we reach Demand @ ~52.80, I'll hold this equity as a Position Trade up to Major Resistance @ ~175.75.
COMPANY REVIEW:
3M makes for a great investment because it is a diversified technology company that produces a wide range of products, including adhesives, abrasives, coatings, electronic materials, industrial tapes, medical supplies, and more. The company has a strong track record of innovation and growth, and it is one of the largest and most respected companies in the world.
3M has announced plans to invest $1 billion in research and development over the next five years. This investment will help the company to develop new products and technologies that will drive future growth.
FINANCIAL PERFORMANCE:
3M has consistently generated strong financial results over the past few years. In the most recent fiscal year, the company reported revenue of $33.8 billion and earnings per share of $10.33. 3M's return on equity (ROE) is 36.1%, which is significantly higher than the average for the S&P 500 index. 3M's stock price has been on the rise in recent months. The stock price has increased by over 20% in the past year. This is likely due to a number of factors, including the company's strong financial performance, its positive outlook for the future, and the previously low interest rates environment.
VALUATION:
3M's stock is currently trading at a price-to-earnings ratio (P/E) of 10.1. This is below the average P/E ratio for the S&P 500 index, which is 15.7. This suggests that 3M stock may be undervalued.
DIVIDENDS:
3M is a dividend-paying company. The company has increased its dividend for 60 consecutive years, which is a testament to its strong financial performance. The current dividend yield is 6.19%, which is higher than the average dividend yield for the S&P 500 index.
RISKS:
There are some risks associated with investing in 3M stock. (1) The company faces competition from other global manufacturers, (2) it is also exposed to economic downturns related to the technology sector, and (3) the raised interest rates, by the Feds, opposed to 3M's stock price. When interest rates are increased, investors are more likely to lessen their investment in stocks, However, 3M has a strong track record of innovation and growth, which should help it to mitigate these risks.
However, it is important to do your own research before making any investment decisions. You should consider your own financial situation and risk tolerance before investing in any stock.

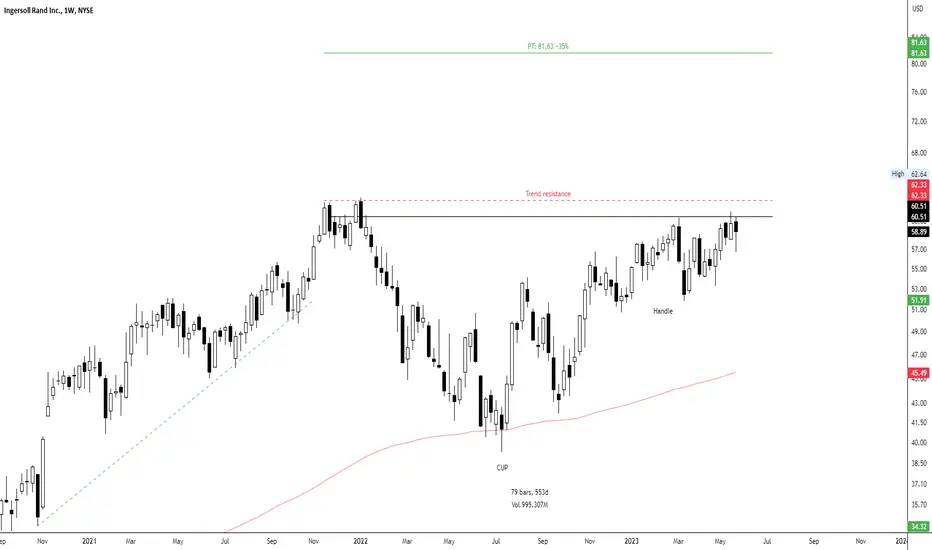
Ingersoll Rand Inc WCA - Cup and HandleCompany: Ingersoll Rand Inc.
Ticker: IR
Exchange: NYSE
Sector: Industrials
Introduction:
In today's technical analysis, we turn our attention to Ingersoll Rand Inc. (IR), a key player in the Industrials sector, listed on the NYSE. The weekly chart is demonstrating a potential Cup and Handle formation, a well-known bullish reversal and continuation pattern. This pattern has developed over a period of 553 days, suggesting a possible breakout on the horizon.
Cup and Handle Pattern:
This Cup and Handle pattern is a bullish continuation pattern that occurs during an uptrend and represents a period of consolidation followed by a breakout. It is characterized by a "cup" formation, followed by a smaller consolidation period called the "handle."
Analysis:
Previously, IR's chart was showing a clear uptrend, indicated by the green dashed line. Now, we are witnessing a consolidation phase that appears to take the form of a Cup and Handle pattern.
The horizontal resistance is at $60.51, and the price is comfortably above the 200 EMA, signaling a bullish environment. A breakout above this resistance level could be a potential entry point for a long position.
However, this setup also presents a unique condition, a natural breakout filter, in the form of a secondary resistance level at $62.33. A convincing breakout would ideally surpass both these resistance levels.
The potential price target, if both resistance levels are broken, is set at $81.63, signifying an upside of approximately 35% from the breakout level.
Conclusion:
IR's weekly chart reveals an interesting setup with a potential Cup and Handle pattern. This could suggest a continuation of the previous bullish trend. This setup is currently a watchlist candidate and not a direct trading recommendation.
As always, this analysis should be used as part of your comprehensive market research and risk management strategy. Please remember, this is not financial advice and investing always involves risk.
If you found this analysis helpful, please consider liking, sharing, and following for more insights. Wishing you profitable trading!
Best regards,
Karim Subhieh
TARGET REACHED for KAP Limited at R2.25 - WarningReversal Diamond Formation formed on the Daily chart.
This formation is a normally a big fight between the bulls and the bears.
Once the price breaks below it, sets the bar for the next momentum slide.
Which in this case was down.
We had other indicators confirming the downside to come including.
200>21>7 _ Bearish
RSI <30 - Bearish
And our first target was at R2.25 which hit yesterday.
It was a LONG hold but at least, some traders would have banked daily interest from shorting. Right now it's dangerous to just buy the stock because the price is so low. instead we need the market to turn and move in an uptrend establishment before we buy. Until then, I expect the market to continue to drop which I'll save the analysis for another day.
EXTRA FACTS ABOUT KAP LImited you may not know.
Formation:
KAP Industrial Holdings Limited was established in 2004.
Diversified Operations:
KAP's operations are diversified and extend across sectors such as logistics, passenger transport, manufacturing, and distribution.
Major Subdivisions:
The company operates in two main divisions: diversified industrial and diversified logistics.
Global Presence:
KAP has a broad geographical footprint and operates in more than 20 countries, primarily in sub-Saharan Africa and parts of Europe.
Noteworthy Brands:
The company owns or is involved with numerous well-known brands such as Unitrans, PG Bison, Feltex, and DesleeMattex.
The company's name, "KAP," is an acronym which stands for "Klipspringer, Algoa, and Peninsula," representing the names of three South African buses that were part of the company's origins.

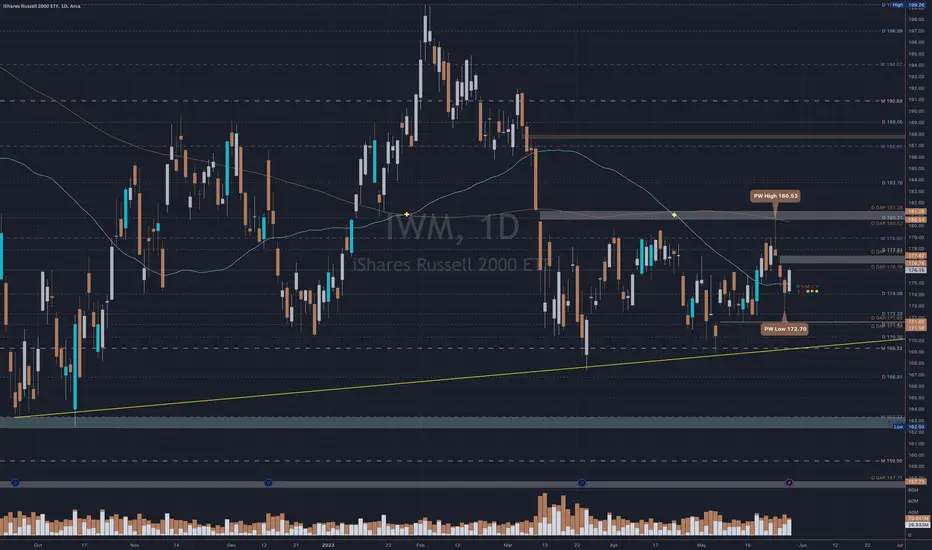
$IWM Outlook 05/30 - 06/02 @capgainsgroupAs the S&P 500 and the NASDAQ rally into the green for the year, the Russell 2000 (aka the small cap index) has lagged behind and is barely green at +1.03% YTD for 2023. One of the reasons why this index hasn’t been doing well can be attributed to the index’s 15.18% allocation in the Finance Sector. Failing regional banks such as Silicon Valley Bank ( NASDAQ:SIVB ) and Signature Bank ( OTC:SBNY ) haven’t helped the index much.
Investors who would like to play the Russell 2000 should pay attention to the 5 major sectors that makes up 73.23% of AMEX:IWM : Health Care (17.62%), Industrials (16.66%), Financials (15.18%), Information Technology (12.74%), and Consumer Discretionary (11.03%).
Technical Analysis:
AMEX:IWM recently formed a Death Cross (50 SMA x 200 SMA) on the daily chart in mid April. Although not very clean, there is a support uptrend line dating back to October 2022. Also, it seems like we have a head and shoulders pattern, using the Daily 170.30 level as the neckline.
Bulls will want price to reclaim the weekly 178.90 level as a support.
I lean bearish on this index. If AMEX:IWM can’t reclaim the two daily gaps above, at 176.74 - 177.42 and 180.53 - 181.28, I expect it to come down and test the yellow uptrend line and potentially break it to the downside in the coming weeks.
Upside Targets: 176.74 → 177.42 → 180.71 → 181.28 → 183.76 Extended: 186.91
Downside Targets: 174.09 → 172.33 → 171.41 → 170.30 → 169.32 Extended: 166.81
Industrials edging higherThe JSE:STXIND is on the verge of printing a new all-time high. The ETF itself can be bought, one can also consider looking at the ETF holdings to check if the holdings are also at or moving towards buy zones.
Tree in the forest approach.

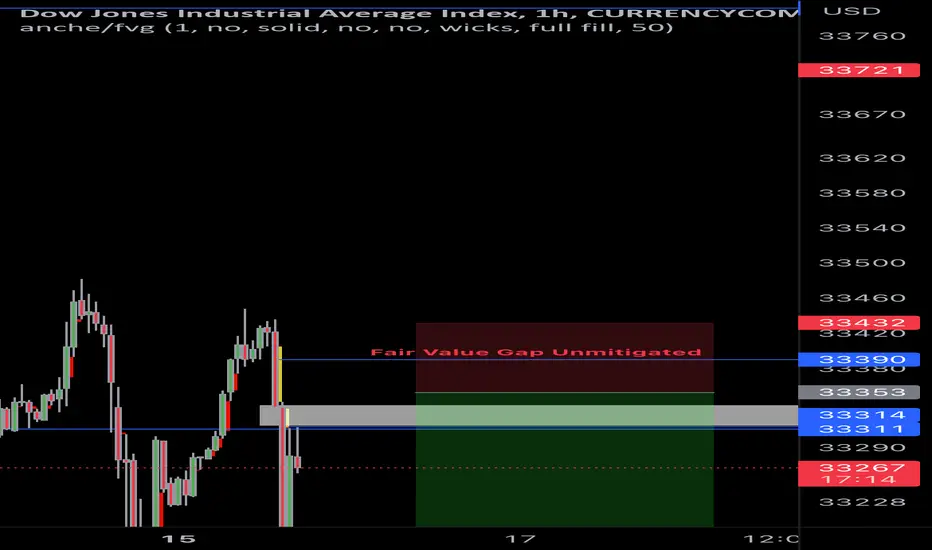
US30 short- unmitigated fair value gapUs30 unmitigated fair value gap-price has been very bearish we saw a return to the FVG where algorithmic traders would see this as a fair price to short, following the daily and weekly market sentiment
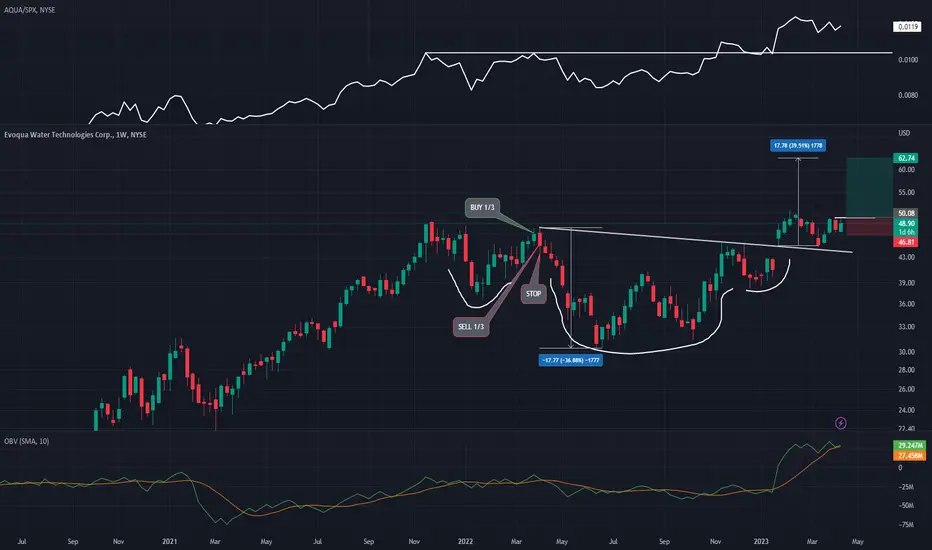
$AQUA with the trifecta: price, volume & relative strengthThe price has formed a head and shoulders pattern and now I'm waiting for the follow through above $50.
The OBV and the RS ratio vs the S&P 500 are near new highs confirming the strength in price action.
Still, I'll wait for the breakout to buy with a price target at HKEX:62 for a +25% profit.
You can see that I was stopped out on MARCH 2022, can you imagine if I hadn't use a stop loss? More than a year with dead money.
I good to see other leaders within the industry like NASDAQ:TAYD , NYSE:SXI , NYSE:GHM & NASDAQ:SYM are also trending higher, this gives support to $NYSE:AQUA.
This is a market of stocks, not a stock market!
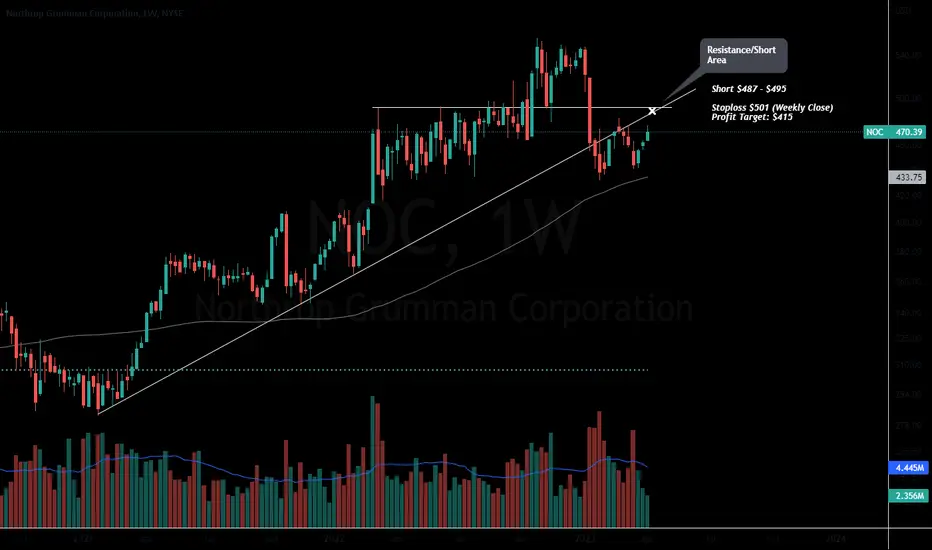
NOC : Industrials Could see wekanessNOC is on watch for a techncial retrace to resistance and an important daily gap.
With earnings approaching we may see the larger trend take place. The chart is looking vulnerable to more downside.
A rally back to resistance will be a better risk to reward setup.
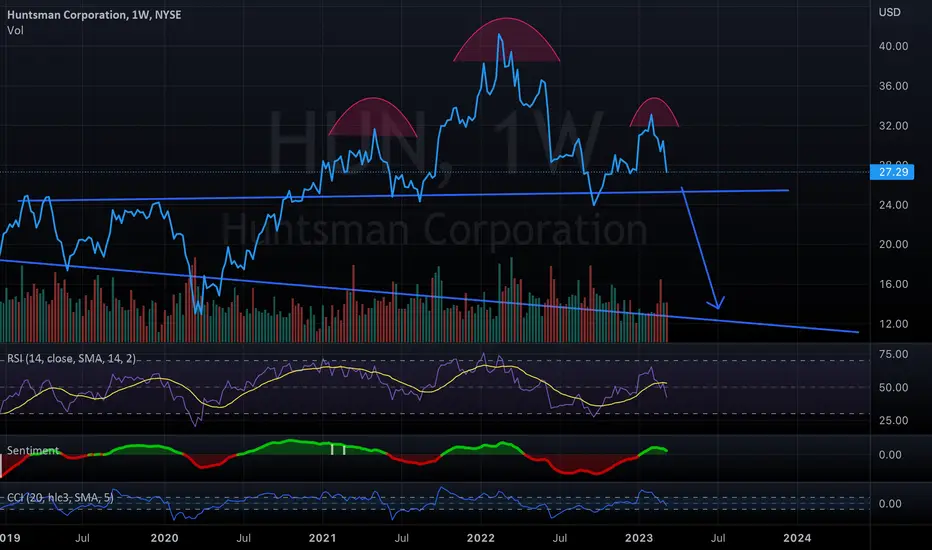
Topping Pattern Example (Head and Shoulders)Hunstman is a chemical manufacturer whose earnings have plummeted over 85% compared to the first half of 2022. The chart is a prime example of a large head & shoulders pattern. Analysts expect its earning to remain depressed and the chart shows signs of Distribution over the past 2 years.
Wire (Encore Wire) is an Industrial with a high and tight flag. I don't normally play high and tight flags in a general bear market, but industrials have been strong since last year, and this company just is kicking butt. Encore wire scores an A) in cash flow, growth, price momentum, and profit health, and a B) in relative value. According to Finbox models, this stock has an upside of 37.3%. And zero debt. Wire and cable. Think electric vehicles, etc.
High and tight flags have been backtested as 67% continuation patterns in the general trend (up). The reason they are so successful is that at new highs, there are no sellers above.
Not a recommendation, just an idea.

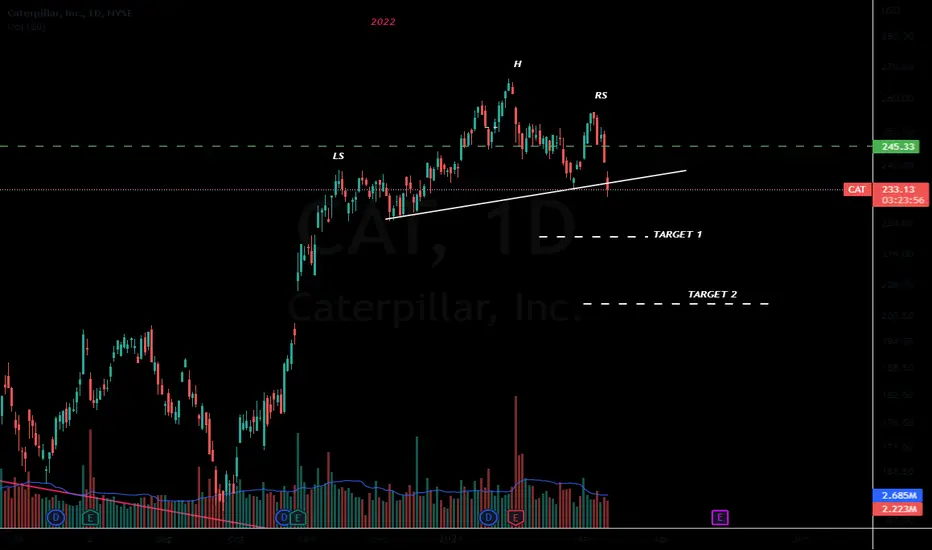
CAT - Technical Breakdown on watchCaterpillar is on the verge of triggering a bearish topping formation.
This stock has been a powerhouse during the rising rate environment.
if this market leader breaks down its signaling weakness in the economy and likely the industrial sector.
XLI is in a strong uptrendI noted a while back the bullish look for industrials, despite bearish sentiment in other sectors. XLI began its current bull trend at an intermediate bottom on 9/26/22, and really started a strong uptrend on 11/14/22. It sits well above the cloud on the weekly. XLI is poised to overtake it's 52 week high at 105.23 in the near future. From there, we can look at a new all-time high above 107.65. I am leery of a new all time high before the summer, since I am a firm believer of sell in may and go away. But I do expect a new all time high by the fourth quarter of 2023.

Bull flag breakout on Deere and CompanyBull flag breakout on Deere and Company. I will wait to see if there is a retest of the upper trendline which was acting as resistance