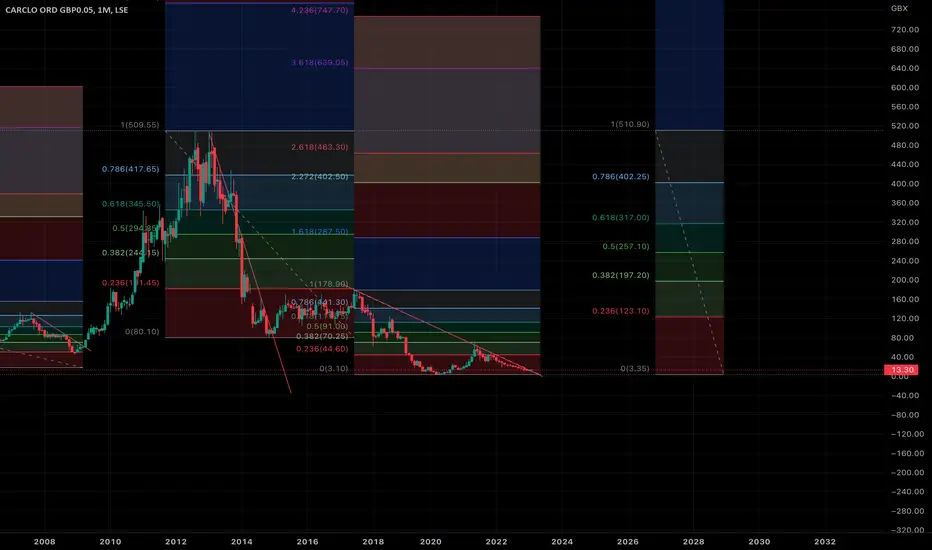
Breakout for a 2,200%-plus return?This is Carclo, an industrial share listed on the London Stock Exchange’s Alternative Investment Market. It looks like it is breaking out from a 68-month decline that, if the past is any guide, could return huge multiples on any investment at this stage.
Some of this company’s subsidiaries have been trading almost 100 years, but this century it has been a hugely volatile share. It began with the general market decline after the dotcom bubble at the turn of the millennium. A major slide in price was triggered in June 2000, bringing it down almost 90% from peak to trough across 33 months.
It took 26 months for the share to rebound to the 50% Fib (this share loves a Fibonacci level) and, after hitting resistance there, retraced to the .382 Fib where it bobbled along for the best part of a year. By August 2007 it had risen 650% from the bottom.
But then came a double top and another major decline, hitting resistance at the 50% Fib in September 2008 and setting eight months’ worth of relative equal highs from there. (A very nice trading range, that.)
Price reversed again at the .236 Fib and this was where the fun started. Across the next four years, Carclo rose 1,000%, trough to peak.
Since that January 2013 peak, another double top almost 10 years ago to the day, Carclo has been in seemingly terminal decline. There can’t be many bulls left to sell and you get the sense capitulation is around the corner.
Although there was a slight recovery in price from November 2014 to June 2017 (31 months), it met resistance at the .236 Fib and rolled over again. The peak-to-trough decline, at the nadir of the Covid lockdowns in 2020, was 99.19%.
But this is no junk share. It has had its problems with its pension liabilities and with debt but it has arranged new banking facilities with its lenders that give it good headroom. Net assets are almost £30m against a market cap of <£10m.
But the key thing is how *every single time* this share has opened on the monthly above the trendline after a multi-month decline, it has sparked a tremendous rally in price over the medium term. It opened above again yesterday. I’m eyeing as my first TP the 50% Fib on the most recent decline, where there are five months of relative equal highs to mitigate.
From there, a return to the .618 Fib on the broader, 67-month downtrend would also draw price to the monthly swing low and ICT fair-value gap from June 2013, which also remains unmitigated. And if you believe in cups and handles and head-and-shoulders patterns, there’s every reason to believe a C&H and inverse H&S could form very soon.
Hitting the .618 Fib at 317p would constitute a near 2,200% return for anyone investing today. Better still, given the current zeitgeist of war and ageing populations, Carclo’s specialisms (e.g. heavy-duty cabling for the aviation industry and technical plastics for the medical sector) could create a new era of enormous value for the business. Who’s to say it wouldn’t rocket beyond old support-and-resistance levels to make new ATHs?
After all, this share has made big, big moves before.
BUT DYOR. GLA.
Industrials
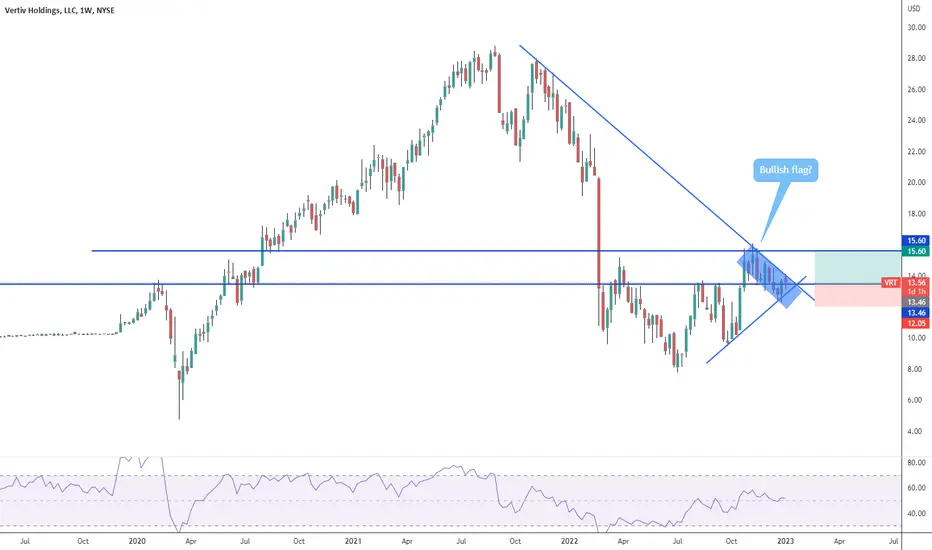
Will it come back?I'm holding this industrial stock in my long term portfolio. Looks that is going to break up the triangle. First target would be at $15.6 but I'm holding this one for the months even years to come. I thing it has great potential to the upside.
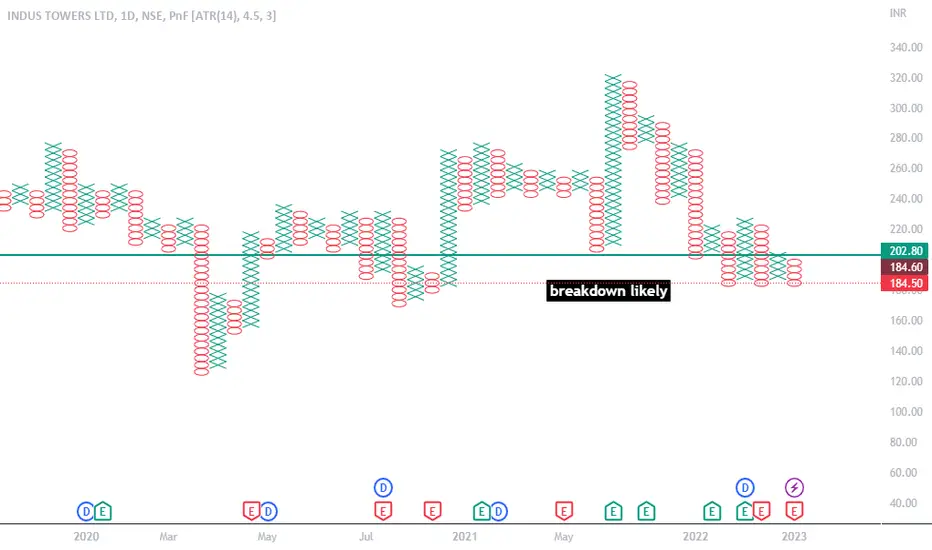
indus towerweak counter
likely to show a breakdown below 180
the counter is facing resistance on every upmove
it can witness a decent downmove
#shortsell candidate
Bearish AB=CD on the SPDR Select Industrial Sector ETFThere is a Logscale AB=CD on the Industrials with Bearish RSI Divergence and the 1.414 PCZ of the Logscale AB=CD aligns with the 1.618 on the Linear Scale. I think it would be fitting to see this go down as i have recently become Bearish on Defesne Stocks such as RTX and HON, and have also become bearish on Airline Stocks such as BA and those stocks all happen to be in the top 10 holdings of this ETF so if they go down this ETF will go down. The standard Target for an ABCD like this is back to the C level which is around $47 in this case but for the time being i will target $80 via buying of the $90 Puts that are several weeks out.

Caterpillar Crawls to New HighsIndustrial stocks have outperformed in recent months as investors shift toward cyclicals. Today’s chart focuses on Caterpillar, a potential beneficiary of infrastructure spending in the U.S. and a recovery in China.
The first patterns are the pair of highs from the last two years. CAT challenged $237.90 (the peak from April 2022) several times in November before breaking through in December. The stock bounced at the same level early this year, which may suggest old resistance is new support. (See the small white arrows on the chart.)
Next is the June 2021 high of $246.69. Prices jumped through that level to a new high on Friday. They retested on Monday and are trying to hold it today. (Additionally, the weekly chart had a bullish outside candle.)
You also have a gap higher on October 27 after earnings and revenue beat estimates. Four weeks later, the 50-day simple moving average (SMA) had a “golden cross” above the 200-day SMA.
Finally, MACD has turned positive again after a month of declines.
TradeStation has, for decades, advanced the trading industry, providing access to stocks, options, futures and cryptocurrencies. See our Overview for more.
Important Information
TradeStation Securities, Inc., TradeStation Crypto, Inc., and TradeStation Technologies, Inc. are each wholly owned subsidiaries of TradeStation Group, Inc., all operating, and providing products and services, under the TradeStation brand and trademark. TradeStation Crypto, Inc. offers to self-directed investors and traders cryptocurrency brokerage services. It is neither licensed with the SEC or the CFTC nor is it a Member of NFA. When applying for, or purchasing, accounts, subscriptions, products, and services, it is important that you know which company you will be dealing with. Please click here for further important information explaining what this means.
This content is for informational and educational purposes only. This is not a recommendation regarding any investment or investment strategy. Any opinions expressed herein are those of the author and do not represent the views or opinions of TradeStation or any of its affiliates.
Investing involves risks. Past performance, whether actual or indicated by historical tests of strategies, is no guarantee of future performance or success. There is a possibility that you may sustain a loss equal to or greater than your entire investment regardless of which asset class you trade (equities, options, futures, or digital assets); therefore, you should not invest or risk money that you cannot afford to lose. Before trading any asset class, first read the relevant risk disclosure statements on the Important Documents page, found here: www.tradestation.com .

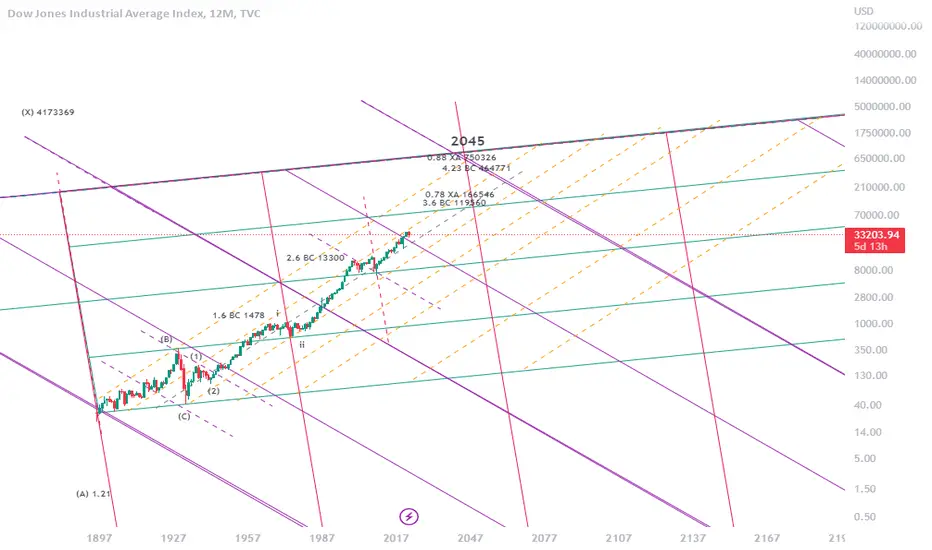
This is a wild ideaLooks that the market likes industrial stocks during crisis. The DOW is bouncing off the previous resistance now support.

what will happen in 2045?it seems we will have the biggest crash in the history in 2045. but what will be the reason? nulear war? climate change? or?
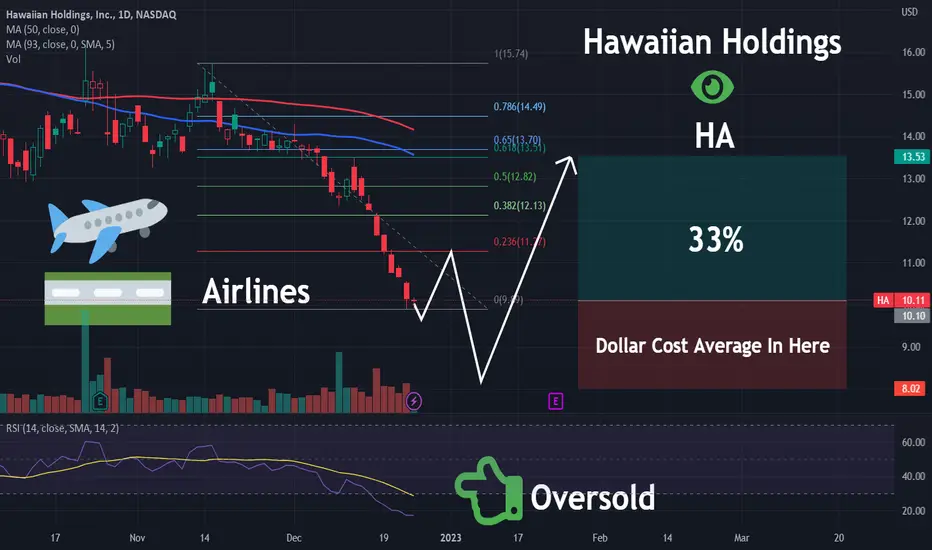
HA | About to Take Flight | LONGHawaiian Holdings, Inc., through its subsidiary, Hawaiian Airlines, Inc., engages in the scheduled air transportation of passengers and cargo. The company provides daily services on North America routes between the State of Hawai'i and Long Beach, Los Angeles, Oakland, Sacramento, San Diego, San Francisco, and San Jose, California; Las Vegas, Nevada; Seattle, Washington; Portland, Oregon; Phoenix, Arizona; and New York City, New York. It also offers scheduled service between the State of Hawai'i and Austin, Texas; Boston, Massachusetts; Orlando, Florida; and Pago Pago, American Samoa. In addition, the company provides daily service on its Neighbor Island routes among the four major islands of the State of Hawai'i. Further, it offers scheduled service on its international routes between the State of Hawai'i and Tokyo (Narita), Japan, Osaka, Japan; Sydney, Australia; Papeete, Tahiti; and Seoul, South Korea, as well as operates various ad hoc charters. Hawaiian Holdings, Inc. distributes its tickets through various distribution channels, including its website hawaiianairlines.com primarily for North America and Neighbor Island routes, as well as through travel agencies and wholesale distributors for its international routes. As of December 31, 2021, the company's fleet consisted of 19 Boeing 717-200 aircraft for the Neighbor Island routes; 24 Airbus A330-200 aircraft; and 18 Airbus A321neo for the North America and international routes. Hawaiian Holdings, Inc. was incorporated in 1929 and is headquartered in Honolulu, Hawaii.
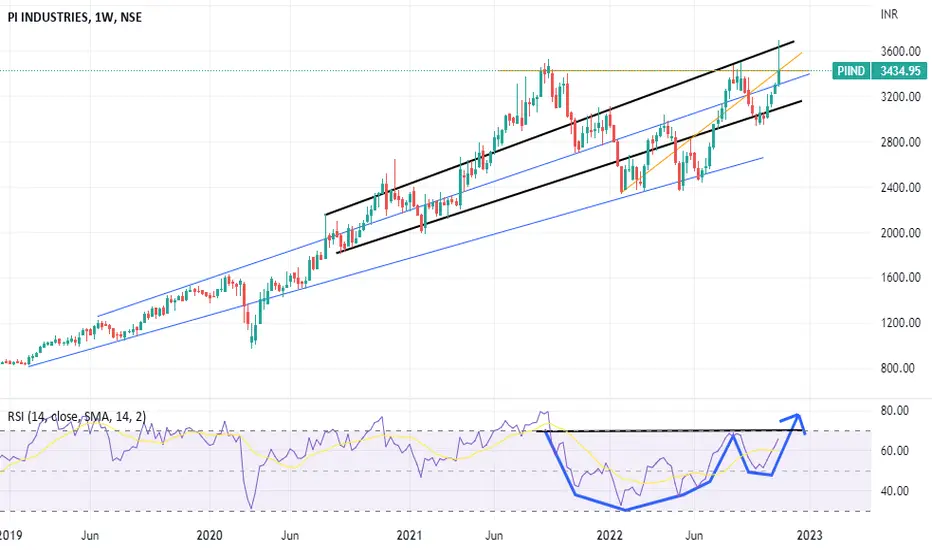
PI INDUSTRIES ANALYSIS!!RSI INDICATOR: is something which says the actually part of the price should be placed.
cups and handles is a very bullish price pattern formation.
and top of that, if rsi indicator is forming such pattern, then to speak on to it, the stock is a very great stock.
i have check the fundamentals. the rations, sales analysis are very greatly performing.
the two black line are the trend formation after the corona 2019 crash.
and blue line is the old trend.
the stock did gave its all time high recently. its possible to go more higher, since there is no drawback, or major risks associated to this stock.
recent quarters too outperformed from the analyst projected estimates.
great stock for swing trading and long term .
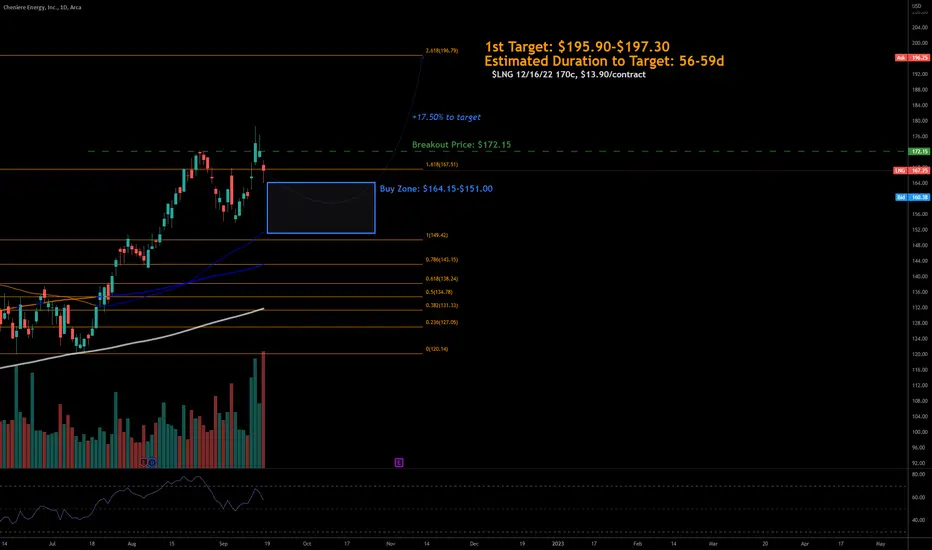
9/18/22 LNGCheniere Energy ( AMEX:LNG )
Sector: Industrial Services (Oil & Gas Pipelines)
Market Capitalization: $41.776B
Current Price: $167.25
Breakout Price: $172.15
Buy Zone (Top/Bottom Range): $164.15-$151.00
Price Target: $195.90-$197.30
Estimated Duration to Target: 56-59d
Contract of Interest: $LNG 12/16/22 170c
Trade price as of publish date: $13.90/contract
Trouble Ahead For DeereTechnicals: This is not at all a perfect short setup solely off of the technicals. With that in mind, some clear signs of weakness can be seen in DE's weekly chart. One such sign was the new lower low formed at around 285 in July, which broke DE from its previous trading range of around 310-400 a share. Deere's recent bull rally since July's new low I find to be relatively weak due to lower volume. MACD (momentum) on the weekly has sustained a bullish cross. Monthly MACD is still positive yet a bearish cross has occurred. While the MACD on the daily timeframe is signaling a relatively strong uptick in momentum on the shorter timeframe. Despite the bullish momentum on the daily, the longer-term momentum indicators are signaling that there will be a sustained period of underperformance ahead for DE.
Fundamentals: Earnings for DE are on the 18th. P/B ratio of roughly 6. P/S of around 2.5. Debt to assets of 2.6. These all appear to me a bit weak. That being said, Deere's profit margins have expanded quite nicely over the last couple of years. I am not very excited about their margin growth, as I see global inflationary pressures providing headwinds for Deere's intermediate-term profitability. Overall, DE is an overvalued stock with little potential for further upside gains in my opinion (especially with the global macro picture steadily deteriorating).
Prediction: I do believe the short-term momentum will carry DE up to the 378.32 resistance, likely before earnings are announced on the 18th. Earnings will be a major risk event for DE traders. Should earnings come in higher than expected DE could easily rally above 378.32 and into 398.36 territory, possibly even higher (just look at WMT and HD's price action after their beats earlier today). If Deere comes out with disappointing earnings and/or worrisome guidance we should see a sharp sell-off, ultimately causing a move that allows for a retest of support zones in the 316.71 to 277.09. Earnings risk is something I generally avoid when trading, but the risk to reward for adding a DE short position at the moment almost looks too attractive to pass up. With earnings coming in so soon, it is hard to give a decisive prediction. That said, I will fall back on my underlying thesis, that Deere is overvalued and is facing technical and economic headwinds. I expect to see serious volatility in DE trading over the coming weeks, which eventually will lead DE back down to the 285 low, possibly even grinding into new lows testing support of 236.59.
As always this is not financial advice. Good luck!

$BW ~ Interesting after correction...Beautiful EW structure and now that a five wave structure on the upside, we should have the direction of the trend. Will need to wait for correction to complete then maybe a interesting opportunity in the industrial sector.

BASF SE (BAS.de) bullish scenario:The technical figure Triangle can be found in the German company BASF SE (BAS.de) at daily chart. BASF SE is a German multinational chemical company and the largest chemical producer in the world. The Triangle has broken through the resistance line on 27/05/2022, if the price holds above this level you can have a possible bullish price movement with a forecast for the next 8 days towards 53.32 EUR. Your stop loss order according to experts should be placed at 48.62 EUR if you decide to enter this position.
German chemical group BASF (BAS.DE) warned it could be hit by the fallout from Russia's invasion of Ukraine and counter measures in China to curb rising coronavirus infections. However, the world's biggest petrochemical firm's margins jumped as it benefitted from passing soaring raw material costs to industrial customers.
Risk Disclosure: Trading Foreign Exchange (Forex) and Contracts of Difference (CFD's) carries a high level of risk. By registering and signing up, any client affirms their understanding of their own personal accountability for all transactions performed within their account and recognizes the risks associated with trading on such markets and on such sites. Furthermore, one understands that the company carries zero influence over transactions, markets, and trading signals, therefore, cannot be held liable nor guarantee any profits or losses.

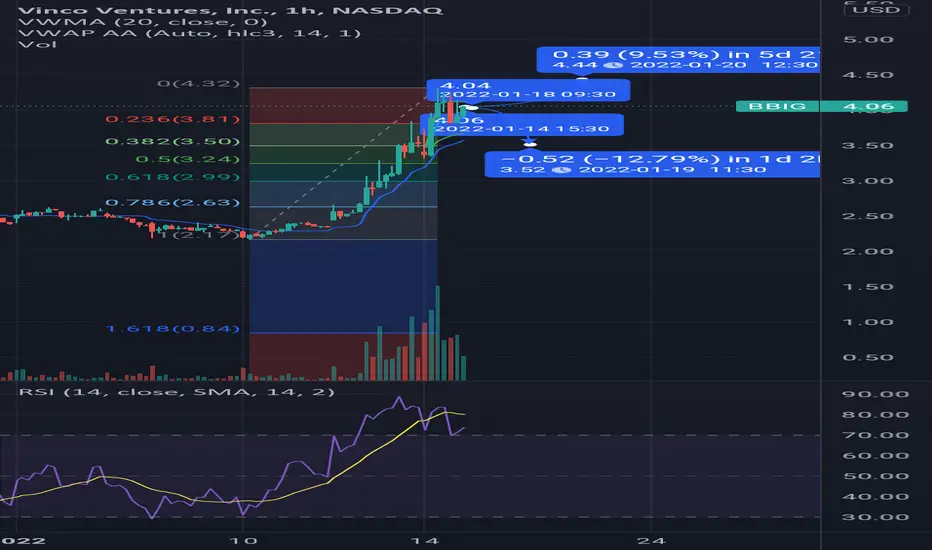
bbig overbought hourly (bbig)its interesting to think this stock could be worth over $5 at some point when not long ago this thing was chilling in the low $2s.
theres no technical indications that the bull trend is over for the hourly picture, but oscillators are saying it is overbought
if we keep cloaing hours above aavwap/vwma and the .382 i dont see anything wrong with targeting $4.48
that being said the .382 is a reasonable short target
$ZIM: Zoom w/ ZIM?Industrial / shipping company ZIM is setting up nicely for a run as the market has continued to build value

$APG: Safety First!Industrial stock APG is showing a potential weekly breakout as infrastructure looms. The bill's passage hangs in the balance however this company can still be good for the patient investor with an ESG mindset. Good luck trader!

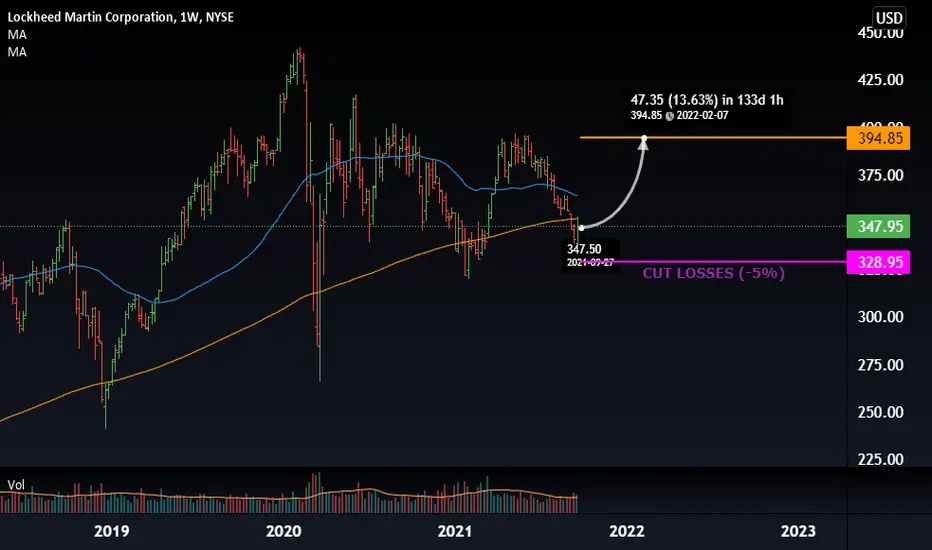
Buy $LMT - NRPicks 24 SepLockheed Martin Corporation, a security and aerospace company, is engaged in the research, design, development, manufacture, integration and maintenance of systems. It operates through: Aeronautics, Missiles and Fire Control, Rotary and Mission Systems, and Space.
Revenue TTM 66.8B
Net Income TTM 7.1B
EBITDA TTM 10.2B
Net Margin TTM 10.8%
EBITDA margin TTM 15.3%
P/E 13.39
P/S 1.43
Dividend yield 3.2%
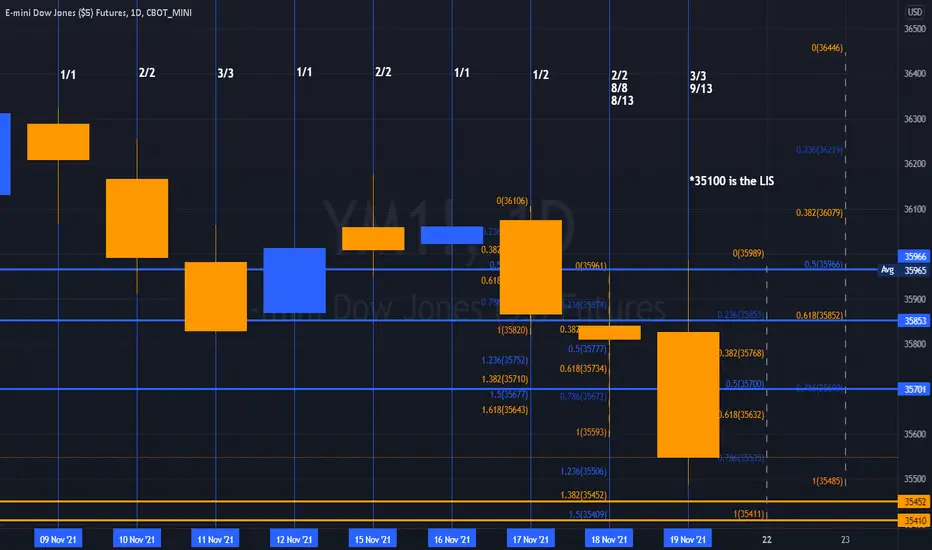
YM - Daily / Weakening StructureLower Price Objective Front Run on Friday's Close.
Pinned to Expiry.
Lower 35100 Price Objective in Trade.
______________________________________________
DOW leading is never a good sign.
It is now in a 13/13 Count with a great many Gaps
below all the way down to 28.212.
34,200
33,700
33,100
31,013
The Larger Weekly TF POs.
______________________________________________
Traders find this difficult to Fathom.
It will depend on ob the Larger Count Structure we indicated
a few weeks back with respect to 4/4 complete or 3/3 Completing.
______________________________________________
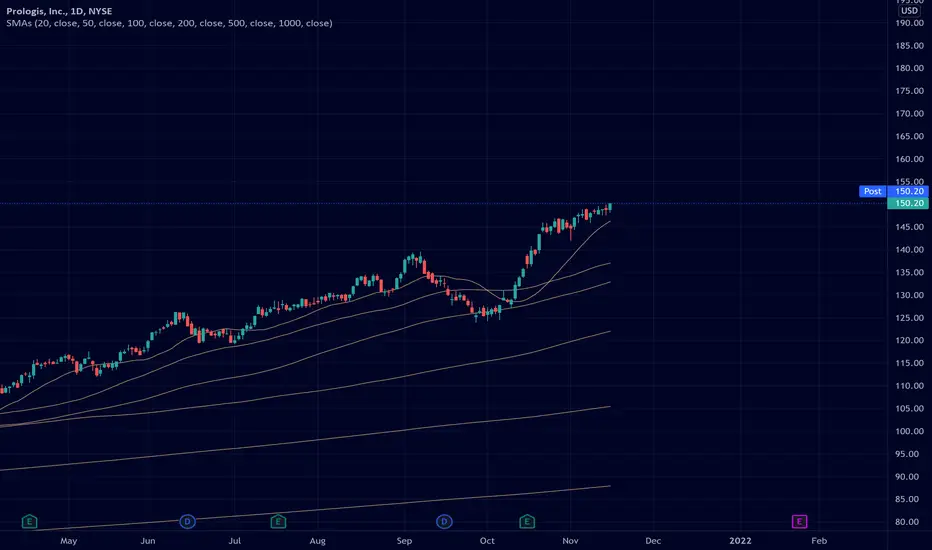
$PLD: Infrastructure Super CycleIndustrial REIT name PLD is one of our topic picks in the real estate space to gain exposure to the infrastructure boom. Potential risks in the market could lead to a run in defensive sector names benefiting PLD.
CMC - Infrastructure Bill Fueled Breakout - Industrial SteelNYSE:CMC - this company is in the correct sector to directly benefit from the infrastructure bill. It is forming a Cup basing formation. If the market reacts positively to the news of the Infrastructure Bill getting signed, the vertically integrated steel producer stands to benefit from all of the national construction products that will ensue, especially if the administration keeps its promises about using domestic materials and labor.
Basing Formation: Cup - depth ~22% - duration ~ 14 weeks
Pivot Point: $36
Target: $40
Stop Loss: $32.5

PRN - Bullish Setup, wait for break PRN bullish on charts on multi time frame.
Points to consider
1. Price above 20 D SMA
2. Price above 20 Week SMA
3. Price above 5 Month MA
4. RSI Bullish on Monthly and Weekly MA
5. RSI looking for support on the Daily TF to reverse up.
6. Nice consolidation on Monthly charts
7. Price trading in a nice range for the last 8 months and setting up bullish structure with Monthly RSI not overbought
Price near All time highs and crucial RSI zones on daily charts, bullish structure.
Look to buy dips in the daily channel for a swing with good RR and look for channel break

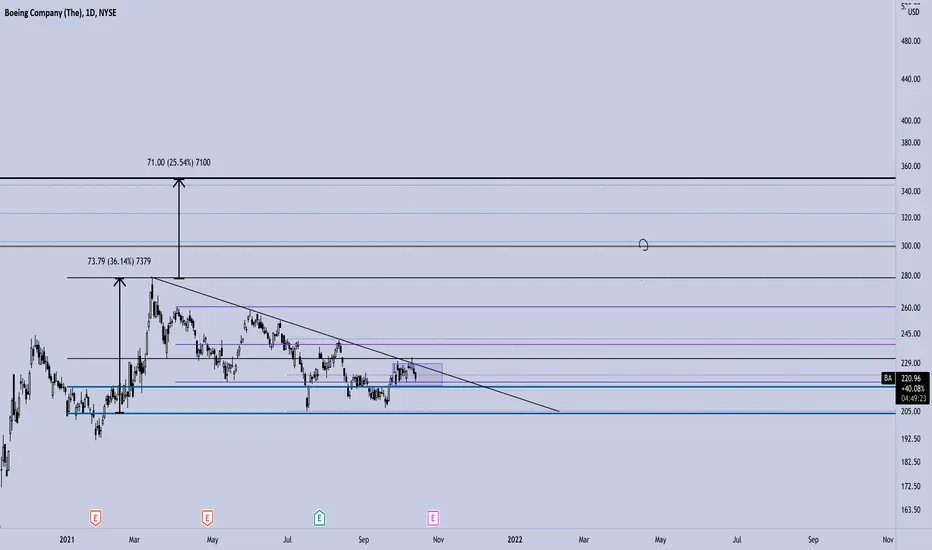
Potential in BoeingBA hasn’t participated much in this bull market recovery. Impacting them are political risks with China continuing to halt repurchases of the the 737 Max for domestic travel use. Imo R/R is favorable for longs at current levels, with much of the negative news already out and factored into the market. It might just be time for BA sooner than bulls and bears believe...
Follow-up on UAL reversal: triple bottom confirmed todayBearish price action of UAL has been on my radar for a hot minute. Long-term support held in mid-July, followed by a break from the channel. RSI divergence suggested a possible reversal, leading to a second bounce at the long-term support. We now have the third bottom at this ascending support, a bullish signature. We can now see the enclosing triangle and extract a price target of $51-$52. It is crucial that the $44 support remains uncompromised in the coming days to validate the pattern.
