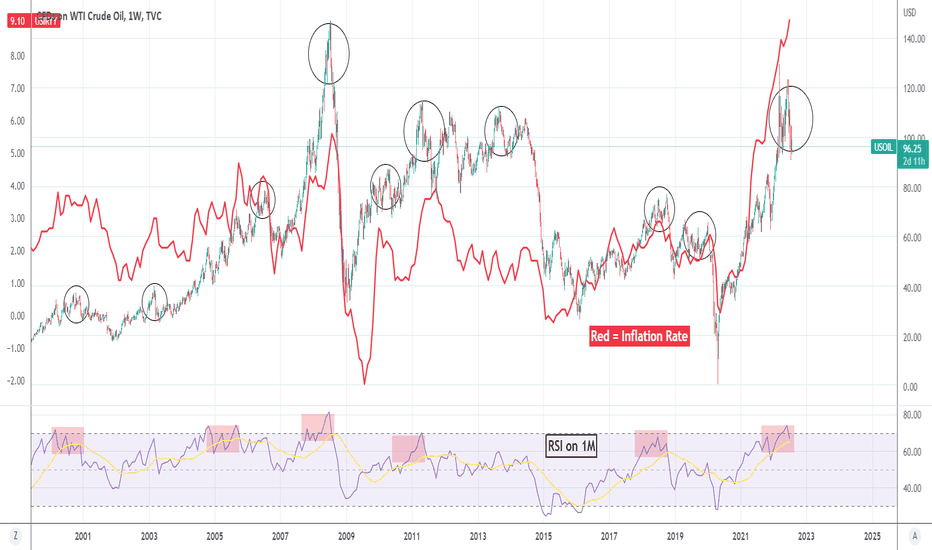
OIL showing that inflation has peaked.Another inflation (red trend-line) cross study, this time against the WTI Oil (USOIL). It is evident that the correlation between the two is very tight and every time the Oil market started forming a top pattern (circles), the Inflation Rate followed it lower shortly.
I will not get into much detail as the chart is pretty self-explanatory. Oil has been on Lower Highs and Lower Lows since the March "war" peak, which is a bearish formation and if it wasn't for that "war" peak, the pattern would have been a Head and Shoulders, which is also a peak formation. With the 1M RSI back below the 70.00 overbought level after breaking above it for the first time since April 2011 and the only the 5th since 2000, it is more likely to have a market top on Oil. As a result, if a correction starts then Inflation which is still on Higher Highs lagging behind, is more likely to peak as well and finally correct back to sustainable levels in the coming months.
--------------------------------------------------------------------------------------------------------
** Please support this idea with your likes and comments, it is the best way to keep it relevant and support me. **
--------------------------------------------------------------------------------------------------------
Inflatiorate
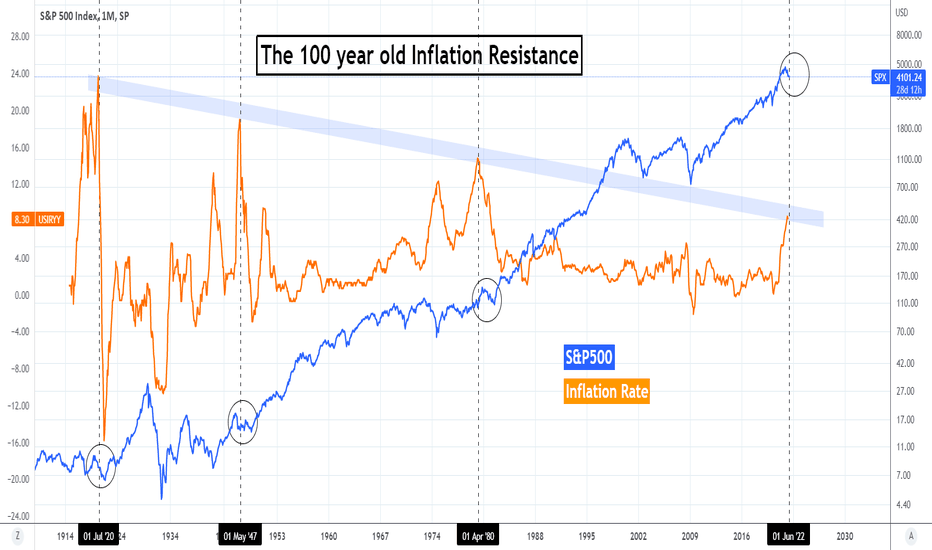
INFLATION testing a 100 year old trend-line. How will S&P react?This is an interesting analysis as the U.S. Inflation Rate (orange trend-line) is testing for the first time since early 1980 a Lower Highs trend-line that started after the High of July 1920, exactly 100 years ago! This Lower Highs trend-line has made another 2 contacts after that and it is interesting to see how the S&P500 index (blue trend-line, SPX) has behaved upon such tests (and rejections).
As you see, every time the Inflation Rate hit that Lower Highs trend-line (Resistance), the S&P500 index went through a roughly 1.5 - 2 year period of correction. This was a high volatility phase, with the S&P500 correction on two out of the three occasions starting before the Inflation Rate hit the Lower Highs zone. Note that even though it was a correction, it was never in the magnitude of a Bear Cycle such as 2000/02, 2008/09 or even worse the 1929/32 Great Depression.
As a result, and since the correction has already started at the start of the year (2022), before the Inflation Rate reached the historic Lower Highs trend-line, we can say that it resembles more the cases of July 1920 and May 1947. Those bottomed on July 1921 and June 1949, so 1 and 2 years respectively after the Lower Highs rejection.
Can this mean that we still have another 1 - 2 years of volatility ahead of us before bottoming? What's your view on this analysis?
--------------------------------------------------------------------------------------------------------
** Please support this idea with your likes and comments, it is the best way to keep it relevant and support me. **
--------------------------------------------------------------------------------------------------------

