INIT/USDT Potential Bullish Reversal After Falling Wedge Break📊 Chart Pattern & Structure
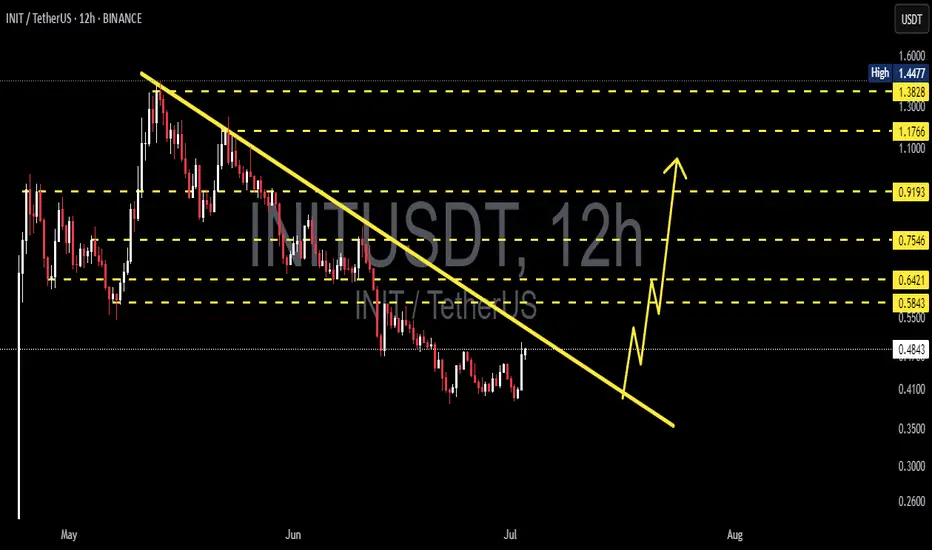
Descending Trendline (Yellow Line): From early May to late June, INIT/USDT formed consistent lower highs and lower lows, creating a strong downtrend structure.
Accumulation Phase: In late June, the price consolidated around the $0.40 – $0.48 range, forming a base and is now attempting a breakout above the descending trendline.
Key Horizontal Resistance Levels (Yellow Dashed Lines):
$0.5843
$0.6421
$0.7546
$0.9193
$1.1766
$1.3828
🚀 Bullish Scenario
If INIT confirms a breakout above the descending trendline, it signals a potential trend reversal from bearish to bullish momentum.
📌 Short to Mid-Term Bullish Targets:
1. $0.5843 – Initial resistance.
2. $0.6421 – Previous support/resistance zone.
3. $0.7546 – Strong resistance with historical significance.
4. $0.9193 – $1.1766 – Mid-term upside targets.
5. $1.3828 – $1.4477 – Long-term target and previous high zone.
📈 Bullish Confirmation Signs:
Increased breakout volume.
Successful retest of the trendline as support.
🐻 Bearish Scenario
If the breakout fails and price falls back below the trendline:
⚠️ Possible Downside Risks:
Rejection back to the $0.4200 – $0.4800 range.
If $0.4200 breaks, price may retest deeper support around $0.3500 – $0.3000.
Breakdown below $0.3000 could lead to a move toward $0.2600 (historical demand).
📐 Pattern Analysis
Falling Wedge / Descending Channel: A typical bullish reversal pattern.
The breakout indicates accumulation and potential impulse movement to the upside.
Aligns with the beginning of a new Elliott Wave cycle (Wave 1 formation).
📝 Strategy Summary
Bullish Setup: Look for a pullback to retest the trendline for a potential long entry, targeting resistance levels step by step.
Bearish Setup: Watch out for a false breakout followed by a breakdown back below the trendline.
#INIT #INITUSDT #CryptoBreakout #FallingWedge #AltcoinAnalysis #TrendReversal #TechnicalAnalysis #CryptoTrading #BullishSetup #CryptoSignals #PriceAction