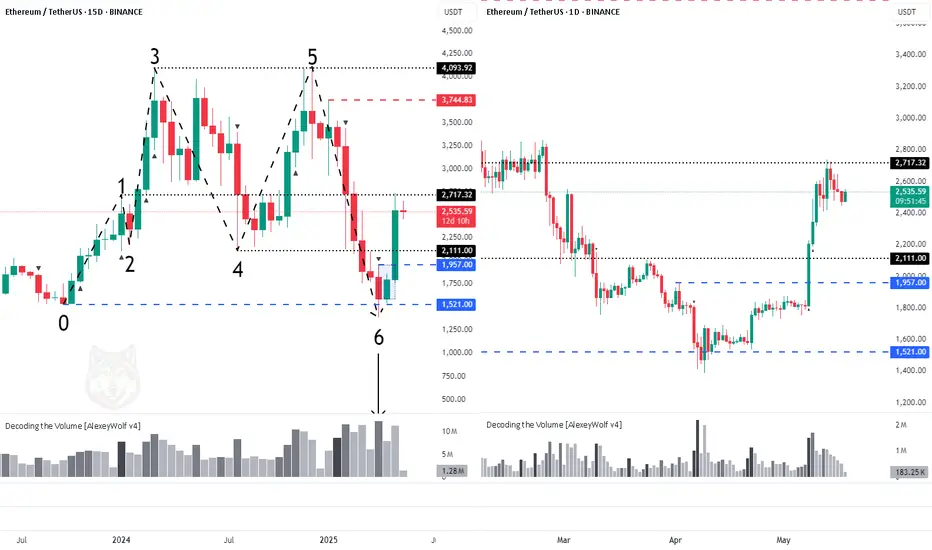
Ethereum: +80% in a Month — What’s Next?Hey traders and investors!
The price of ETH has surged by more than 80% over the past 30 days, but the momentum is starting to slow.
To understand the current position, we’re using the magic of timeframe switching and focusing on the 15-day chart.
Key Observations
1️⃣ A sideways range (consolidation) has formed on the 15D chart, with anchor points 1–6 (see chart).
2️⃣ The last major initiative came from sellers (move from point 5 to 6), and it includes some key features:
The initiative pushed below the lower boundary of the range — $2111.
The highest volume occurred on the last bar of this move (IKC bar).
The IKC bar absorbed liquidity not only below point 4 of the range but also below point 0 — the origin of the price move that preceded the formation of the range.
3️⃣ Buyers began developing their initiative by absorbing the sellers’ IKC bar, pushing price back into the range, and forming a buyer zone (blue rectangle on the chart, with the upper boundary at $1957).
4️⃣ Buyers have already reached the first target — $2717 (point 1 level).
What Does It Mean?
The rapid rally may slow down — the market likely needs some consolidation or a pullback.
A correction toward $2111 or even $1957 is possible. Both zones are attractive for medium-term long setups.
The medium-term bullish scenario remains valid as long as price stays above $2111.
Trade Outlook
📈 Long zones: $2111, $1957, or after a breakout and hold above $2717
🎯 Targets: $3744, then $4100
📉 Shorts are currently not justified — sellers show no real strength
Be ready for a potential “pause” in the rally and watch buyer activity — they currently hold the initiative (!).
This analysis is based on the Initiative Analysis concept (IA).
Wishing you profitable trades!
Initiativeanalysis
Bitcoin: Sellers Still Holding Their GroundHey traders and investors!
On the daily and weekly timeframes – sideways ranges (boundaries marked in black on the chart). The current initiative is from the seller.
📌 Yesterday, the seller made an effort to push the price down — this shouldn't be ignored.
📊 Targets on the chart:
Weekly TF: 96,500
Daily TF: 89,256
10-day TF: 99,475 (upper boundary of the buyer zone)
Although I expect the price to continue moving up, it's not advisable to look for buy setups until clear signs of buyer strength appear.
🚨 Selling is risky (details in the post about the 10-day TF).
👀 Observing.
This analysis is based on the Initiative Analysis concept (IA).
Wishing you profitable trades!
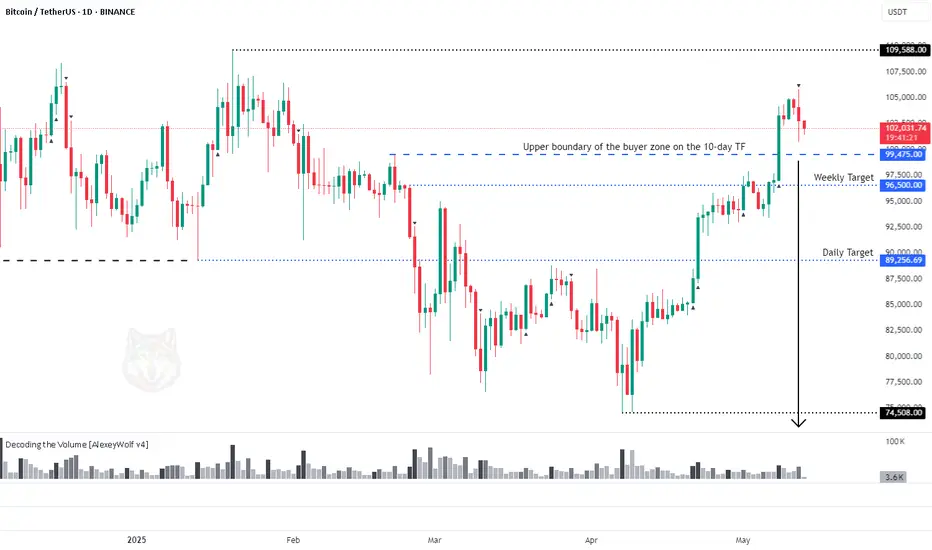
BTC - Ready for a breakout?Hey traders and investors!
On the 10-day chart, an intriguing situation is unfolding.
Sellers tested the Key Candle of the previous accumulation breakout — level 89,256, and the buyer’s initiative resumed.
Then, a manipulation (false breakout) occurred at the 89,256 test level. Volumes reveal the narrative: sellers sold off at high volumes, while buyers absorbed on declining volumes.
Now, a buyer zone has formed below, with the upper boundary at 99,475.
Just a few steps away from the ATH. A pullback is always possible, but for now, there are no signs of weakness (even a pullback to 89,256 wouldn't disrupt the bullish structure).
Now, the main question:
💡 How far up? +30,000?
This analysis is based on the Initiative Analysis concept (IA).
Wishing you profitable trades!

Ripple: Potential for Growth!Hey traders and investors!
🚀 Many crypto assets have reached their local targets.
I can’t predict what will happen next, but I can track how new candles shift the probability of continued growth or decline.
Ripple has strong growth potential.
Both the weekly and daily timeframes show sideways ranges (marked by black lines), with the buyer’s initiative active.
Decision candles (IKC)* on both timeframes interacted with the lower boundary of the buyer’s initiative.
A buyer zone has formed on the weekly timeframe near the lower boundary — marked by a blue rectangle on the chart.
With targets aligning on both timeframes, there’s 25% to first target.
This analysis is based on the Initiative Analysis concept (IA).
* Decision candles — candles with increased volume inside initiatives. IKC — the highest-volume candle within initiatives inside a sideways range
Wishing you profitable trades!

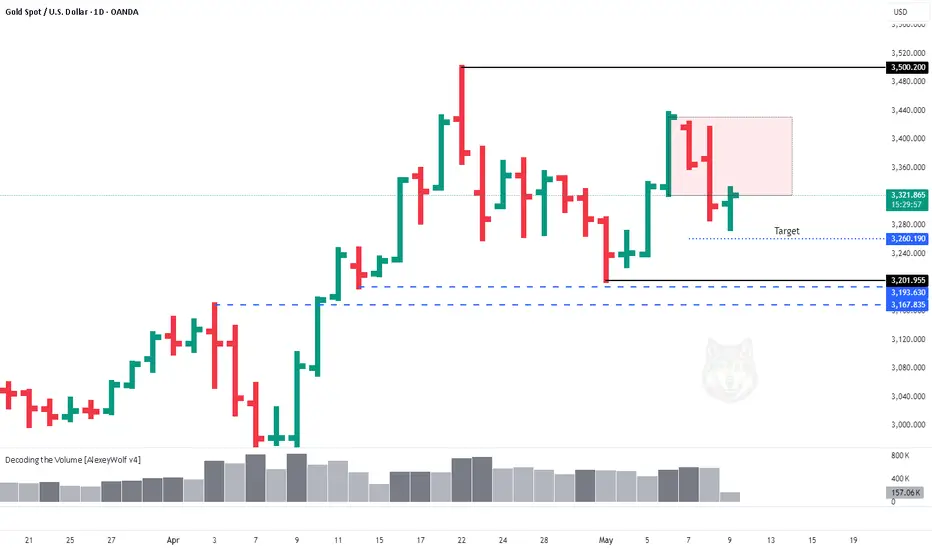
Gold in a Range — Caution for BuyersHey traders and investors!
On the daily timeframe, gold remains in a sideways range (marked by black lines).
The seller's initiative is still active and hasn't reached its target yet.
A seller zone has formed — highlighted by a red rectangle on the chart.
It’s better to look for buy setups around 3260 and 3201-3167.
This analysis is based on the Initiative Analysis concept (IA).
Wishing you profitable trades!
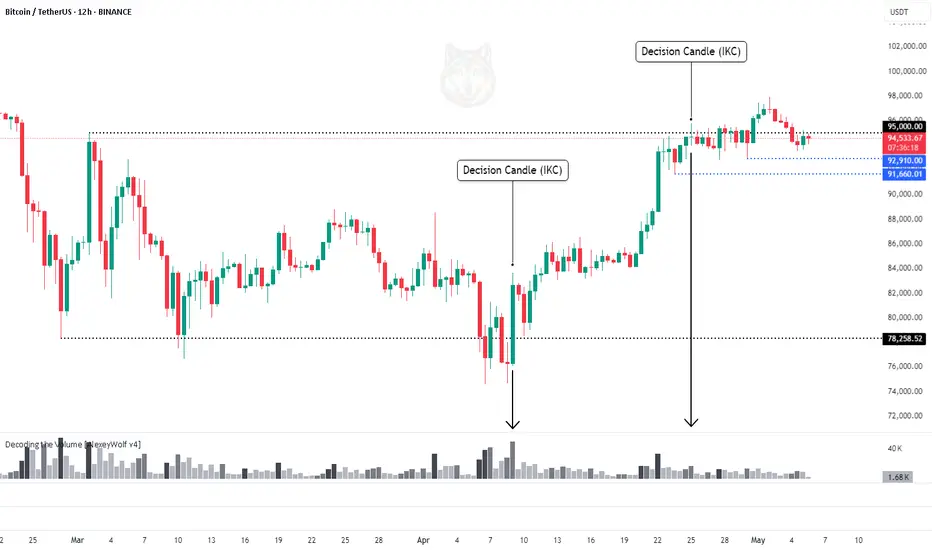
Choosing the Right TimeframeHey traders and investors!
Selecting the right timeframe can reveal a clear picture of price movement. But don’t forget — the higher timeframe always has priority.
🔹 On the 12H, Bitcoin is in a sideways range.
The move from 78,500 to 95,000 could’ve been anticipated — a buyer Decision candle (IKC) formed at the lower boundary of the range gave a strong signal.
The boundaries of the range are marked with black lines on the chart.
What about now?
🔸 No signs of strong selling.
🔸 The last Decision candle (IKC) at the top of the range belongs to the buyer.
🔸 The buyer has already taken out its high.
📉 For shorts — we need seller strength, ideally with price moving below 91,660.
📈 Longs can be considered on lower timeframes, aiming for their local targets.
Not every timeframe gives clear context.
What timeframes do you use to analyze and find trade setups?
This analysis is based on the Initiative Analysis concept (IA).
Wishing you profitable trades!
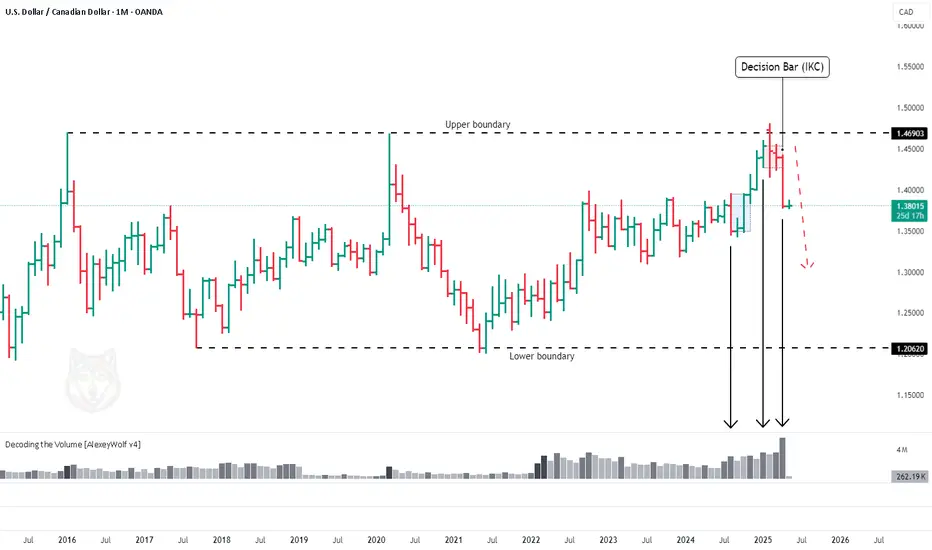
USDCAD Monthly – Seller Initiative in PlayHey traders and investors!
Take a look at the monthly chart of USDCAD.
The price has been in a sideways range for quite some time, and the seller initiative is currently active.
📌 At the upper boundary of the range, a seller zone (red box) has formed, along with a seller-side Decision bar (IKC), which has now hit the buyer zone (blue box).
⚠️ With this structure, it makes more sense to look for short setups.
This analysis is based on the Initiative Analysis concept (IA).
Wishing you profitable trades!
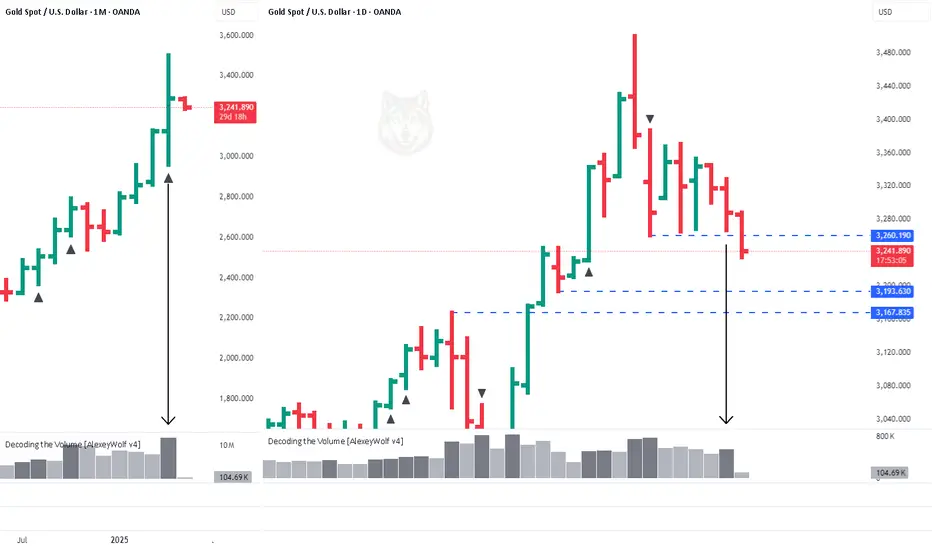
Gold — Buyer Power or Pause?The monthly candle closed as a strong buyer candle with significant volume.
This shows strong interest from both buyers and sellers at current levels.
Yesterday, on the daily timeframe, a seller-side IKC appeared (IKC or decision candle — the highest-volume candle within initiatives inside a sideways range).
That puts the current long targets into question — we now need to see a clear show of buyer strength.
📉 The price is currently near the 50% level of the weekly initiative — 3228.382, which could attract buyers.
Below that, daily support zones are marked on the chart at 3193 and 3167, where the buyer may regain initiative.
🔎 To consider long entries, we need to see:
• Buyer strength, and
• Price returning above 3260.
This analysis is based on the Initiative Analysis concept (IA).
Wishing you profitable trades!
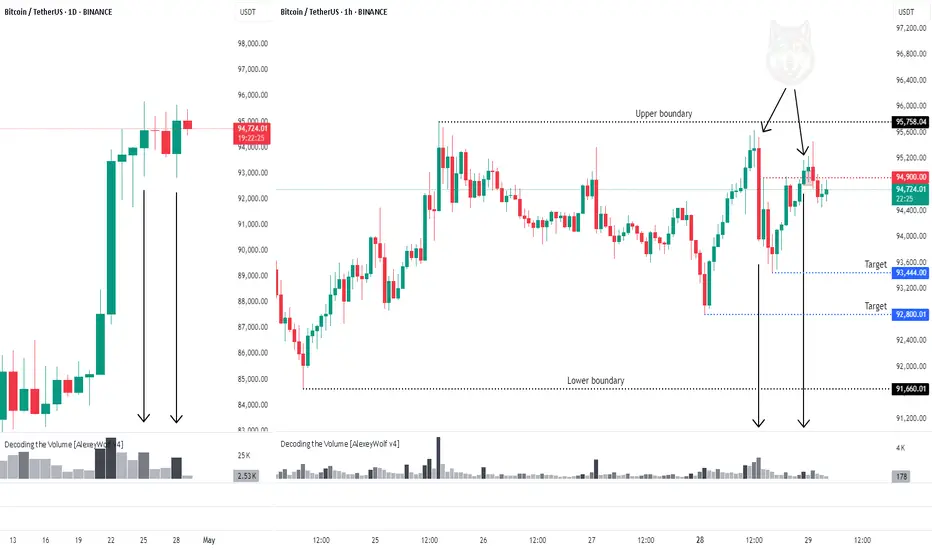
Bitcoin Update: Sell or Wait?Hey traders and investors!
An interesting setup on Bitcoin.
On the 1H timeframe, the market is in a sideways range. The current initiative belongs to the sellers. A clear target is marked on the chart. We also have a seller Decision candle, and a seller zone has formed within its range — a strong signal for short setups.
However, on the daily timeframe, the buyers are still in control, and yesterday’s session closed with increased volume.
On the other hand, Friday also showed a volume spike — but without any meaningful result, and the same happened yesterday.
Sell or not? That’s the question...
The 94,900 level might give us the answer.
This analysis is based on the Initiative Analysis concept (IA).
Wishing you profitable trades!
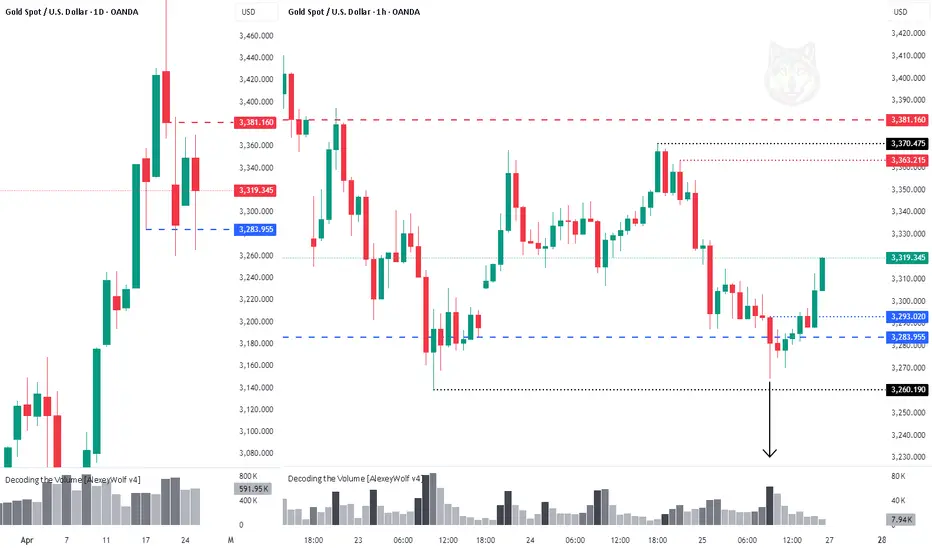
Gold in a Sideways RangeHello traders and investors!
The 3283 level, which was the sellers’ target on the daily timeframe, was confidently defended by buyers.
The attacking seller’s candle at this level showed high volume but was absorbed by buyers.
On the 1H timeframe, the market is moving sideways, with active buyer initiative.
The boundaries of the range are marked on the chart with black lines.
It is reasonable to expect the price to move toward the upper boundary of the range at 3363–3370.
This analysis is based on the Initiative Analysis concept (IA).
Wishing you profitable trades!
Gold. Further downside is possible.Hey traders and investors!
Gold price bounced from a contextual level 3283 — the correction low within the dominant buyer’s initiative on the daily timeframe.
Further downside is possible. Watching levels 3381 and 3283.
The structure in this post is based on the logic of Initiative Analysis (IA).
